. 2021 Jun 9;10(6):1442.
doi: 10.3390/cells10061442.

Riluzole Administration to Rats with Levodopa-Induced Dyskinesia Leads to Loss of DNA Methylation in Neuronal Genes

Affiliations

Riluzole Administration to Rats with Levodopa-Induced Dyskinesia Leads to Loss of DNA Methylation in Neuronal Genes

Luca Pagliaroli et al. Cells. .

Abstract

Dyskinesias are characterized by abnormal repetitive involuntary movements due to dysfunctional neuronal activity. Although levodopa-induced dyskinesia, characterized by tic-like abnormal involuntary movements, has no clinical treatment for Parkinson's disease patients, animal studies indicate that Riluzole, which interferes with glutamatergic neurotransmission, can improve the phenotype. The rat model of Levodopa-Induced Dyskinesia is a unilateral lesion with 6-hydroxydopamine in the medial forebrain bundle, followed by the repeated administration of levodopa. The molecular pathomechanism of Levodopa-Induced Dyskinesia is still not deciphered; however, the implication of epigenetic mechanisms was suggested. In this study, we investigated the striatum for DNA methylation alterations under chronic levodopa treatment with or without co-treatment with Riluzole. Our data show that the lesioned and contralateral striata have nearly identical DNA methylation profiles. Chronic levodopa and levodopa + Riluzole treatments led to DNA methylation loss, particularly outside of promoters, in gene bodies and CpG poor regions. We observed that several genes involved in the Levodopa-Induced Dyskinesia underwent methylation changes. Furthermore, the Riluzole co-treatment, which improved the phenotype, pinpointed specific methylation targets, with a more than 20% methylation difference relative to levodopa treatment alone. These findings indicate potential new druggable targets for Levodopa-Induced Dyskinesia.

Keywords: DNA methylation; Reduced Representation Bisulfite Sequencing (RRBS); Riluzole; Tourette syndrome; abnormal involuntary movements; dyskinesia; epigenetics; levodopa.


Conflict of interest statement

This study has been performed in part in Boehringer Ingelheim Pharma GmbH & Co. KG laboratories. The funders had no role in the design of the study; in the collection, analyses, or interpretation of data; in the writing of the manuscript; or in the decision to publish the results.

Figures

Figure 1
Figure 1
Schematic representation of the experimental workflow. Rats received a unilateral injection of 6-OHDA at PND 21 followed by a 2-weeks sub-chronic treatment (from PND 35 to PND 49) according to their respective group (L-DOPA, UNT, L-DOPA + Riluzole). The rats received one final treatment at PND 53; striata were collected and analyzed for changes in methylation levels.
Figure 2
Figure 2
Distribution of CpGs detected by RRBS in the rat genome. (A) Distribution of CpGs in the genome (promoter, exon, intron, intergenic) (B) Distribution of CpGs in areas of different CG density (CpG island, CpG shores, other). (C) Number of differentially methylated sites (DMSs) in the experimental groups (L-DOPA vs. UNT control side, L-DOPA vs. UNT lesioned side, L-DOPA vs. L-DOPA + R control side, L-DOPA vs. L-DOPA + R lesioned side, L-DOPA + R vs. UNT control side, and L-DOPA + R vs. UNT lesioned side) classified as hyper- or hypomethylated. (D) Genomic distribution of CpG methylation changes. Distribution of hypermethylated and hypomethylated CpGs in L-DOPA treated vs. UNT rats. Distribution of hypermethylated and hypomethylated CpGs in L-DOPA + Riluzole treated vs. UNT rats.
Figure 3
Figure 3
Characterization of DMS. (A,B) Distribution of genomic distances between neighboring DMS in L-DOPA vs. UNT and L-DOPA + R vs. UNT groups shown in red. The average of 100 random distributions of genomic distances of the same number of CpGs is shown in black. The overlap is shown in grey. The small difference in the shape of the random distributions between the two panels is due to the higher number of DMS in the L-DOPA + R vs. UNT comparison leading to shorter average distances between two random CpGs. (C) Scatter plot of CpGs present in both L-DOPA vs. UNT and L-DOPA + R vs. UNT comparisons. The plot shows the methylation changes in the treated animals of each CpG relative to the UNT animals. The red dots indicate CpGs, which are DMS in both comparisons. Pearson’s R values are also shown in grey and red. (D) shows the results of the GO term enriched analysis performed using DMS detected in L-DOPA vs. UNT (upper panel) and L-DOPA + R vs. UNT (lower panel) comparisons.
Figure 4
Figure 4
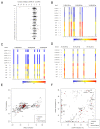
Comparison of DMS from L-DOPA vs. UNT and L-DOPA + R vs. UNT. (A) Difference of the number of DMS/bin of 1 Mb between L-DOPA + R vs. UNT and L-DOPA vs. UNT comparisons. Each dot corresponds to one bin. Black and grey colors alternate throughout the different chromosomes, numbered on the left side of the panel. (BD) Methylation of selected genomic regions from bins indicated by red dots on panel (A) (B: Chr1: 5S rRNA, C: Chr11: Pigx, and D: Chr14: Commd1 genes) (E) Plot of methylation changes are shown for DMS from either L-DOPA + R vs. UNT or L-DOPA vs. UNT comparisons. Only DMS from CpGs analyzed in both comparisons are shown if the methylation difference between L-DOPA and L-DOPA + R samples is at least 20%. Red dots indicate DMS of genes with relevance to LID. Grey circles indicate intergenic DMS. (F) DMS of L-DOPA vs. L-DOPA + R comparison. DMS of genes with relevance are indicated in red.

References

    1. Sanger T.D., Chen D., Fehlings D.L., Hallett M., Lang A.E., Mink J.W., Singer H.S., Alter K., Ben-Pazi H., Butler E.E., et al. Definition and classification of hyperkinetic movements in childhood. Mov. Disord. 2010;25:1538–1549. doi: 10.1002/mds.23088. - DOI - PMC - PubMed
    1. Pandey S., Srivanitchapoom P. Levodopa-induced Dyskinesia: Clinical Features, Pathophysiology, and Medical Management. Ann. Indian Acad. Neurol. 2017;20:190–198. - PMC - PubMed
    1. Tran T.N., Vo T.N.N., Frei K., Truong D.D. Levodopa-induced dyskinesia: Clinical features, incidence, and risk factors. J. Neural. Transm. 2018;125:1109–1117. doi: 10.1007/s00702-018-1900-6. - DOI - PubMed
    1. Bezard E., Hill M.P., Crossman A.R., Brotchie J.M., Michel A., Grimee R., Klitgaard H. Levetiracetam improves choreic levodopa-induced dyskinesia in the MPTP-treated macaque. Eur. J. Pharmacol. 2004;485:159–164. doi: 10.1016/j.ejphar.2003.11.065. - DOI - PubMed
    1. Du H., Nie S., Chen G., Ma K., Xu Y., Zhang Z., Papa S.M., Cao X. Levetiracetam Ameliorates L-DOPA-Induced Dyskinesia in Hemiparkinsonian Rats Inducing Critical Molecular Changes in the Striatum. Parkinson’s Dis. 2015;2015:253878. doi: 10.1155/2015/253878. - DOI - PMC - PubMed

Publication types