Review
. 2021 Jun 16;13(12):3008.
doi: 10.3390/cancers13123008.

Biologically-Based Mathematical Modeling of Tumor Vasculature and Angiogenesis via Time-Resolved Imaging Data

Affiliations
Review

Biologically-Based Mathematical Modeling of Tumor Vasculature and Angiogenesis via Time-Resolved Imaging Data

David A Hormuth 2nd et al. Cancers (Basel). .

Abstract

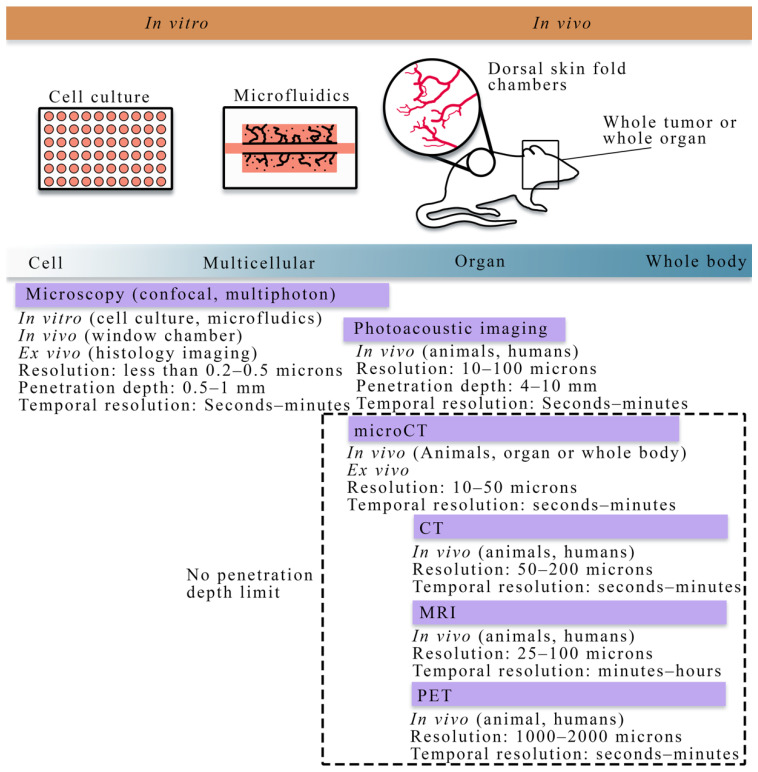
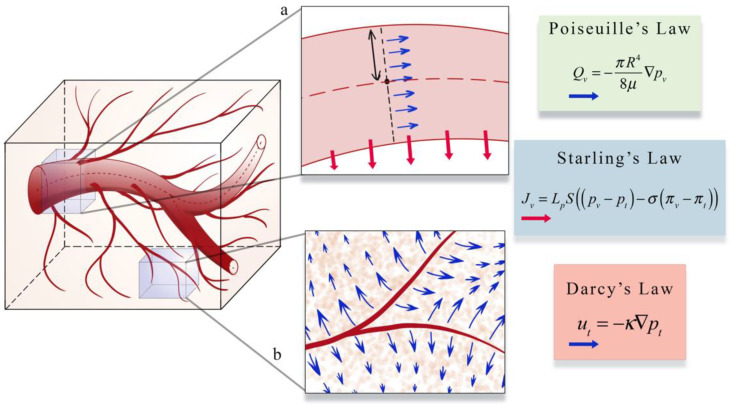
Tumor-associated vasculature is responsible for the delivery of nutrients, removal of waste, and allowing growth beyond 2-3 mm3. Additionally, the vascular network, which is changing in both space and time, fundamentally influences tumor response to both systemic and radiation therapy. Thus, a robust understanding of vascular dynamics is necessary to accurately predict tumor growth, as well as establish optimal treatment protocols to achieve optimal tumor control. Such a goal requires the intimate integration of both theory and experiment. Quantitative and time-resolved imaging methods have emerged as technologies able to visualize and characterize tumor vascular properties before and during therapy at the tissue and cell scale. Parallel to, but separate from those developments, mathematical modeling techniques have been developed to enable in silico investigations into theoretical tumor and vascular dynamics. In particular, recent efforts have sought to integrate both theory and experiment to enable data-driven mathematical modeling. Such mathematical models are calibrated by data obtained from individual tumor-vascular systems to predict future vascular growth, delivery of systemic agents, and response to radiotherapy. In this review, we discuss experimental techniques for visualizing and quantifying vascular dynamics including magnetic resonance imaging, microfluidic devices, and confocal microscopy. We then focus on the integration of these experimental measures with biologically based mathematical models to generate testable predictions.

Keywords: computational fluid dynamics; computational oncology; confocal microscopy; magnetic resonance imaging; partial differential equations; perfusion; systems biology; treatment response; vascular growth.


Conflict of interest statement

The authors declare no conflict of interest.

Figures

Figure 1
Figure 1
Overview of cell to tissue scale imaging. Experimental platforms from the cell to tissue scales consist of cell culture (to investigate cell dynamics), microfluidics (a perfused cell culture platform to observe angiogenesis), skin fold window chambers (an in vivo platform for optical imaging), and small animal or human whole organ and body imaging (for in vivo studies). Imaging techniques (purple bars) vary across spatial and temporal scales. In vitro imaging consists primarily of the microscopies (e.g., confocal, multiphoton). In vivo imaging is achievable with all the imaging techniques shown above; however, there are limitations in the penetration depth for microscopy and photoacoustic imaging. Magnetic resonance imaging (MRI), positron emission tomography (PET), and computed tomography (CT) are primarily in vivo techniques capable of whole animal or human imaging. Whole animal or body imaging is feasible with microCT, though it is typically used for whole organ or ex vivo imaging.
Figure 2
Figure 2
Overview of cell-scale models of angiogenesis. (Panels a and b) present a hypothetical biological scenario in which new vasculature is recruited via angiogenesis in response to tumor angiogenic factors (TAF) released by tumor cells. Continuum models (panel c) describe this phenomenon in terms of endothelial cell densities and the concentration of TAF. Partial differential equations (PDEs) provide a continuous representation of endothelial densities and often describe the spatial and temporal evolution via diffusion, haptotaxis, and chemotaxis terms. Alternatively, discrete models (panel d) can be used to explicitly describe the movement and behavior of each individual endothelial cell. Hybrid models (panel e) generally combine both discrete and continuum approaches to model TEC movement and endothelial cell densities, respectively, in response to TAF.
Figure 3
Figure 3
Continuum description of angiogenesis. The continuum description of angiogenesis developed by Anderson et al. [23] describes the spatial and temporal change in endothelial cell density (n) as the function of diffusion, chemotaxis along tumor angiogenic factor (c) gradients, and haptotaxis along fibronectin (f) gradients. Endothelial cell diffusion is characterized by a diffusion coefficient D, chemotaxis is characterized by chemotaxis coefficients χ0 and k1, and haptotaxis is characterized by the haptotaxis coefficient ρ0. In the presence of other cells endothelial cell movement via diffusion is directed away from high densities of n (white arrows in the illustration), otherwise the movement via diffusion is random. Both chemotaxis and haptotaxis result in endothelial cell movement towards higher concentration of c or f (black arrows in the illustration), respectively. The change in fibronectin distribution over time is the function of the production at rate ω by endothelial cells and the uptake at rate μ by endothelial cells. The change in tumor angiogenic factor distribution is described by the uptake at rate λ by endothelial cells. The general formulation of the left-hand side of the equation expressing the rate of change of a quantity of interest, and the right-hand side describing all the ways it can change is frequently the over-arching guide for constructing such models.
Figure 4
Figure 4
Overview of tissue-scale models of angiogenesis and vasculature. There are four main approaches to modeling tumor-induced angiogenesis and vasculature at the tissue scale level. (Panel a) provides an example of a discrete modeling approach [122,123] used to describe the evolving geometry of tumor vasculature in response to tumor growth. This simulation employs a 3D continuous multi-species tumor growth model coupled to a 1D discrete model of angiogenesis. The tissue domain initially features a small spherical tumor core, which grows in response to the changing vasculature network. The colors in the network show the nutrient volume fraction. (Panel b) displays how the function of existing tumor vasculature in the breast can be studied with computational fluid dynamics [33] to estimate hemodynamic properties of the vascular network. In (panel c), diffusion weighted (DW-) and DCE-MRI acquired in a murine brain tumor model (C6 glioma) are used to provide tumor volume fraction and blood volume fraction estimates to initialize and calibrate a model of tumor-induced angiogenesis. The model derived estimates of tumor and blood volume fraction are overlaid on an axial T2-weighted MRI through the center slice of the tumor. A coupled set of PDEs [32] are used to describe the proliferation, diffusion and death of tumor cells and the angiogenesis, diffusion, and regression of the vasculature. In (panel d), estimates of tissue perfusion in the breast derived from quantitative imaging are coupled with a mathematical model of drug delivery [86] and tumor growth to observe the effect of tumor vasculature on drug distribution and tumor response to treatment. Both the left and right images in (panel d) show quantitative maps of DCE-MRI parameters or drug concentration overlaid on an anatomical image acquired in the same plane. The right drug concentration map is an enlargement of the computational domain.
Figure 5
Figure 5
Illustration of a perfusion and transport model. Intravascular and interstitial flow is characterized by the laws of Poiseuille, Starling, and Darcy. Inset a illustrates Poiseuille’s and Starling’s law. Poiseuille’s law relates intravascular flow (Qv, blue arrows in inset a) to the radius of the vessel (R), the dynamic viscosity of blood μ, and the gradient of the intravascular pressure pv. Starling’s law relates the rate of extravasation (Jv, red arrows in inset b) to the hydraulic conductivity of the vessel wall (Lp), the vascular surface area (S), the reflection coefficient (σ), the vascular oncotic pressure (πv), and the interstitial oncotic pressure (πt). Inset b shows an illustration of Darcy’s law which relates the interstitial flow velocity (mt, blue arrows in inset b) to the interstitial tissue hydraulic conductivity ), and the gradient of interstitial pressure (pt). These three relations are found throughout the literature on the physical modeling of tumor associated vascular flow and angiogenesis.

References

    1. Folkman J., Bach M., Rowe J.W., Davidoff F., Lambert P., Hirsch C., Goldberg A., Hiatt H.H., Glass J., Henshaw E. Tumor Angiogenesis—Therapeutic Implications. N. Engl. J. Med. 1971;285:1182–1186. - PubMed
    1. Folkman J. In: Tumor Angiogenesis. Klein G., Weinhouse S., Haddow A.B.T.-A., editors. Volume 19. Academic Press; Cambridge, MA, USA: 1974. pp. 331–358.
    1. Carmeliet P. Angiogenesis in health and disease. Nat. Med. 2003;9:653–660. doi: 10.1038/nm0603-653. - DOI - PubMed
    1. Jain R.K., di Tomaso E., Duda D.G., Loeffler J.S., Sorensen A.G., Batchelor T.T. Angiogenesis in brain tumours. Nat. Rev. Neurosci. 2007;8:610–622. doi: 10.1038/nrn2175. - DOI - PubMed
    1. Folkman J. Angiogenesis in cancer, vascular, rheumatoid and other disease. Nat. Med. 1995;1:27–30. doi: 10.1038/nm0195-27. - DOI - PubMed

LinkOut - more resources