. 2021 Jun 30;21(13):4482.
doi: 10.3390/s21134482.

NE-Motion: Visual Analysis of Stroke Patients Using Motion Sensor Networks

Affiliations

NE-Motion: Visual Analysis of Stroke Patients Using Motion Sensor Networks

Rodrigo Colnago Contreras et al. Sensors (Basel). .

Abstract

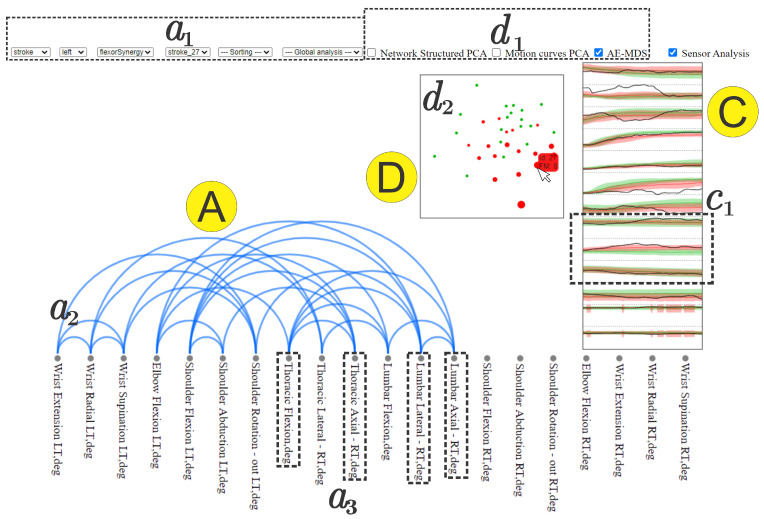
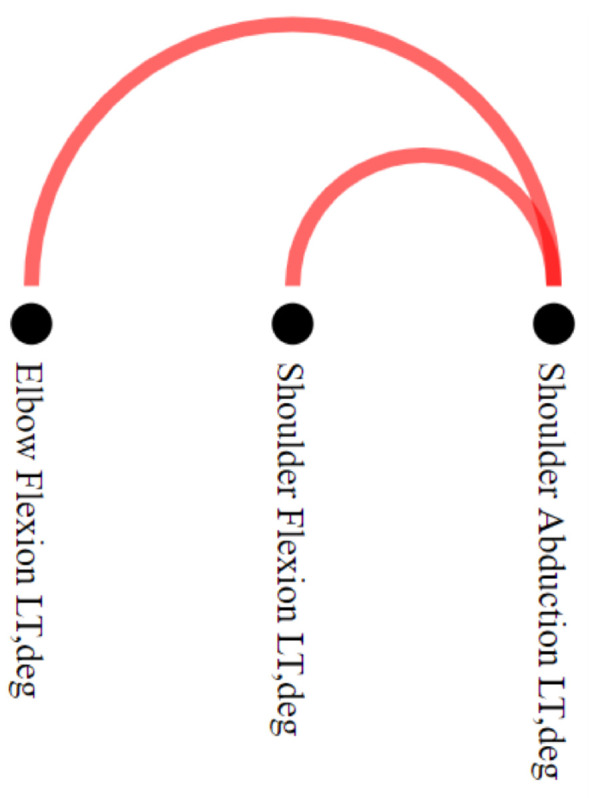
A large number of stroke survivors suffer from a significant decrease in upper extremity (UE) function, requiring rehabilitation therapy to boost recovery of UE motion. Assessing the efficacy of treatment strategies is a challenging problem in this context, and is typically accomplished by observing the performance of patients during their execution of daily activities. A more detailed assessment of UE impairment can be undertaken with a clinical bedside test, the UE Fugl-Meyer Assessment, but it fails to examine compensatory movements of functioning body segments that are used to bypass impairment. In this work, we use a graph learning method to build a visualization tool tailored to support the analysis of stroke patients. Called NE-Motion, or Network Environment for Motion Capture Data Analysis, the proposed analytic tool handles a set of time series captured by motion sensors worn by patients so as to enable visual analytic resources to identify abnormalities in movement patterns. Developed in close collaboration with domain experts, NE-Motion is capable of uncovering important phenomena, such as compensation while revealing differences between stroke patients and healthy individuals. The effectiveness of NE-Motion is shown in two case studies designed to analyze particular patients and to compare groups of subjects.

Keywords: graph learning; set theory; stroke; visual analytics; visualization.


Conflict of interest statement

The authors declare no conflict of interest. The funding agencies had no role in the design of the study; in the collection, analyses, or interpretation of data; in the writing of the manuscript, or in the decision to publish the results.

Figures

Figure 1
Figure 1
Construction of the networks associated to an individual pk. One network for each movement.
Figure 2
Figure 2
NE-Motion visualization tool. Component A is responsible for presenting the pairwise relation (a2) between joint angles (a3) resulting from a filtering, which is interactively specified by filtering menu (a1). The visualization component B details the result of the filter and enables the comparison of movements while providing an overview of the time series. In this case, b1 graphically represents the numerical ratio between healthy control (green bar) and stroke patients (red bar); b2 is a scatter plot of the statistical measure defined in b3 extracted from the time series of each joint angle; in b4, a mirrored graph is shown between average healthy control motion curves (at the top in green) and stroke patients (at the bottom in red) for each joint angle that makes up the selected edge. Component C shows the statistical summary extracted from the filtered time series associated with the joint angles, also allowing a visual comparison of a particular individual against the summary. While, in c1, we see an overview that takes into account all the joint angles that have some synchronization between them, in c2, we see in detail the summary of only one joint angle at a time. Component D enables the comparison of the individuals through projections, defined in menu (d1), and presented in an interactive chart (d2).
Figure 3
Figure 3
Statistical curve based summary of the time series behavior of stroke patients and healthy control individuals in a particular joint angle (thoracic lateral). The green and red curves refer to healthy control and stroke patients respectively. The average (μCTRL and μstroke) and standard deviation (σCTRL and σstroke) curves summarize the behavior of each group of individuals.
Figure 4
Figure 4
Using NE-Motion to identify patterns and analyze particular individuals. We use components A, C, and D, discussed in Figure 2. In a1, we defined the domain of interest: the individual “stroke_27” and the flexor synergy movement performed with the left side of the body. In the right of the image (component C), we can see the time series (mean and standard deviation curves) that describe the UE joint angles of healthy (green curves) and stroke (red curves) individuals who performed exercise “flexor synergy” with the left side of the body, representing a global analysis. In the center, plot (d2) shows the MDS projection of the deep features extracted with an autoencoder, indicated as AE-MDS on d1, from the time series of healthy individuals (green circle) and stroke individuals (red circle), representing the local analysis. The tool allows the user to select an individual through mouse hover event, which triggers, in the second resource, the display of the time series in c1 (in black) of all the joint angles of the selected individual and also shows in d2 a tag with his/her FMA score for the movement. The dashed rectangles in the bottom (a3 component) highlight nodes in the Pairwise Relations View component that have a large number of connections (a2). The dashed rectangle on the right (c1) highlights truncal motion curves that can be associated with compensatory motion in lumbar and thoracic spine.
Figure 5
Figure 5
Using two different projection schemes ((a) AE-MDS and (b) PCA) in the Comparison View component to assess how close stroke patients are to the healthy individuals. All individuals who performed the “flexor synergy” movement are represented in both projections, with green circles representing healthy and red circles representing stroke. The larger the diameter of a red circle, the lower the individual’s FMA score, indicating more impairment. In both projections, we can note good separation between the group of control individuals and stroke patients who performed the movement with less difficulty (smaller circles) from the group formed by stroke patients with more difficulty in movement (larger circles). In addition, the individual “stroke_27” is represented close to patients with a similar level of impairment to FMA scores.
Figure 6
Figure 6
Visualizing information about the motion curves of three thoracic joint angles ((a) thoracic flexion, (b) thoracic lateral, and (c) thoracic axial) using the Comparison View zoom resource. In this case, NE-Motion considers the respective motion curves of all individuals who performed the flexor synergy movement with the left side. Average motion curves are represented by the red line (stroke individuals) and the green line (healthy individuals). The area around these average curves is defined by the distance between them and the standard deviation of the motion curves for each category of individuals considered. The black curve is the motion curves of the “stroke_27” patient. We can notice that the motion curves of the analyzed individual do not present smoothness and are very different from average curves in all cases. Specifically, in (b), we see that the joint angle assumes values even outside the standard deviation of the affected individual motion curves. This can serve as an indication for intense compensatory actions of the patient.
Figure 7
Figure 7
Use of Pairwise Relations View in “Differences” special filtering, which uses different colors to represent the edges that are only present in stroke patients (red) or healthy individuals (green). In the case study, comparing the data generated considering “Shoulder Flexion 90 to 180” for the left side, only the red edges between elbow flexion and shoulder abduction, and shoulder flexion and shoulder abduction persisted. These edges are not present in any network of healthy individuals, indicating that the synchronizations in question may be associated with abnormalities in movement.
Figure 8
Figure 8
Detailed Relation View showing a detailed view of the time series associated to joint angles, “Shoulder Abduction” and “Elbow Flexion”. The black curve in b4 shows the data from one stroke individual (“stroke_4”) performing the “Shoulder Flexion 90 to 180”. In the component, there are seven stroke individuals (b1 and b2) for which these joint angles are significantly synchronized, and the average motion curve of these individuals is shown in b4 for each of these joint angles as a red area mirrored on the y axis. This shows that “Shoulder Abduction” and “Elbow Flexion” are synchronized, suggesting the intrusion of flexor synergy. Note the absence of healthy control information (green circles and green curve) for this edge, indicating that synchronous activity in these joint angles does not normally occur in healthy movement.

References

    1. Warlow C.P., Van Gijn J., Dennis M.S., Wardlaw J.M., Bamford J.M., Hankey G.J., Sandercock P.A., Rinkel G., Langhorne P., Sudlow C., et al. Stroke: Practical Management. John Wiley & Sons; Hoboken, NJ, USA: 2011.
    1. Bonita R., Mendis S., Truelsen T., Bogousslavsky J., Toole J., Yatsu F. The global stroke initiative. Lancet Neurol. 2004;3:391–393. doi: 10.1016/S1474-4422(04)00800-2. - DOI - PubMed
    1. Fugl-Meyer A.R., Jääskö L., Leyman I., Olsson S., Steglind S. The post-stroke hemiplegic patient. 1. A method for evaluation of physical performance. Scand. J. Rehabil. Med. 1975;7:13–31. - PubMed
    1. Del Din S., Patel S., Cobelli C., Bonato P. Estimating Fugl-Meyer clinical scores in stroke survivors using wearable sensors; Proceedings of the 2011 Annual International Conference of the IEEE Engineering in Medicine and Biology Society; Boston, MA, USA. 30 August–3 September 2011; pp. 5839–5842. - PubMed
    1. Wang J., Yu L., Wang J., Guo L., Gu X., Fang Q. Automated Fugl-Meyer assessment using SVR model; Proceedings of the 2014 IEEE International Symposium on Bioelectronics and Bioinformatics (IEEE ISBB 2014); Chung Li, Taiwan. 11–14 April 2014; pp. 1–4.