. 2021 Jun 30;22(13):7057.
doi: 10.3390/ijms22137057.

Behind Brain Metastases Formation: Cellular and Molecular Alterations and Blood-Brain Barrier Disruption

Affiliations

Behind Brain Metastases Formation: Cellular and Molecular Alterations and Blood-Brain Barrier Disruption

Joana Godinho-Pereira et al. Int J Mol Sci. .

Abstract

Breast cancer (BC) brain metastases is a life-threatening condition to which accounts the poor understanding of BC cells' (BCCs) extravasation into the brain, precluding the development of preventive strategies. Thus, we aimed to unravel the players involved in the interaction between BCCs and blood-brain barrier (BBB) endothelial cells underlying BBB alterations and the transendothelial migration of malignant cells. We used brain microvascular endothelial cells (BMECs) as a BBB in vitro model, under conditions mimicking shear stress to improve in vivo-like BBB features. Mixed cultures were performed by the addition of fluorescently labelled BCCs to distinguish individual cell populations. BCC-BMEC interaction compromised BBB integrity, as revealed by junctional proteins (β-catenin and zonula occludens-1) disruption and caveolae (caveolin-1) increase, reflecting paracellular and transcellular hyperpermeability, respectively. Both BMECs and BCCs presented alterations in the expression pattern of connexin 43, suggesting the involvement of the gap junction protein. Myosin light chain kinase and phosphorylated myosin light chain were upregulated, revealing the involvement of the endothelial cytoskeleton in the extravasation process. β4-Integrin and focal adhesion kinase were colocalised in malignant cells, reflecting molecular interaction. Moreover, BCCs exhibited invadopodia, attesting migratory properties. Collectively, hub players involved in BC brain metastases formation were unveiled, disclosing possible therapeutic targets for metastases prevention.

Keywords: adhesion; blood–brain barrier; breast cancer brain metastases; cellular communication; extravasation; paracellular and transcellular migration.


Conflict of interest statement

The authors declare no conflict of interest.

Figures

Figure 1
Figure 1
Shear stress (SS) promotes brain microvascular endothelial properties. Confluent monolayers of the brain endothelioma cell line b.End5 were exposed to physiological laminar non-pulsatile SS for 25 and 48 h. SS effects were evaluated by immunofluorescence analysis of the tight and adherens junction proteins (A) zonula occludens (ZO)-1 and (B) β-catenin, respectively, which showed a delocalisation of the proteins towards the cell membrane and a decrease in membrane gaps (white arrows). Hoechst 33342 was used as counterstaining for nuclei (blue). Scale bar: 20 µm. Semi-quantitative analysis of ZO-1 expression showed (C) a slight increase in staining intensity, from 25 to 48 h, and a (D) marked decrease in cell membrane gaps, while β-catenin presented (E) a notorious increase in fluorescence intensity, and (F) a clear cellular elongation. Data are given as means ± SEM (n = 3, 10 fields/condition). A Student’s t-test for mean intensity and a Mann–Whitney test for membrane gaps and cell elongation were used to evaluate the significant differences, where * p < 0.05 and *** p < 0.001 or $$$ p < 0.001 denote differences between the indicated timepoints.
Figure 2
Figure 2
Adherens junctions are compromised during interaction between breast cancer cells and brain microvascular endothelial cells. Confluent monolayers of the brain endothelioma cell line b.End5 under physiological laminar non-pulsatile shear stress were exposed to 4T1 breast cancer cells (previously labelled with CellTracker™ DMTPX Red Dye) for 1, 3, 6 and 24 h and the expression of the adherens junction protein, β-catenin, in single and mixed cultures was evaluated by immunofluorescence analysis. (A) Analysis of the expression of β-catenin (green) revealed that the protein is present in both cell types, with a different cellular distribution in mixed cultures as compared with single ones, and further revealed a loss of elongation in b.End5 cells exposed to 4T1 cells (white arrows). Hoechst 33342 was used as counterstaining for nuclei (blue). Scale bar: 20 µm. Semi-quantitative analysis revealed (B) a decrease in endothelial β-catenin intensity in mixed culture at 24 h, (C) particularly notorious at the cell membrane, which was validated by the (D) plot profile analysis of the membrane region pointed out with the yellow brackets. Scale bar: 20 µm. The characterisation of 4T1 cells was performed by the quantification of the (E) area of tumoural clusters, which increased over time in single cultures, and (F) number of clusters, which decreased at 24 h in single culture. Data are given as means ± SEM (n = 3, 10 fields/condition). A one-way ANOVA was used to evaluate the significant differences within single and mixed cultures along time, represented by ## p < 0.01 and ### p < 0.001, and to evaluate the significant differences between single and mixed cultures at the same timepoint, represented by ** p < 0.01 and *** p < 0.001. A Mann–Whitney test was used to evaluate the significant differences between single and mixed cultures at 24 h of membrane β-catenin intensity, represented by $$$ p < 0.001.
Figure 3
Figure 3
Tight junctions are compromised during interaction between breast cancer cells and brain microvascular endothelial cells. Confluent monolayers of the brain endothelioma cell line b.End5 under physiological laminar non-pulsatile shear stress were exposed to 4T1 breast cancer cells (previously labelled with CellTracker™ DMTPX Red Dye) for 1, 3, 6 and 24 h and the expression of the tight junction protein, zonula occludens-1 (ZO-1), in single and mixed cultures was evaluated by immunofluorescence analysis. (A) Analysis of the expression of ZO-1 (green) revealed that this protein is present in both cell types, with a different cellular distribution and disorganisation in b.End5 cells exposed to 4T1 cells (white arrows). Hoechst 33342 was used as counterstaining for nuclei (blue). Scale bar: 20 µm. (B) Analysis of membrane ZO-1 expression (grey) in b.End5 cells in mixed culture at 24 h revealed the presence of membrane gaps (insets and black arrows in the plot, which corresponds to the membrane region pointed out in yellow). Scale bar: 20 µm. (C) Semi-quantitative analysis revealed an increase in the number of membrane gaps in b.End5 cells in mixed cultures. (D) Inspection of the endothelial monolayer revealed holes (dotted lines) near 4T1 cells (red). Scale bar: 15 µm. Data are given as means ± SEM (n = 3, 10 fields/condition). Mann–Whitney test was used to evaluate the significant differences of membrane gaps, represented by $$$ p < 0.001.
Figure 4
Figure 4
Vesicular trafficking alterations occur during breast cancer cell and brain microvascular endothelial cell interaction. Confluent monolayers of the brain endothelioma cell line b.End5 under physiological laminar non-pulsatile shear stress were exposed to 4T1 breast cancer cells (previously labelled with CellTracker™ DMTPX Red Dye) for 1, 3, 6 and 24 h and the expression of the main protein of caveolae, caveolin-1 (cav-1), in single and mixed cultures was evaluated by immunofluorescence analysis. (A) Analysis of the expression of cav-1 (green) revealed that the vesicular trafficking protein is present in both cell types, with a different cellular distribution and disorganisation in b.End5 cells (white arrows) exposed to 4T1 cells. Hoechst 33342 was used as counterstaining for nuclei (blue). Scale bar: 20 µm. (B) Semi-quantitative analysis revealed an increase in endothelial cav-1 intensity in mixed cultures vs. single culture. (C) Cav-1-positive vesicles were analysed in b.End5 cells in single and in mixed cultures at 24 h and representative images of the original and algorithm-based detected spots (red) are shown (up and down images, respectively); semi-quantitative analysis revealed an increase in the number of vesicles in mixed cultures as compared with single cultures. Scale bar: 10 µm. Data are given as means ± SEM (n = 3, 10 fields/condition). A one-way ANOVA was used to evaluate the significant differences between single and mixed cultures at the same timepoints, represented by ** p < 0.01 and *** p < 0.001. A Mann–Whitney test was used to evaluate the significant differences of the number of caveolae at 24 h represented by $$$ p < 0.001.
Figure 5
Figure 5
Alterations in the expression pattern of the gap junction protein connexin 43 (Cx43) occur during interaction between breast cancer cells and brain microvascular endothelial cells. Confluent monolayers of the brain endothelioma cell line b.End5 under physiological laminar non-pulsatile shear stress were exposed to 4T1 cells (previously labelled with CellTracker™ DMTPX Red Dye) for 1, 3, 6 and 24 h, and the expression of Cx43 in single and mixed cultures was evaluated by immunofluorescence analysis. (A) Analysis of the expression of Cx43 (green) revealed that this gap junction protein is present in both cell types. Hoechst 33342 was used as counterstaining for nuclei (blue). Scale bar: 20 µm. (B) One of each cell type is shown with a greater magnification (indicated by arrow heads in panel A) to better elucidate the differences observed in Cx43 expression and localisation in single and mixed cultures. Scale bar: 5 µm.
Figure 6
Figure 6
Interaction between breast cancer cells and brain microvascular endothelial cells leads to cytoskeleton rearrangement. Confluent monolayers of the brain endothelioma cell line b.End5 under physiological laminar non-pulsatile shear stress were exposed to 4T1 breast cancer cells (previously labelled with CellTracker™ DMTPX Red Dye) for 1, 3, 6 and 24 h and the expression of myosin light chain kinase (MLCK), as well as of phosphorylated myosin light chain (p-MLC), in single and mixed cultures was evaluated by immunofluorescence analysis. (A) Analysis of the expression of MLCK (yellow) revealed that the cytoskeleton-associated protein is present in both cell types, with a marked overexpression in b.End5 cells exposed to 4T1 cells at 6 h (as shown by the white arrows). Hoechst 33342 was used as counterstaining for nuclei (blue). Scale bar: 20 µm. (B) Semi-quantitative analysis revealed an increase in endothelial MLCK intensity in mixed cultures, particularly at 6 h. A significant increase in (C) cytoplasmic and (D) nuclear MLCK in mixed cultures compared with single ones was observed. (E) Cytoskeleton rearrangements were confirmed by the increase in p-MLC (yellow) observed in the cytoplasm of b.End5 cells (circumscribed by dotted line) exposed to 4T1 cells at 6 h. Hoechst 33342 was used as counterstaining for nuclei (blue). Scale bar: 10 µm. (F) Semi-quantitative analysis of the morphology of p-MLC stained b.End5 revealed a decrease in elongation upon incubation with 4T1 cells for 6 h. Data are given as means ± SEM (n = 3, 10 fields/condition). A one-way ANOVA was used to evaluate the significant differences within single and mixed cultures along time, represented by ### p < 0.001, and to evaluate the significant differences between single and mixed cultures at the same timepoints, represented by * p < 0.05 and *** p < 0.001. A Mann–Whitney test was employed to evaluate the significant differences in cytoplasmic intensity, represented by $$$ p < 0.001. A two-tailed Student’s t-test was used to evaluate the significant differences in nuclear intensity and cell elongation, represented by *** p < 0.001.
Figure 7
Figure 7
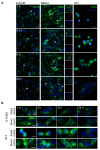
Interaction between breast cancer cells and brain microvascular endothelial cells leads to activation of adhesion-related signalling pathways. Confluent monolayers of the brain endothelioma cell line b.End5 under physiological laminar non-pulsatile shear stress were exposed to 4T1 breast cancer cells (previously labelled with CellTracker™ DMTPX Red Dye) for 1, 3, 6 and 24 h and the expression of focal adhesion kinase (FAK) and β4-integrin in single and mixed cultures was evaluated by immunofluorescence analysis. (A) Analysis of the expression of FAK (purple) revealed that the protein is present in both cell types, with an early overexpression, followed by a decrease in b.End5 cells exposed to 4T1 cells (white arrows). (B) Plot profiles showed notorious alterations in FAK (grey, cell border identified as dotted grey line) cell localisation and decreased expression in b.End5 in mixed culture as compared with single culture at 24 h. (C) Analysis of the expression of β4-integrin (green) showed that the protein is expressed in both cell types, with no changes in mixed cultures, and highlighted invadopodia formation in 4T1 cells in both single and mixed culture (white arrows). Hoechst 33342 was used as counterstaining for nuclei (blue). Scale bar: 20 µm. (D) Semi-quantitative analysis of β4-integrin expression revealed an increased content in b.End5 in single and mixed cultures along time. (E) Nuclear β4-integrin-positive b.End5 cells in close vicinity to 4T1 increased along time. (F) Semi-quantitative analysis of β4-integrin intensity per 4T1 clusters revealed a decrease in mixed cultures as compared with single ones. (G) Quantitative analysis of the number of 4T1 cells forming invadopodia revealed an increase post 3 h of culture in both single and mixed culture. (H) Double-labelling with β4-integrin and FAK depicted a notorious difference in the proteins’ cellular distribution in b.End5 and 4T1 cells both in single and mixed culture, shown by the colocalisation analysis revealing that both proteins colocalise in 4T1 cells (white coloration). Hoechst 33342 was used as counterstaining for nuclei (blue). Scale bar: 20 µm. Data are given as means ± SEM (n = 3, 10 fields/condition). One-way ANOVA was used to evaluate the significant differences within single and mixed cultures along time, represented by # p < 0.05, ## p < 0.01 and ### p < 0.001, and to evaluate the significant differences between single and mixed cultures at the same timepoints, represented by * p < 0.05 and *** p < 0.001. A Kruskal–Wallis test was used to evaluate the significant differences in the percentage of 4T1 cells forming invadopodia in single and mixed cultures along time, represented by $ p < 0.05 and $$ p < 0.01. A two-tailed Student’s t-test was used to evaluate the significant differences along time in b.End5 cells in mixed cultures with increased nuclear β4-integrin, represented by ## p < 0.01 and ### p < 0.001.
Figure 8
Figure 8
Schematic representation of the players involved in the interaction between brain microvascular endothelial cells (BMECs) and breast cancer cells (BCCs). Along time, BCCs form clusters that increase in size. BMECs, upon contact with BCCs, suffer several alterations, where junctional impairment, indicated by β-catenin and zonula occludens (ZO)-1, and endothelial monolayer hole formation are noticeable at later timepoints. Additionally, cytoskeleton rearrangements occur through an increase in myosin light chain kinase (MLCK) and phosphorylated myosin light chain (p-MLC), resulting in BMEC contraction and transcytosis upregulation shown by the increase in the vesicular content of caveolin-1 (cav-1), supporting endothelial paracellular and transcellular hyperpermeability involvement in BCCs’ transmigration. BCCs present migratory properties seen by the formation of invadopodia. The expression alterations in connexin 43 (Cx43) suggest that this gap junction protein is involved in the interaction between BMECs and BCCs. β4-Integrin in invadopodium and β4-integrin-focal adhesion kinase (FAK) colocalisation point to their role in intercellular adhesion and BCC migration.
Figure 9
Figure 9
Schematic representation of the experimental design of the mouse breast cancer brain METABLE 5. was seeded at the concentration of 5 × 10⁴ cells/mL onto collagen-I coated coverslips (50 μg/mL) to allow a confluent monolayer formation during 48 h, after which physiological laminar shear stress (1.5 dyn/cm2) was applied by orbital rotation. After 24 h, mixed culture was initiated by the seeding of 1 × 10⁵ cell/mL murine mammary carcinoma triple-negative cells (4T1) previously labelled with CellTracker™ DMTPX Red Dye (2.5 μM) onto b.End5 monolayers. Single cultures (b.End5 and 4T1 cells) were run in parallel, as controls. Cell cultures were fixed at 1, 3, 6 and 24 h for immunofluorescence analysis.

References

    1. Sung H., Ferlay F., Siegel R.L., Laversanne M., Soerjomataram I., Jemal A., Bray F. Global cancer statistics 2020: GLOBOCAN estimates of incidence and mortality worldwide for 36 cancers in 185 countries. CA Cancer J. Clin. 2021;71:209–249. doi: 10.3322/caac.21660. - DOI - PubMed
    1. Kimberly D., Miller K.D., Nogueira L., Mariotto A.B., Rowland J.H., Yabroff K.R., Alfano C.M., Jemal A., Kramer J.L., Siegel R.L. Cancer treatment and survivorship statistics, 2019. CA Cancer J. Clin. 2019;69:363–385. - PubMed
    1. Riggio A.I., Varley K.E., Welm A.L. The lingering mysteries of metastatic recurrence in breast cancer. Br. J. Cancer. 2021;124:13–26. doi: 10.1038/s41416-020-01161-4. - DOI - PMC - PubMed
    1. Branco V., Pimentel J., Brito M.A., Carvalho C. Thioredoxin, glutathione and related molecules in tumors of the nervous system. Curr. Med. Chem. 2020;27:1878–1900. doi: 10.2174/0929867326666190201113004. - DOI - PubMed
    1. Krishnan M., Krishnamurthy J., Shonka N. Targeting the sanctuary site: Options when breast cancer metastasizes to the brain. Oncology. 2019;33:683730. - PubMed

MeSH terms