. 2021 Jun 29;12(7):989.
doi: 10.3390/genes12070989.

Synovium-Synovial Fluid Axis in Osteoarthritis Pathology: A Key Regulator of the Cartilage Degradation Process

Affiliations

Synovium-Synovial Fluid Axis in Osteoarthritis Pathology: A Key Regulator of the Cartilage Degradation Process

Dhanashri Ingale et al. Genes (Basel). .

Abstract

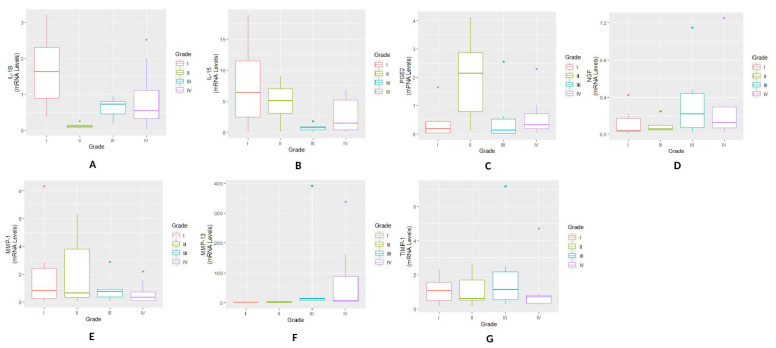
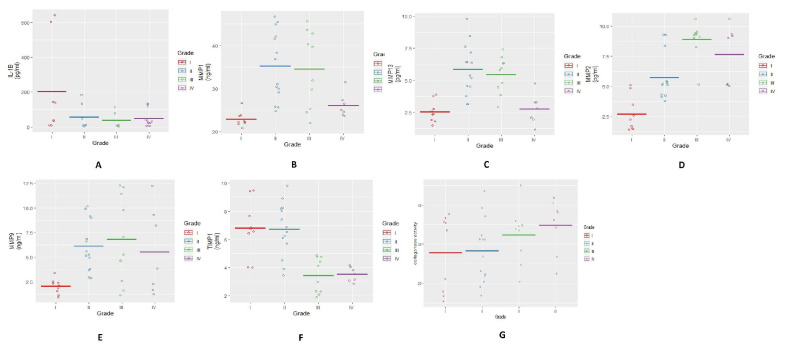
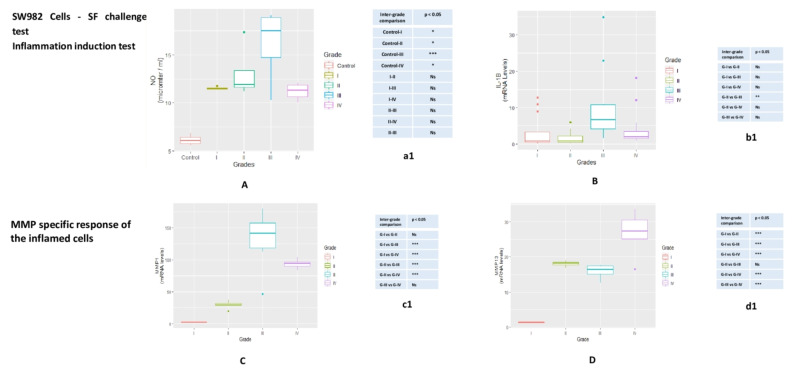
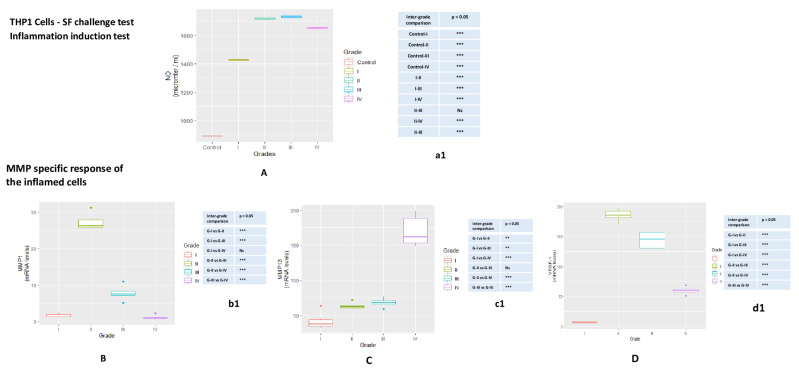
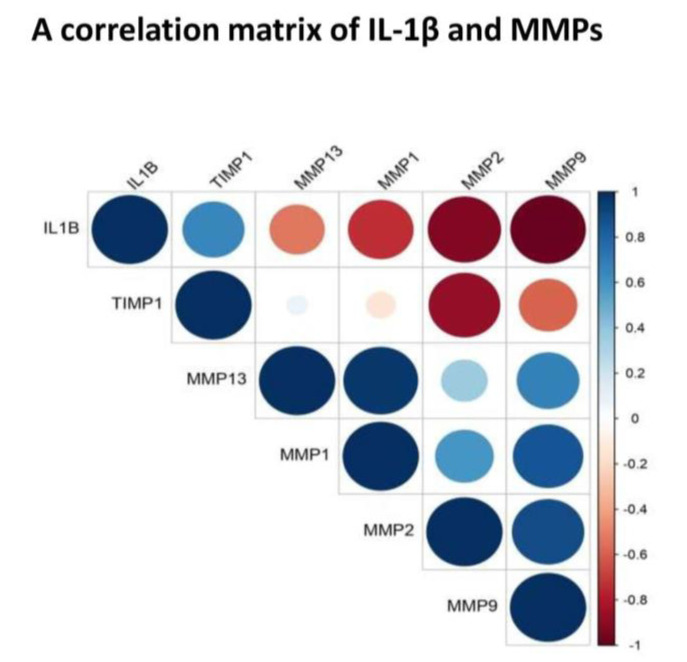
Failure of conventional anti-inflammatory therapies in osteoarthritis (OA) underlines the insufficient knowledge about inflammatory mechanisms, patterns and their relationship with cartilage degradation. Considering non-linear nature of cartilage loss in OA, a better understanding of inflammatory milieu and MMP status at different stages of OA is required to design early-stage therapies or personalized disease management. For this, an investigation based on a synovium-synovial fluid (SF) axis was planned to study OA associated changes in synovium and SF along the progressive grades of OA. Gene expressions in synovial-biopsies from different grades OA patients (N = 26) revealed a peak of IL-1β, IL-15, PGE2 and NGF in early OA (Kellgren-Lawrence (KL) grade-I and II); the highest MMP levels were found in advanced stages (KL grade-III and IV). MMPs (MMP-1, 13, 2 and 9) abundance and FALGPA activity estimated in forty SFs of progressive grades showed the maximum protein levels and activity in KL grade-II and III. In an SF challenge test, SW982 and THP1 cells were treated with progressive grade SFs to study the dynamics of MMPs modulation in inflammatory microenvironment; the test yielded a result pattern, which matched with FALGPA and the protein-levels estimation. Inflammatory mediators in SFs served as steering factor for MMP up-regulation. A correlation-matrix of IL-1β and MMPs revealed expressional negative correlation.

Keywords: FALGPA; Kellgren–Lawrence radiographic grades; MMPs; inflammatory mediators; osteoarthritis; synovial-fluid; synovitis.


Conflict of interest statement

The authors declare no conflict of interest.

Figures

Figure 1
Figure 1
Synovial biopsy gene expression study—various pro-inflammatory markers and MMP expressions were estimated in synovial biopsy samples obtained from different grades of OA patients (n = 26) (A) a grade-wise expression of IL-1β; the highest expression was found in the samples collected from OA patients with KL grade-I and the lowest expression was noted in KL grade-II samples. A significant difference was noted between KL grade-I and II (p < 0.05). (B) expression trend of IL-15 showed a grade-wise decline. A trivial increase was noted in KL grade-IV samples; the highest expression was noted in KL grade-I biopsies. A significant difference was noted between KL grade-I and III (p < 0.05). (C) a grade-wise expression trend of PGE2 with the highest expression in KL grade-II biopsies; inter-grade comparison did not reveal any significant difference among all the KL grades. (D) expression pattern of NGF, where the highest expression was seen in KL grade-IV synovial samples; no significant difference was noted among the grades during inter-grade comparison. (E) a grade-wise expression trend of MMP-1, where a grade-wise decline was found in the expression; the highest expression of MMP-1 was seen in KL grade-I biopsies. (F) expression pattern of MMP-13 showed a grade-wise increase; the highest expression was noted in the KL grade-III. (G)TIMP-1 revealed a comparable expression trend in all the KL grades. MMP-1, MMP-13 and TIMP-1 did not reveal any statistically significant difference for inter-grade comparison.
Figure 2
Figure 2
Estimation of MMP abundance (in protein forms) and activity in OA SFs. (A) a scatter plot depicting grade-wise estimation of IL-1β; the highest value of IL-1β was found in SFs of KL grade-I. A grade-wise decline was seen in the levels; no statistically significant difference was noted in inter-grade comparison. (B) a grade-wise pattern of MMP-1 revealed maximum abundance in SFs from KL grade-II and III; a significant difference in MMP-1 was noted between KL grade-I and II (p < 0.001), KL grade-I and grade-III (p < 0.01) and KL grade-II and grade-IV (p < 0.05). (C) depicts grade-wise estimation of MMP-13; the highest levels were found in SFs from KL grade-II and III; statistically significant difference in MMP-13 was noted between KL grade-I and grade-II (p < 0.001), KL grade-I and III (p < 0.001), KL grade-II and IV (p < 0.001) and KL grade-III and grade-IV (p < 0.01). (D) a grade-wise expression of MMP-2 showed maximum abundance in KL grade-III samples; a marked difference was seen between KL grade-I and II (p < 0.001), KL grade-I and III (p < 0.001), KL grade-I and IV (p < 0.001) and KL grades-II and III (p < 0.001). (E) a grade-wise estimation of MMP-9 revealed the highest level in moderate OA SFs (KL grade-II and grade-III). In inter-grade comparison, a significant difference was noted between KL grade-I and KL grade-II (p < 0.05) and also between KL grade-I and grade-III (p < 0.05). (F) demonstrates a grade-wise estimation of TIMP-1 level; higher levels were seen in early grade samples (KL grade-I and II); in inter-grade comparison, a marked difference was noted between KL grade-I and III (p < 0.001), KL grade-I and IV (p < 0.001), KL grade-II and III and KL grade-II and IV (p < 0.001). (G) shows a grade-wise MMP activity measured using synthetic substrate FALGPA; maximum activity was estimated in SFs from KL grade-II and III, while the lowest activity was found in KL grade-I SFs. No significant difference was noted in inter-grade comparison.
Figure 3
Figure 3
SF challenge test on SW982 cells—this test was performed to assess MMPs modulation in inflamed SW982. The cells were treated with 5% SFs (of culture media) of progressive OA grades for 72 hrs to induce inflammation. Inflammation induction test—(A) NO release after 72 hrs of SF treatment on SW982 cells (B) mRNA levels of IL-β estimated in SW982 cell after 72 hrs SF treatment. This set of experiments was performed as a confirmation test for successful inflammation induction in the cells after the treatment with SFs from progressive OA patients. For SW982 cells, statistical difference in NO and IL-1β levels observed during inter-grade comparison and compared to the control is showed in tables a1 and b1 respectively. MMP specific response of the inflamed cells—(C) MMP-1: a grade-wise up-regulation was noted, where the highest increase in the expression level was found in the cells, which were treated with SFs from KL grade-III; (D) MMP-13: a grade-wise increase in the expression was noted with the highest expression in the cells treated with SFs from KL grade-IV. The difference revealed during inter-grade comparison for MMP-1, MMP-13 on SW982 cells is showed in the tables—c1 and d1, respectively. * p < 0.05, ** p < 0.01, *** p < 0.001. Ns = non-significant.
Figure 4
Figure 4
SF challenge test on THP1 cells—the test was carried out to assess MMPs modulation in inflamed THP1. These cells were treated with 10% SFs (of culture media) of progressive OA grades for 48 hrs in order to induce inflammation. Inflammation induction test—(A) NO release after 48 hrs of SF treatment on THP1 cells; NO significance, revealed during inter-grade comparison is showed in table a1. MMP-specific response of the inflamed cells—(B) MMP-1: the highest rise in the expression in the cells treated with SFs from KL grade-II; (C) MMP-13: a grade-wise elevation was seen in MMP-13 expression; the maximum up-regulation was found in the cells treated with SFs from KL grade-IV; (D) VEGF: the highest estimation of VEGF was in the cells treated with KL grade-II SFs that was followed by a grade-wise decline in the expression; the lowest expression was seen in the cells treated with SFs from KL grade-I. Inter-grade difference for MMP-1, MMP-13 and VEGF−1 on the cells is showed in tables b1, c1 and d1, respectively. * p < 0.05, ** p < 0.01, *** p < 0.001.
Figure 5
Figure 5
Correlation matrix of IL-1β, MMP-1, MMP-13, MMP-2, MMP-9 and TIMP−1. The matrix was developed using a cumulative mean value (mean of all grades) estimated from SF for each selected marker. It revealed a negative correlation between—IL-β and MMP-1 (correlation coefficient: −0.74); IL-1β and MMP-2 (correlation coefficient: −0.92); IL-1β and MMP-9 (correlation coefficient: −0.98); IL-1β and MMP-13 (correlation coefficient: −0.52); It showed a strong positive correlation between MMP-1 and MMP-13 (correlation coefficient: 0.96) as well as between MMP-2 and MMP-9 (correlation coefficient: 0.90).

References

    1. Robinson W.H., Lepus C.M., Wang Q., Raghu H., Mao R., Lindstrom T.M., Sokolove J. Low-grade inflammation as a key mediator of the pathogenesis of osteoarthritis. Nat. Rev. Rheumatol. 2016;12:580–592. doi: 10.1038/nrrheum.2016.136. - DOI - PMC - PubMed
    1. Sohn D.H., Sokolove J., Sharpe O., Erhart J.C., Chandra P.E., Lahey L.J., Lindstrom T.M., Hwang I., Boyer K.A., Andriacchi T.P., et al. Plasma proteins present in osteoarthritic synovial fluid can stimulate cytokine production via toll-like receptor 4. Arthritis Res. Ther. 2012;14:R7. doi: 10.1186/ar3555. - DOI - PMC - PubMed
    1. Pessler F., Dai L., Diaz-Torne C., Gomez-Vaquero C., Paessler M.E., Zheng D.-H., Einhorn E., Range U., Scanzello C., Schumacher H.R. The synovitis of “non-inflammatory” orthopaedic arthropathies: A quantitative histological and immunohistochemical analysis. Ann. Rheum. Dis. 2008;67:1184–1187. doi: 10.1136/ard.2008.087775. - DOI - PubMed
    1. Haseeb A., Haqqi T. Immunopathogenesis of osteoarthritis. Clin. Immunol. 2013;146:185–196. doi: 10.1016/j.clim.2012.12.011. - DOI - PMC - PubMed
    1. Sokolove J., Lepus C. Role of inflammation in the pathogenesis of osteoarthritis: Latest findings and interpretations. Ther. Adv. Musculoskelet. Dis. 2013;5:77–94. doi: 10.1177/1759720X12467868. - DOI - PMC - PubMed

Publication types

MeSH terms