. 2021 Jun 29;12(7):996.
doi: 10.3390/genes12070996.

Abnormal Long Non-Coding RNAs Expression Patterns Have the Potential Ability for Predicting Survival and Treatment Response in Breast Cancer

Affiliations

Abnormal Long Non-Coding RNAs Expression Patterns Have the Potential Ability for Predicting Survival and Treatment Response in Breast Cancer

Ana Carolina Pavanelli et al. Genes (Basel). .

Abstract

Abnormal long non-coding RNAs (lncRNAs) expression has been documented to have oncogene or tumor suppressor functions in the development and progression of cancer, emerging as promising independent biomarkers for molecular cancer stratification and patients' prognosis. Examining the relationship between lncRNAs and the survival rates in malignancies creates new scenarios for precision medicine and targeted therapy. Breast cancer (BRCA) is a heterogeneous malignancy. Despite advances in its molecular classification, there are still gaps to explain in its multifaceted presentations and a substantial lack of biomarkers that can better predict patients' prognosis in response to different therapeutic strategies. Here, we performed a re-analysis of gene expression data generated using cDNA microarrays in a previous study of our group, aiming to identify differentially expressed lncRNAs (DELncRNAs) with a potential predictive value for response to treatment with taxanes in breast cancer patients. Results revealed 157 DELncRNAs (90 up- and 67 down-regulated). We validated these new biomarkers as having prognostic and predictive value for breast cancer using in silico analysis in public databases. Data from TCGA showed that compared to normal tissue, MIAT was up-regulated, while KCNQ1OT1, LOC100270804, and FLJ10038 were down-regulated in breast tumor tissues. KCNQ1OT1, LOC100270804, and FLJ10038 median levels were found to be significantly higher in the luminal subtype. The ROC plotter platform results showed that reduced expression of these three DElncRNAs was associated with breast cancer patients who did not respond to taxane treatment. Kaplan-Meier survival analysis revealed that a lower expression of the selected lncRNAs was significantly associated with worse relapse-free survival (RFS) in breast cancer patients. Further validation of the expression of these DELncRNAs might be helpful to better tailor breast cancer prognosis and treatment.

Keywords: biomarkers; breast cancer; docetaxel; lncRNAs; prognosis.


Conflict of interest statement

The authors declare that they have no competing interests.

Figures

Figure 1
Figure 1
Study workflow. lncRNAs were selected among the DEGs of previous work by our group (GSE81064) using Fold change 2.0 (FC 2.0). The up- and down-regulated lncRNAs were initially screened for differences in expression, impact on prognosis, and response to taxane treatment, using the free online tools UALCAN, KMplotter, and ROC plotter, respectively. Then, the TCGA RNA expression data of the selected lncRNAs were downloaded from the cBioPortal and analyzed for the clinicopathological association.
Figure 2
Figure 2
MIAT lncRNA expression in breast cancer patients and association with taxane treatment response and prognosis Expression of MIAT lncRNA in breast cancer compared to normal breast tissue (a) and among different breast intrinsic subtypes using the UALCAN database containing TCGA data (b). (c) MIAT lncRNA expression in groups of responder and non-responder breast cancer patients treated with taxane using the online platform ROCplot. (dh) Kaplan–Meier curves for relapse-free survival of breast cancer patients for all subtypes (d) or for each intrinsic subtype as luminal A (e), luminal B (f), HER2 (g), and basal (h) grouped as high or low expression of MIAT according to the best cut-off value using the JetSet best probe set at the KMplotter online tool. *** p < 0.001; MW—Mann–Whitney test.
Figure 3
Figure 3
KCNQ1OT1 lncRNA expression in breast cancer patients and association with taxane treatment response and prognosis. Expression of KCNQ1OT1 lncRNA in breast cancer compared to normal breast tissue (a) and among different breast intrinsic subtypes using the UALCAN database containing TCGA data (b). (c) KCNQ1OT1 lncRNA expression in groups of responder and non-responder breast cancer patients treated with taxane using the online platform ROCplot. (dh) Kaplan–Meier curves for relapse-free survival of breast cancer patients for all subtypes (d) or for each intrinsic subtype as luminal A (e), luminal B (f), HER2 (g), and basal (h) grouped as high or low expression of KCNQ1OT1 according to the best cut-off value using the JetSet best probe set at the KMplotter online tool. * p < 0.05,; MW—Mann–Whitney test.
Figure 4
Figure 4
LOC100270804 lncRNA expression in breast cancer patients and association with taxane treatment response and prognosis. Expression of LOC100270804 lncRNA in breast cancer comparing to normal breast tissue (a) and among different breast intrinsic subtypes using the UALCAN database containing TCGA data (b). (c) LOC100270804 lncRNA expression in groups of responder and non-responder breast cancer patients treated with taxane using the online platform ROCplot. (dh) Kaplan–Meier curves for relapse-free survival of breast cancer patients for all subtypes (d) or for each intrinsic subtype as luminal A (e), luminal B (f), HER2 (g) and basal (h) grouped as high or low expression of LOC100270804 according to the best cut-off value using the JetSet best probe set at the KMplotter online tool. ** p < 0.01, *** p < 0.001; MW—Mann–Whitney test.
Figure 5
Figure 5
FLJ10038 lncRNA expression in breast cancer patients and association with taxane treatment response and prognosis. Expression of FLJ10038 lncRNA in breast cancer compared to normal breast tissue (a) and among different breast intrinsic subtypes using the UALCAN database containing TCGA data (b). (c) FLJ10038 lncRNA expression in groups of responders and non-responder breast cancer patients treated with taxane using the online platform ROCplot. (dh) Kaplan–Meier curves for relapse-free survival of breast cancer patients for all subtypes (d) or each intrinsic subtype as luminal A (e), luminal B (f), HER2 (g), and basal (h) grouped as high or low expression of FLJ10038 according to the best cut-off value using the JetSet best probe set at the KMplot online tool. *** p < 0.001,; MW—Mann–Whitney test.
Figure 6
Figure 6
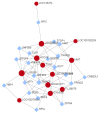
Networks of TF-lncRNAs interaction created by the NetworkAnalyst website. The lncRNA are represented as red circles, and coding mRNAs, as blue diamonds.) The nodes represent functions and edges are determined by the overlap ratio between genes associated with the two functions.

References

    1. Siegel R.L., Miller K.D., Fuchs H.E., Jemal A. Cancer Statistics, 2021. CA Cancer J. Clin. 2021;71:7–33. doi: 10.3322/caac.21654. - DOI - PubMed
    1. Allemani C., Matsuda T., Di Carlo V., Harewood R., Matz M., Nikšić M., Bonaventure A., Valkov M., Johnson C.J., Estève J., et al. Global surveillance of trends in cancer survival 2000-14 (CONCORD-3): Analysis of individual records for 37 513 025 patients diagnosed with one of 18 cancers from 322 population-based registries in 71 countries. Lancet. 2018;391:1023–1075. doi: 10.1016/S0140-6736(17)33326-3. - DOI - PMC - PubMed
    1. Perou C.M., Sørlie T., Eisen M.B., Van De Rijn M., Jeffrey S.S., Rees C.A., Pollack J.R., Ross D.T., Johnsen H., Akslen L.A., et al. Molecular portraits of human breast tumours. Nature. 2000;406:747–752. doi: 10.1038/35021093. - DOI - PubMed
    1. Sørlie T., Perou C.M., Tibshirani R., Aas T., Geisler S., Johnsen H., Hastie T., Eisen M.B., van de Rijn M., Jeffrey S.S., et al. Gene expression patterns of breast carcinomas distinguish tumor subclasses with clinical implications. Proc. Natl. Acad. Sci. USA. 2001;98:10869–10874. doi: 10.1073/pnas.191367098. - DOI - PMC - PubMed
    1. Cech T.R., Steitz J.A. The Noncoding RNA Revolution—Trashing Old Rules to Forge New Ones. Cell. 2014;157:77–94. doi: 10.1016/j.cell.2014.03.008. - DOI - PubMed

Publication types