. 2021 Jun 29;12(7):995.
doi: 10.3390/genes12070995.

Effects of the Developmental Regulator BOLITA on the Plant Metabolome

Affiliations

Effects of the Developmental Regulator BOLITA on the Plant Metabolome

Hugo Gerardo Lazcano-Ramírez et al. Genes (Basel). .

Abstract

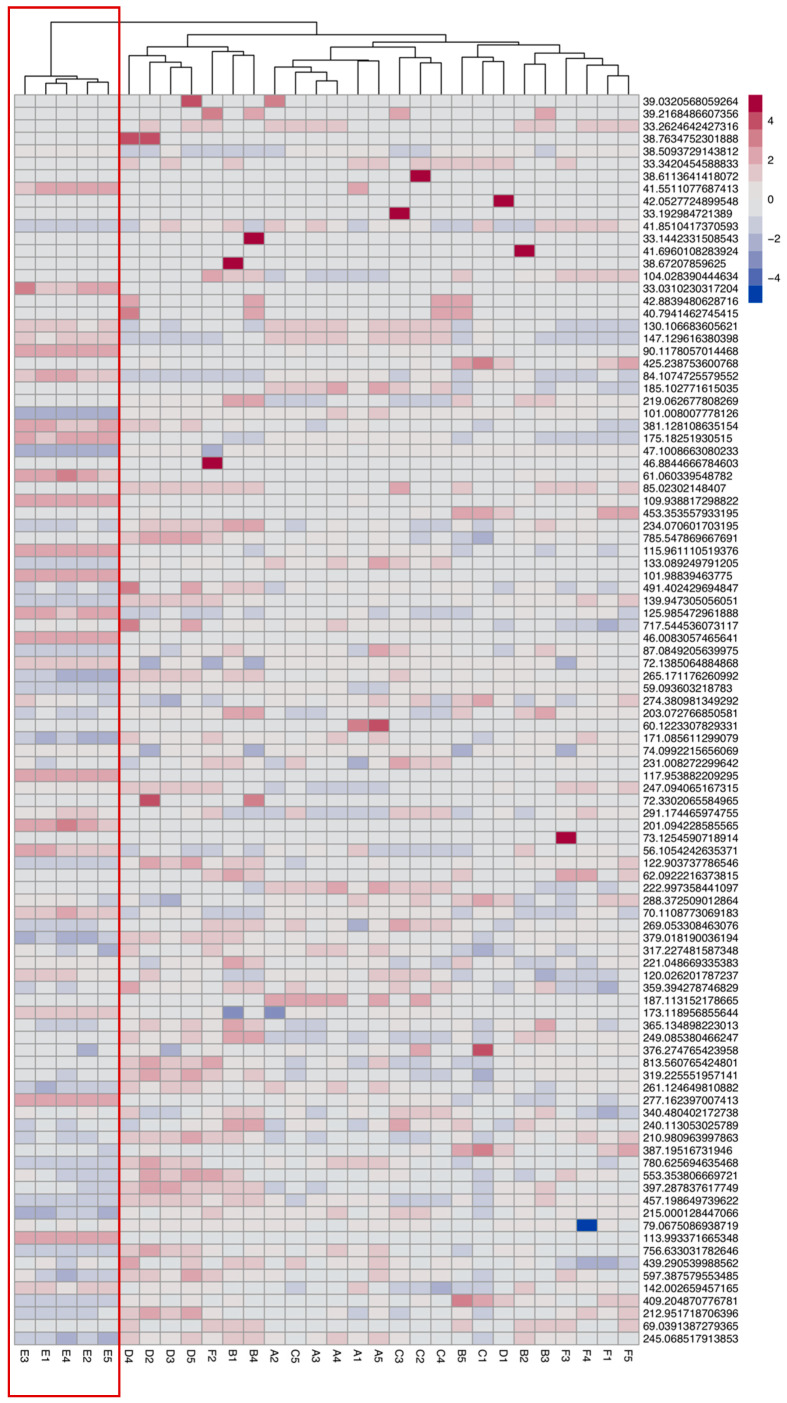
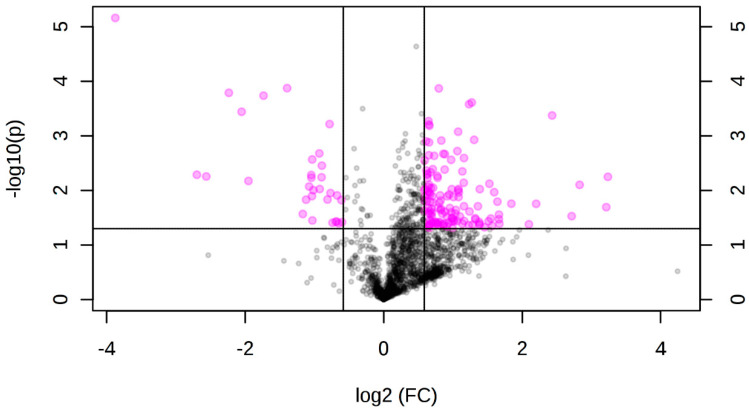
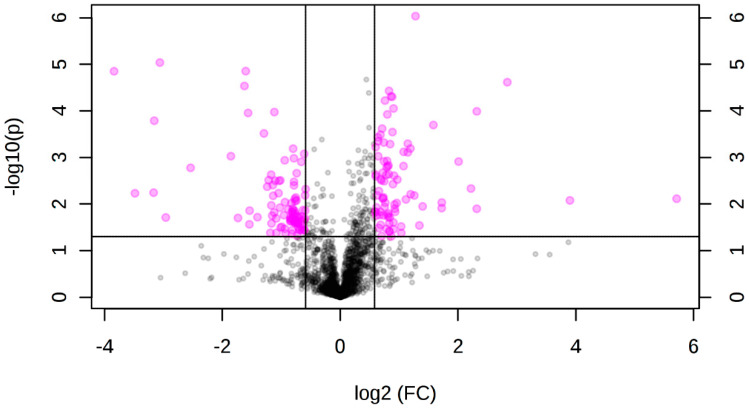
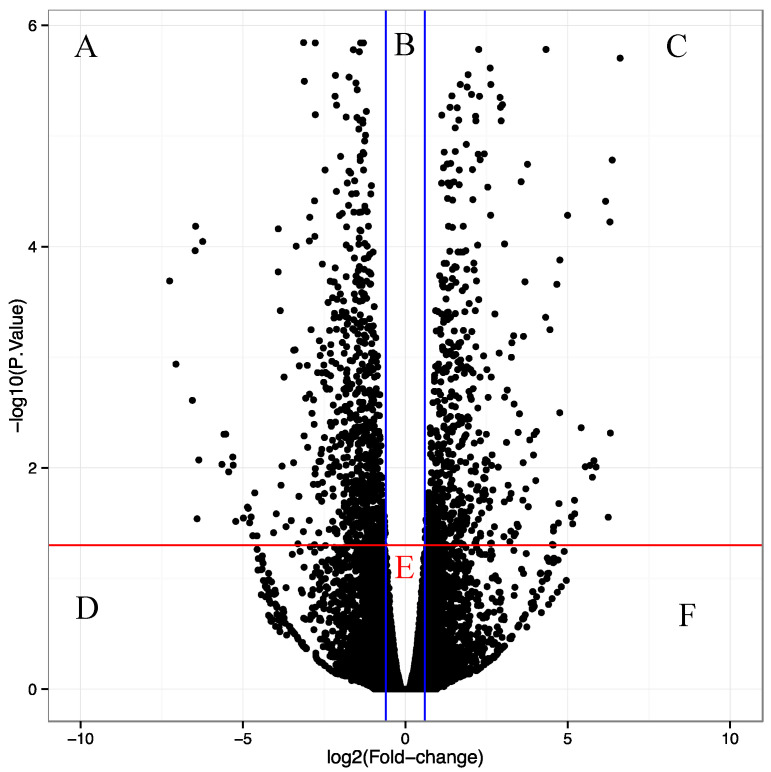
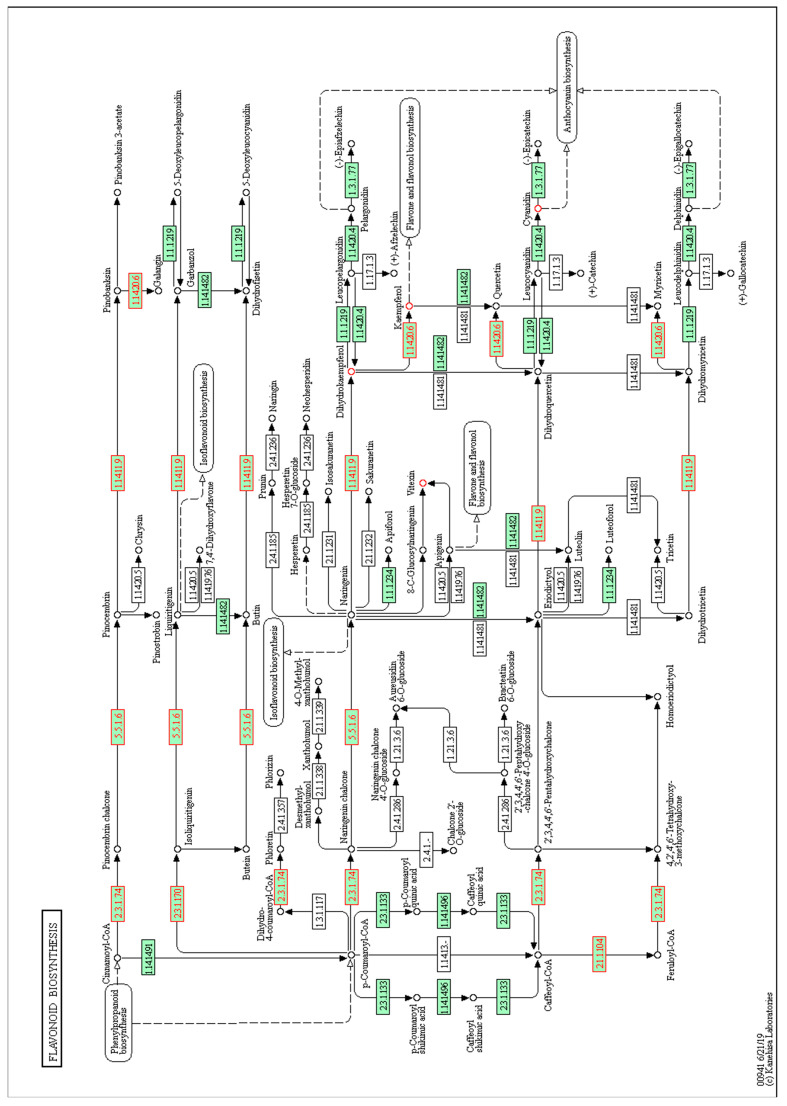
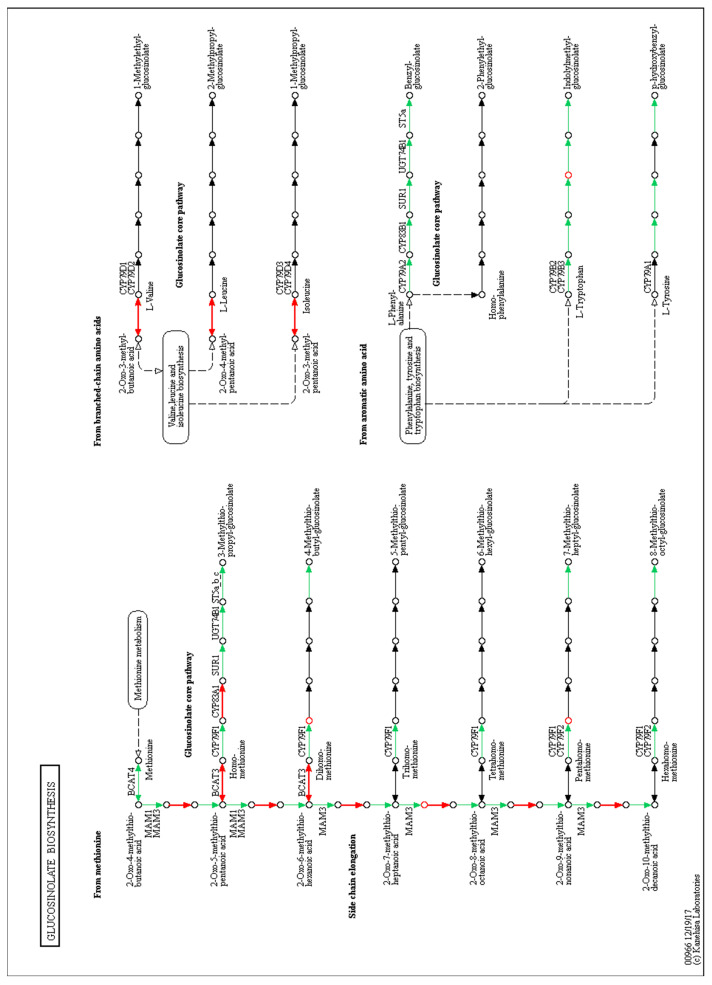
Transcription factors are important regulators of gene expression. They can orchestrate the activation or repression of hundreds or thousands of genes and control diverse processes in a coordinated way. This work explores the effect of a master regulator of plant development, BOLITA (BOL), in plant metabolism, with a special focus on specialized metabolism. For this, we used an Arabidopsis thaliana line in which the transcription factor activity can be induced. Fingerprinting metabolomic analyses of whole plantlets were performed at different times after induction. After 96 h, all induced replicas clustered as a single group, in contrast with all controls which did not cluster. Metabolomic analyses of shoot and root tissues enabled the putative identification of differentially accumulated metabolites in each tissue. Finally, the analysis of global gene expression in induced vs. non-induced root samples, together with enrichment analyses, allowed the identification of enriched metabolic pathways among the differentially expressed genes and accumulated metabolites after the induction. We concluded that the induction of BOL activity can modify the Arabidopsis metabolome. Future work should investigate whether its action is direct or indirect, and the implications of the metabolic changes for development regulation and bioprospection.

Keywords: developmental regulation; global expression analysis; glucosinolates; metabolic fingerprinting; phenylpropanoid pathway; transcription factor.


Conflict of interest statement

The authors declare no conflict of interest.

Figures

Figure 1
Figure 1
Heat map of the metabolic fingerprint generated with the 100 most abundant DLI-ESI MS ions of the samples analyzed 96 h after the induction of the transcription factor. At the top, a hierarchical grouping dendrogram made using Euclidean agglomeration and distances established by Ward’s method. The red box indicates the grouping of samples with probability >95%. The letters correspond to the following samples: A: p35S:ESR2-ER+No treatment; B: Col-0+No treatment; C: p35S:ESR2-ER+Ethanol; D: Col-0+Ethanol; E: p35S:ESR2-ER+ Ethanol+β-ESTRADIOL; F: Col-0+Ethanol+β-ESTRADIOL. The numbers correspond to the sample number (replicas). Color intensity represents relative accumulation. The greater the red hue, the greater the relative accumulation; the greater the blue hue, the less relative accumulation.
Figure 2
Figure 2
Volcano plot showing the differential accumulation of ions in induced vs. non-induced root tissue samples. The X-axis shows the base 2 logarithms of the proportion of change in accumulation or “fold change,” and the Y-axis shows the negative value of the log10 of the “p” value; the lines parallel to the Y-axis represent a value of “fold change” = 1.5. The line parallel to the X-axis represents a value of “p” = 0.05. The pink color shows the 165 differentially accumulated ions (p ≤ 0.05 and “fold change” ≥ 1.5) in root tissue. The black color indicates the ions that did not show differential accumulation.
Figure 3
Figure 3
Volcano plot showing the differential accumulation of ions in induced vs. non-induced aerial tissue samples. The X-axis shows the base 2 logarithms of the “fold change,” and the Y-axis shows the negative value of the base 10 logarithms of “p.” The lines parallel to the Y-axis represent a log2 “fold change” = 1.5. The line parallel to the X-axis represents a value of “p” = 0.05. The pink color shows the 184 ions that differentially accumulated (p ≤ 0.05 and “fold change” ≥ 1.5) in aerial tissue. The black color indicates the ions that did not show differential accumulation.
Figure 4
Figure 4
Volcano plot showing 14,708 genes obtained in the transcriptomes, mapped within the A. thaliana genome. The base 2 logarithms of the fold change are shown on the X-axis. The negative value of the base 10 logarithms of the “p” value is shown on the Y-axis. Thus, the blue lines parallel to the Y-axis represent a “fold change” value = 1.5, and the red line parallel to the X-axis represents a “p” value = 0.05. The A and C sections are the only ones that include the differentially expressed genes (p ≤ 0.05 and “fold change” ≥ 1.5).
Figure 5
Figure 5
Map of the KEGG phenylpropanoid biosynthetic pathway depicting the differentially expressed genes and differentially accumulated metabolites after BOL induction. Arrows represent enzymatic steps. Genes belonging to the reference pathway are shown in green squares, and the differentially expressed genes mapped within the pathway are marked with red numbers and borders. The circles represent metabolites, and red circles mark the differentially accumulated metabolites.
Figure 6
Figure 6
Map of the KEGG glucosinolate biosynthesis pathway depicting the differentially expressed genes and differentially accumulated metabolites after BOL induction. Arrows represent enzymatic reactions, and the names of the corresponding enzymes are indicated above them. Red arrows indicate enzymes coded by differentially expressed genes upon BOL induction. The circles represent metabolites, and red circles mark the differentially accumulated metabolites.

References

    1. Prunet N., Meyerowitz E.M. Genetics and plant development. Comptes Rendus Biol. 2016;339:240–246. doi: 10.1016/j.crvi.2016.05.003. - DOI - PubMed
    1. Gillis J., Pavlidis P. The role of indirect connections in gene networks in predicting function. Bioinformatics. 2011;27:1860–1866. doi: 10.1093/bioinformatics/btr288. - DOI - PMC - PubMed
    1. Roll-Hansen N. The Genotype Theory of Wilhelm Johannsen and its Relation to Plant Breeding and the Study of Evolution. Centaurus. 1979;22:201–235. doi: 10.1111/j.1600-0498.1979.tb00589.x. - DOI
    1. Ratcliffe R.G., Shachar-Hill Y. Revealing metabolic phenotypes in plants: Inputs from NMR analysis. Biol. Rev. 1999;80:27–43. doi: 10.1017/S1464793104006530. - DOI - PubMed
    1. Jacobowitz J.R., Weng J.-K. Exploring Uncharted Territories of Plant Specialized Metabolism in the Postgenomic Era. Annu. Rev. Plant Biol. 2020;71:631–658. doi: 10.1146/annurev-arplant-081519-035634. - DOI - PubMed

Publication types

MeSH terms

Substances

LinkOut - more resources