. 2021 Jun 29;13(7):1272.
doi: 10.3390/v13071272.

Epstein-Barr Virus DNA Exacerbates Colitis Symptoms in a Mouse Model of Inflammatory Bowel Disease

Affiliations

Epstein-Barr Virus DNA Exacerbates Colitis Symptoms in a Mouse Model of Inflammatory Bowel Disease

Sirine Andari et al. Viruses. .

Abstract

Infection with EBV has been associated with various inflammatory disorders including inflammatory bowel diseases (IBD). Contribution of this virus to intestinal disease processes has not been assessed. We previously detected that EBV DNA triggers proinflammatory responses via the activation of endosomal Toll-like receptor (TLR) signaling. Hence, to examine the colitogenic potential of EBV DNA, we used the dextran sodium sulfate (DSS) mouse colitis model. C57BL/6J mice received either DSS-containing or regular drinking water. Mice were then administered EBV DNA by rectal gavage. Administration of EBV DNA to the DSS-fed mice aggravated colonic disease activity as well as increased the damage to the colon histologic architecture. Moreover, we observed enhanced expression of IL-17A, IFNγ and TNFα in colon tissues from the colitis mice (DSS-treated) given the EBV DNA compared to the other groups. This group also had a marked decrease in expression of the CTLA4 immunoregulatory marker. On the other hand, we observed enhanced expression of endosomal TLRs in colon tissues from the EBV DNA-treated colitis mice. These findings indicate that EBV DNA exacerbates proinflammatory responses in colitis. The ubiquity of EBV in the population indicates that possible similar responses may be of pertinence in a relevant proportion of IBD patients.

Keywords: Epstein–Barr virus; IL-17A; Toll-like Receptors; inflammatory bowel disease.


Conflict of interest statement

The authors declare no conflict of interest.

Figures

Figure 1
Figure 1
Experimental design used to assess the effect of Epstein–Barr virus (EBV) DNA on colitis severity in C57BL/6J mice. C57BL/6J mice (n = 9–14 per group) received either 1.5% dextran sodium sulfate (DSS)-containing or regular drinking water for 7 days. The three DSS-treated groups were then rectally administered sterile water, Epstein–Barr virus DNA in sterile water or S. epidermidis DNA in sterile water on day 3. The other normal drinking water-fed groups were included as controls and also received sterile water, EBV DNA or S. epidermidis DNA by rectal gavage on day 3.
Figure 2
Figure 2
Average percent body weight change in control and experimental mouse groups used to assess the effect of Epstein–Barr virus (EBV) DNA on colitis severity in C57BL/6J mice. C57BL/6J mice (n = 9–14 per group) received either 1.5% dextran sodium sulfate (DSS)-containing or regular drinking water for 7 days. Three DSS-treated groups were then rectally administered sterile water, Epstein–Barr virus DNA in sterile water or S. epidermidis DNA in sterile water on day 3. The other normal drinking water-fed groups were included as controls and also received sterile water, EBV DNA or S. epidermidis DNA by rectal gavage on day 3. Mouse body weight was evaluated daily, and the percent body weight change was calculated per mouse per group compared to its initial weight on day 0. Average weight per group per time point and standard deviations are indicated. * p < 0.05, *** p < 0.001, compared to the control group on the respective day of measurement.
Figure 3
Figure 3
Average colon lengths in control and experimental mouse groups used to assess the effect of Epstein–Barr virus (EBV) DNA on colitis severity in C57BL/6J mice. C57BL/6J mice (n = 9–14 per group) received either 1.5% dextran sodium sulfate (DSS)-containing or regular drinking water for 7 days. Three DSS-treated groups were then rectally administered sterile water, Epstein–Barr virus DNA in sterile water or S. epidermidis DNA in sterile water on day 3. The other normal drinking water-fed groups were included as controls and also received sterile water, EBV DNA or S. epidermidis DNA by rectal gavage on day 3. On day 7 of the experimental protocol, mice were sacrificed and their colon lengths were measured. Average colon lengths per group and standard deviations are indicated. *** p < 0.001, compared to the control group; ** p < 0.01 compared to the control group; +++ p < 0.001, compared to the DSS group.
Figure 4
Figure 4
Disease activity index (DAI) scores in control and experimental mouse groups used to assess the effect of Epstein–Barr virus (EBV) DNA on colitis severity in C57BL/6J mice. C57BL/6J mice (n = 9–14 per group) received either 1.5% dextran sodium sulfate (DSS)-containing or regular drinking water for 7 days. Three DSS-treated groups were then rectally administered sterile water, Epstein–Barr virus DNA in sterile water or S. epidermidis DNA in sterile water on day 3. The other normal drinking water-fed groups were included as controls and also received sterile water, EBV DNA or S. epidermidis DNA by rectal gavage on day 3. The DAI was determined daily as a composite measure of the scores of body weight loss, stool consistency and fecal blood. Individual mouse and average DAIs per group are indicated. *** p < 0.05, ** p < 0.01, *** p < 0.001, compared to the control group on the same day; ++ p < 0.01, compared to the DSS group on the same day.
Figure 5
Figure 5
Histological damage in control and experimental mouse groups used to assess the effect of Epstein–Barr virus (EBV) DNA on colitis severity in C57BL/6J mice. C57BL/6J mice (n = 9–14 per group) received either 1.5% dextran sodium sulfate (DSS)-containing or regular drinking water for 7 days. Three DSS-treated groups were then rectally administered sterile water, Epstein–Barr virus DNA in sterile water or S. epidermidis DNA in sterile water on day 3. The other normal drinking water-fed groups were included as controls and also received sterile water, EBV DNA or S. epidermidis DNA by rectal gavage on day 3. On day 7 of the experimental protocol, mice were sacrificed, and their colons were collected. (A) Hematoxylin and eosin-stained distal sections of mouse colons. Arrow indicates an abscess. (B) Mouse group histology scores. Individual mouse scores and average group scores are indicated. *** p < 0.001, compared to the control group; + p < 0.05, compared to the DSS group.
Figure 6
Figure 6
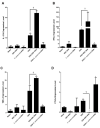
Expression levels of (A) IL-17A, (B) IFNγ, (C) TNFα and (D) CTLA4 in control and experimental mouse groups used to assess the effect of Epstein–Barr virus (EBV) DNA on colitis severity in C57BL/6J mice. C57BL/6J mice (n = 9–14 per group) received either 1.5% dextran sodium sulfate (DSS)-containing or regular drinking water for 7 days. Three DSS-treated groups were then rectally administered sterile water, Epstein–Barr virus DNA in sterile water or S. epidermidis DNA in sterile water on day 3. The other normal drinking water-fed groups were included as controls and also received sterile water, EBV DNA or S. epidermidis DNA by rectal gavage on day 3. On day 7 of the experimental protocol, mice were sacrificed, colons were collected and expression levels were determined in colon sections. Average expression levels per group and standard deviations are indicated. * p < 0.05, compared to the water-treated group; p < 0.05, compared to the DSS-group.
Figure 7
Figure 7
Expression levels of (A) TLR3, (B) TLR7 and (C) TLR9 in control and experimental mouse groups used to assess the effect of Epstein–Barr virus (EBV) DNA on colitis severity in C57BL/6J mice. C57BL/6J mice (n = 9–14 per group) received either 1.5% dextran sodium sulfate (DSS)-containing or regular drinking water for 7 days. Three DSS-treated groups were then rectally administered sterile water, Epstein–Barr virus DNA in sterile water or S. epidermidis DNA in sterile water on day 3. The other normal drinking water-fed groups were included as controls and also received sterile water, EBV DNA or S. epidermidis DNA by rectal gavage on day 3. On day 7 of the experimental protocol, mice were sacrificed, colons were collected and expression levels were determined in colon sections. Average expression levels per group and standard deviations are indicated. * p < 0.05, compared to the water-treated group.

References

    1. Kaplan G. The global burden of IBD: From 2015 to 2025. Nat. Rev. Gastroenterol. Hepatol. 2015;12:720–727. doi: 10.1038/nrgastro.2015.150. - DOI - PubMed
    1. Mackie P. The classification of viruses infecting the respiratory tract. Paediatr. Respir. Rev. 2003;4:84–90. doi: 10.1016/S1526-0542(03)00031-9. - DOI - PMC - PubMed
    1. Grinde B. Herpesviruses: Latency and reactivation—Viral strategies and host response. J. Oral Microbiol. 2013;5:5. doi: 10.3402/jom.v5i0.22766. - DOI - PMC - PubMed
    1. Thorley-Lawson D.A., Gross A. Persistence of the Epstein–Barr Virus and the Origins of Associated Lymphomas. N. Engl. J. Med. 2004;350:1328–1337. doi: 10.1056/NEJMra032015. - DOI - PubMed
    1. MacLennan I.C. Germinal centers. Annu. Rev. Immunol. 1994;12:117–139. doi: 10.1146/annurev.iy.12.040194.001001. - DOI - PubMed

Publication types

MeSH terms

LinkOut - more resources