Review
. 2021 Jun 29;9(7):756.
doi: 10.3390/biomedicines9070756.

Near-Infrared-Triggered Upconverting Nanoparticles for Biomedicine Applications

Affiliations
Review

Near-Infrared-Triggered Upconverting Nanoparticles for Biomedicine Applications

Manoj Kumar Mahata et al. Biomedicines. .

Abstract

Due to the unique properties of lanthanide-doped upconverting nanoparticles (UCNP) under near-infrared (NIR) light, the last decade has shown a sharp progress in their biomedicine applications. Advances in the techniques for polymer, dye, and bio-molecule conjugation on the surface of the nanoparticles has further expanded their dynamic opportunities for optogenetics, oncotherapy and bioimaging. In this account, considering the primary benefits such as the absence of photobleaching, photoblinking, and autofluorescence of UCNPs not only facilitate the construction of accurate, sensitive and multifunctional nanoprobes, but also improve therapeutic and diagnostic results. We introduce, with the basic knowledge of upconversion, unique properties of UCNPs and the mechanisms involved in photon upconversion and discuss how UCNPs can be implemented in biological practices. In this focused review, we categorize the applications of UCNP-based various strategies into the following domains: neuromodulation, immunotherapy, drug delivery, photodynamic and photothermal therapy, bioimaging and biosensing. Herein, we also discuss the current emerging bioapplications with cutting edge nano-/biointerfacing of UCNPs. Finally, this review provides concluding remarks on future opportunities and challenges on clinical translation of UCNPs-based nanotechnology research.

Keywords: bioimaging; biomedicine; biosensors; nanoparticles; oncotherapy; optogenetics; upconversion luminescence.


Conflict of interest statement

The authors declare no conflict of interest.

Figures

Figure 5
Figure 5
(a) Schematic presentation of the UCNPs@Au-DOX synthesis, luminescence (UCL)/magnetic resonance (MR) imaging, photothermal therapy (PTT), and chemotherapy. (b) High-accuracy PTT using csUCNP@C. (b1) Schematic illustration of PTT. (b2) Images of HeLa cells with photothermal ablation (b3) PTT of HeLa cells upon 730 nm light excitation for 5 min. csUCNP@C-labeled cells exhibited a strong upconversion signal in the cytoplasm (green). (b4) Amplified image of (b3). (c) PDT/PTT effects on ALTS1C1 cells. (c1) Cytotoxicity of mTHPC, free IR-780, IMNPs, and ANG-IMNPs upon 808 nm or 980 nm laser light. (c2) Cytotoxicity of PTT and PDT; symbols and error bars are mean ± S.D. ** p < 0.01. (c3) Thermal images and (c4) temperature rise profiles upon irradiation. (c5) Laser scanning confocal microscopy images and the corresponding quantitative comparison of in vitro ROS generation in ALTS1C1 cells; singlet oxygen sensor green staining shown in green; blue shows cell nuclei stained with DAPI; scale bar: 20 μm. The 660 nm light generated due to upconversion reaction of the NIR laser inside the cancer cells, increasing fluorescence intensity. Adapted with permission from [85,111,114].
Figure 6
Figure 6
(a) (a1a5) Live mouse anatomy sections prior to injection of UC-α-CD. (a6a10) Anatomy sections after 35 min post-intravenous injection of UC-α-CD. Figure (a1,a6) with a dashed line indicates the mouse position. (a7a10) suggests UC-α-CD localization. (a11) Three-dimensional image collection. (a12) Analyzed area related section. (b) (b1) The setup for a wide-field epi-fluorescence microscopy. The 980 nm CW laser is the excitation source for UCNPs; the 532 nm diode laser is the light source for RFP; the acronyms used in the diagram are as follows:RC—reflective collimator; LC—live-cell chamber; S—sample; F—optical fiber; PS—piezo objective scanner; Obj—objective lens; L—lens; DM—dichroic mirror; T—tube lens; M—mirror. (b2) Scheme for scanning of the objective lens. (c) Early state colocalizations of UCNPs with early endosomes or late endosomes in tau aggregated SH-SY5Y cell. (c1) Control 20 min (955 frame), (c2) forskolin 20 min (739 frame), (c3) okadaic acid 20 min (771 frame), (c4) control 2 h (991 frame), (c5) forskolin 2 h (972 frame), and (c6) okadaic acid 2 h (974 frame). Magenta: UCNPs; green: early endosome; cyan: late endosome. Adapted with permission from [134,141,142].
Figure 1
Figure 1
Schematic representation of basic upconversion processes [23]. (a) excited stte absorption; (b) energy transfer upconversion; (c) photon avalanche; (d) co-operative upconversion; (e) energy migration upconversion.
Figure 2
Figure 2
(a) ANG/PEG-UCNPs: a dual mode targeting system for BBB crossing and targeting the glioblastoma. (b) Glioblastoma-bearing brain images after 1 h of intravenous injection with 5-ALA (excitation, 470 nm; emission, 650 nm) and ANG/PEG-UCNPs, PEG-UCNPs (excitation, 980 nm; emission, 800 nm); scale bar: 100 µm [85].
Figure 3
Figure 3
Design of PDA@UCNP-PEG/Ce6. (A) Scheme for synergistic phototherapy. Upon laser irradiation, the UCNP-based system can ablate the tumor, tumor-associated antigens (TAA) are released and the antitumor immunity is triggered. Finally, it helps the inhibition of tumor metastasis. (B) The UCNP structure: core for PTT and the shell for PDT. (C) TEM images of PDA@UCNP. (D) Temperature variation with irradiation time of PDA@UCNP nanoparticles (2 mg mL−1). (E) Ce6 absorption and PDA@UCNP emission upon 980 nm laser excitation. (F) 1O2 generation comparison upon 1 Wcm−2 laser irradiation. Adapted with permission from [91].
Figure 4
Figure 4
(A) Fe3+ -linked carrier: UCNP (core) and Dox (absorbed in the polymer shell). (B) Anticancer mechanism of the UCNP-based system. ① Passive accumulation of DGU:Fe/Dox with extended circulation and enhanced EPR. ② Change from DGU:Fe/Dox (negative) to GU:Fe/Dox (positive) at tumor site driven by pH activation. ③ Lysosome escape of GU:Fe/Dox through proton sponge. ④ Deconstruction of NIR-responsive system under the action of UCNP. 2464 Apoptosis of released Dox in the cell nucleus. ⑥ Ferroptosis of ROS with tumor cellular H2O2 at the cytoplasm. Adapted with permission from [100].
Figure 7
Figure 7
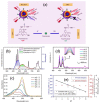
(a) Schematic description of the UCNP surface modification and FRET based on donor UCNPs and acceptor rhodamine. (b) UC emission spectra under 980 nm, (Inset: the variation of relative UC emission intensity at a 540 nm to 651 nm ratio upon different amount of Cys. (c) UV–Vis absorption titration spectra (Inset: the linear response of the absorption peak intensity at 562 nm and Cys concentration) of RHO functionalized UCNPs with a gradual increment of Cys. Reproduced with permission from [144].
Figure 8
Figure 8
(a) Schematic illustration of ATP sensing using a resonance energy transfer between ssDNA-UCNPs. (b) Upconversion spectra of ssDNA-UCNPs in Tris-HCl buffer after (dashed line) and before (solid line) incubation with GO. (c) Upconversion emission of PAA-UCNPs in Tris-HCl buffer after (dashed line) and before (solid line) the addition of GO. (d) Upconversion spectra of UCNPs-GO in the presence of 0–2 mM ATP. (e) Plot of upconversion emission intensity (at 547 nm) vs. ATP concentration. Reproduced with permission from [145].
Figure 9
Figure 9
(a) Upconversion spectrum of DNA-AgNPs/UCNP at various concentrations of H2O2. (b) 450 nm emission enhancement (F/F0) on increasing the amount of H2O2 in DNA-AgNPs/UCNP; F and F0 correspond to the upconversion emission intensity in the presence or absence of H2O2, respectively, in the system. Adapted with permission from [149].
Figure 10
Figure 10
(a) Schematic description of the developed nanoprobe and its working principle. (b) Black line, upconversion emission upon 980 nm; blue line, absorption spectrum of FITC; red line, FITC emission upon 488 nm laser excitation. (c) Absorption spectra of FITC in various pH values. (d) Variation of 808 nm excited upconversion emission spectra of FITC-conjugated core–shell–shell nanoprobes with pH; inset shows the 474 nm band. (e) Variation of 474 nm, 643 nm and their ratio (474 to 643 nm) with pH values ranging from 3 to 8 [157].

References

    1. Chinen A.B., Guan C.M., Ferrer J.R., Barnaby S.N., Merkel T.J., Mirkin C.A. Nanoparticle Probes for the Detection of Cancer Biomarkers, Cells, and Tissues by Fluorescence. Chem. Rev. 2015;115:10530–10574. doi: 10.1021/acs.chemrev.5b00321. - DOI - PMC - PubMed
    1. Wolfbeis O.S. An overview of nanoparticles commonly used in fluorescent bioimaging. Chem. Soc. Rev. 2015;44:4743–4768. doi: 10.1039/C4CS00392F. - DOI - PubMed
    1. Drees C., Raj A.N., Kurre R., Busch K.B., Haase M., Piehler J. Engineered upconversion nanoparticles for resolving protein interactions inside living cells. Angew. Chem. Int. Edit. 2016;55:11668–11672. doi: 10.1002/anie.201603028. - DOI - PubMed
    1. Ong L.C., Ang L.Y., Alonso S., Zhang Y. Bacterial imaging with photostable upconversion fluorescent nanoparticles. Biomaterials. 2014;35:2987–2998. doi: 10.1016/j.biomaterials.2013.12.060. - DOI - PubMed
    1. Schäferling M. Nanoparticle-based luminescent probes for intracellular sensing and imaging of pH. Wiley Interdiscip. Rev. Nanomed. Nanobiotechnol. 2016;8:378–413. doi: 10.1002/wnan.1366. - DOI - PubMed

LinkOut - more resources