. 2021 Jul 1;19(1):135.
doi: 10.1186/s12915-021-01071-8.

Single-cell spatial transcriptomic analysis reveals common and divergent features of developing postnatal granule cerebellar cells and medulloblastoma

Affiliations

Single-cell spatial transcriptomic analysis reveals common and divergent features of developing postnatal granule cerebellar cells and medulloblastoma

Wenqin Luo et al. BMC Biol. .

Abstract

Background: Cerebellar neurogenesis involves the generation of large numbers of cerebellar granule neurons (GNs) throughout development of the cerebellum, a process that involves tight regulation of proliferation and differentiation of granule neuron progenitors (GNPs). A number of transcriptional regulators, including Math1, and the signaling molecules Wnt and Shh have been shown to have important roles in GNP proliferation and differentiation, and deregulation of granule cell development has been reported to be associated with the pathogenesis of medulloblastoma. While the progenitor/differentiation states of cerebellar granule cells have been broadly investigated, a more detailed association between developmental differentiation programs and spatial gene expression patterns, and how these lead to differential generation of distinct types of medulloblastoma remains poorly understood. Here, we provide a comparative single-cell spatial transcriptomics analysis to better understand the similarities and differences between developing granule and medulloblastoma cells.

Results: To acquire an enhanced understanding of the precise cellular states of developing cerebellar granule cells, we performed single-cell RNA sequencing of 24,919 murine cerebellar cells from granule neuron-specific reporter mice (Math1-GFP; Dcx-DsRed mice). Our single-cell analysis revealed that there are four major states of developing cerebellar granule cells, including two subsets of granule progenitors and two subsets of differentiating/differentiated granule neurons. Further spatial transcriptomics technology enabled visualization of their spatial locations in cerebellum. In addition, we performed single-cell RNA sequencing of 18,372 cells from Patched+/- mutant mice and found that the transformed granule cells in medulloblastoma closely resembled developing granule neurons of varying differentiation states. However, transformed granule neuron progenitors in medulloblastoma exhibit noticeably less tendency to differentiate compared with cells in normal development.

Conclusion: In sum, our study revealed the cellular and spatial organization of the detailed states of cerebellar granule cells and provided direct evidence for the similarities and discrepancies between normal cerebellar development and tumorigenesis.

Keywords: Cerebellum; Development of granule cells; Differentiated granule neurons; Granule neuron progenitors; SHH medulloblastoma; Single-cell RNA sequencing; Spatial transcriptomics.


Conflict of interest statement

All authors read and approved the final manuscript. The authors declare that they have no conflict of interest.

Figures

Fig. 1
Fig. 1
Single-cell transcriptome profiling of postnatal cerebellar cells. a Workflow (top panel) for cerebellum collection by FACS-sorted, single-cell sequencing, and analysis of two samples [one at postnatal days 7 (P7) and the other at P11] from Math1-GFP mice and two samples [one at P7 and the other at P11] from Dcx-DsRed mice. Workflow (bottom panel) for cerebellum section, spatial transcriptomes, and analysis of two samples from WT mice (both at P7). b Strains were established from transgenic Math1-GFP and transgenic Dcx-DsRed mice. Scale bar: 100 μm. c t-SNE visualization of 24,919 cells from FACS-sorted samples (n = 4; Math1-GFP mice at P7 and P11; Dcx-DsRed mice at P7 and P11). Cells are colored according to clusters with annotation of cell types. d Dot plot for the expression of marker genes in each cell type. Color represents the mean expression in each cell cluster, and size indicates the fraction of cells expressing marker genes. e t-SNE visualization of 24,919 cells from FACS-sorted samples: Math1-GFP+ and Dcx-DsRed+ samples. f Bar plot showing the proportion of cell types in Math1-GFP+ and Dcx-DsRed+ samples. P < 0.0001. P values were determined using Pearson’s chi-square test
Fig. 2
Fig. 2
Identifying distinct states associated with postnatal GN development. a t-SNE visualization of 21,397 granule neuron cells (GNs) from FACS-sorted samples after re-clustering. n = 4 mice. They are Math1-GFP mice at P7 and P11, as well as Dcx-DsRed mice at P7 and P11. Cells are colored according to clusters. b t-SNE visualization of FACS-sorted sample sources including Math1-GFP+ and Dcx-DsRed+ samples. c Signature gene expression of GNPs (Math1) and differentiating/differentiated GNs (Dcx). d t-SNE visualization of cell cycle and differentiation (Rbfox3, Grin2b, and Neurod1) gene scores. e Scores of GNs (X-axis) for seven modules (Y-axis) derived from Monocle 3 module analysis. Four highly correlated modules are highlighted (modules A, B, C, and D). Cells and modules are hierarchically clustered. Scores of cell cycle genes, and expression of Math1 and Dcx are ordered as on the top. f Four cell states are defined corresponding to the four main modules in e. g Scores of the four main module genes are shown. h Heatmap depicting gene expression levels of markers in the four GN states, with color-coding for the corresponding FACS-sorted sample, clusters, cell types, and cell cycle scores. i Signature gene expression of GNPs (Math1, Srebf1, and Tead2), GNs I (Nhlh1, Ebf3, and Sox4), and GNs II (Grin2b, Cntn1, and Car10). In situ hybridization (ISH) data were obtained from the Allen Developing Mouse Brain Atlas (© 2008 Allen Institute for Brain Science. Allen Developing Mouse Brain Atlas http://developingmouse.brain-map.org). Scale bar: 100 μm. Mouse cerebellum at P4 are shown
Fig. 3
Fig. 3
TF regulatory networks underlying cell states of GNs. a Network showing the correlation of regulons in four GN states. Nodes are colored according to cell types. The edge width corresponds to the values of correlation between regulons. b t-SNE visualization on the binary regulon activity matrix. Cells are colored according to four cell states. t-SNE visualization of regulon activities in four GN states. c Expression of Zeb1, Hey1, Neurod1, and En1 in the mouse cerebellum. In situ hybridization (ISH) data were obtained from the Allen Developing Mouse Brain Atlas (© 2008 Allen Institute for Brain Science. Allen Developing Mouse Brain Atlas http://developingmouse.brain-map.org). Scale bar: 100 μm. Mouse cerebellum at P4 are shown
Fig. 4
Fig. 4
Identifying cell populations in the cerebellum with ST. a Dimensionality reduction and clustering of 473 spots from cerebellum section from WT mice at P7. n = 2 mice. They are sample I and sample II. Each cluster’s annotated anatomical region of sample I is indicated in c. Spots are colored according to clusters. b Dot plot for the expression of representative marker genes in cerebellar cell types corresponding to the anatomical region. Color represents the mean expression in each cluster, and size indicates the fraction of cells expressing the marker genes. c–d Mapping spots to their spatial positions shows that spots defined by marker genes are localized to the expected layers of cerebellum in sample I. Magnified images of the histological structures are shown in F1–F4. Scale bar: 25 μm. e–f Intersection analysis of all scRNA-seq-identified cell types and spatial transcriptomics-defined regions. Each value of the heatmap is computed as described in f. All pairs of cell types and cerebellum region using the same background genes (16,293 genes). The numbers of cell-type-specific and spatial region-specific genes used in the calculation are shown in f. Red indicates enrichment (significantly high overlap; P value < 0.05) and blue indicates depletion (P value > 0.05). The bar on the top indicates the regions defined in a
Fig. 5
Fig. 5
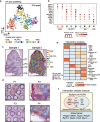
Identification and mapping of GN cell-type subpopulations across cerebellar regions. a t-SNE visualization of spots identified as EGL, ML/PCL, and IGL in Fig. 4a. b Scores of genes specifically associated with four GN states in ST spots. c Spatial locations of anatomical regions associated with the development of GNs: EGL, ML/PCL, and IGL. Spots are colored according to the layers. d Model at P7 for the cellular architecture of GNs in different development phases: a. GNPs in EGL, b. migrating GNs in the inner of EGL and ML/PCL, and d. mature GNs in IGL. c. Purkinje cells are shown in ML/PCL. e Violin plot for scores of selected genes corresponding to four cell states in three layers’ location. Color represents four cell states. *P < 0.05; **P < 0.01; ***P < 0.001; ****P < 0.0001. P values were determined using two-sided unpaired Wilcoxon test. f Correlation between four states of GNs and three layers’ location. g Signature gene expression of GNPs (Math1 and Mki67), GNs I (Mvd), and GNs II (Cntn1) in the ST H&E image
Fig. 6
Fig. 6
Developmental trajectories within GN lineage cells. a RNA velocities of GNs for Math1-GFP+ mouse at P7. b UMAP visualization of the transition probability of particular cells corresponding to four GN states. c The velocity-inferred root/end cells, velocity pseudotime, and cell cycle scores of P7 Math1-GFP+ mouse are shown. d Gene expression dynamics resolved along velocity pseudotime show a clear cascade of transcription of top likelihood-ranked TFs (likelihood > 0). e Driver genes are identified by high likelihoods. Expression dynamics along velocity pseudotime for the driver genes characterize their activity
Fig. 7
Fig. 7
Relationship between tumor cell identity and developmental GN cell origins. a Workflow for the collection of MB developed after 50 weeks in Patched+/− mice, single-cell sequencing, and clustering analysis. n = 3 Patched+/− mice. They are MB-1, MB-2, and MB-3. t-SNE visualization of nine clusters in 18,372 cells from three MB tumors. Cells are colored according to clusters with annotation of cell types. b Heatmap showing inferred large-scale CNVs of normal cells (GNPs/GNs at P7 WT mouse) and tumor cells of three samples. c Heatmap of mean similarity scores between MB and developmental neural lineage cells of cerebellum. d t-SNE visualization of four GN cell state scores in three MB tumors. e Relative expression of 150 genes representing SHH-MB meta-programs from combined tumor cells. Cells positive for the cell cycle program are indicated. f Jaccard similarities of the gene sets between meta-programs of tumor cells (y axis) and four cell states of granule neuron cells (x axis)
Fig. 8
Fig. 8
Delineating intra-tumoral cellular trajectories. a RNA velocities of four GN cell states like in tumor cells. b Heatmap showing the transition proportion from dividing GNPs and dividing GNP-like to four cell states. P < 0.0001. P values were determined using Pearson’s chi-square test. c Univariate analysis of overall survival (OS) in SHH-MB patients using GSVA scores of four tumor cell states. P values were determined using the log-rank test. d Heatmap of differential expressed gene analysis in dividing phase between normal and tumor models. Bar represents the average expression in each sample. e GO analysis of differential expressed gene in dividing phase between normal and tumor models

Similar articles

Cited by

References

    1. Ben-Arie N, Bellen H, Armstrong D, McCall A, Gordadze P, Guo QX, Matzuk M, Zoghbi HY. Math1 is essential for genesis of cerebellar granule neurons. Nature. 1997;390(6656):169–172. doi: 10.1038/36579. - DOI - PubMed
    1. Hatten ME, Heintz N. Mechanisms of neural patterning and specification in the developing cerebellum. Annu Rev Neurosci. 1995;18(1):385–408. doi: 10.1146/annurev.ne.18.030195.002125. - DOI - PubMed
    1. Wechsler-Reya RJ, Scott MP. Control of neuronal precursor proliferation in the cerebellum by Sonic Hedgehog. Neuron. 1999;22(1):103–114. doi: 10.1016/S0896-6273(00)80682-0. - DOI - PubMed
    1. Hashimoto M, Hibi M. Development and evolution of cerebellar neural circuits. Dev Growth Differ. 2012;54(3):373–389. doi: 10.1111/j.1440-169X.2012.01348.x. - DOI - PubMed
    1. Yacubova E, Komuro H. Cellular and molecular mechanisms of cerebellar granule cell migration. Cell Biochem Biophys. 2003;37(3):213–234. doi: 10.1385/CBB:37:3:213. - DOI - PubMed

Publication types

Substances