. 2021 Jul 2:149:e156.
doi: 10.1017/S0950268821001527.

Estimation of delay-adjusted all-cause excess mortality in the USA: March-December 2020

Affiliations

Estimation of delay-adjusted all-cause excess mortality in the USA: March-December 2020

Andrei R Akhmetzhanov. Epidemiol Infect. .

Abstract

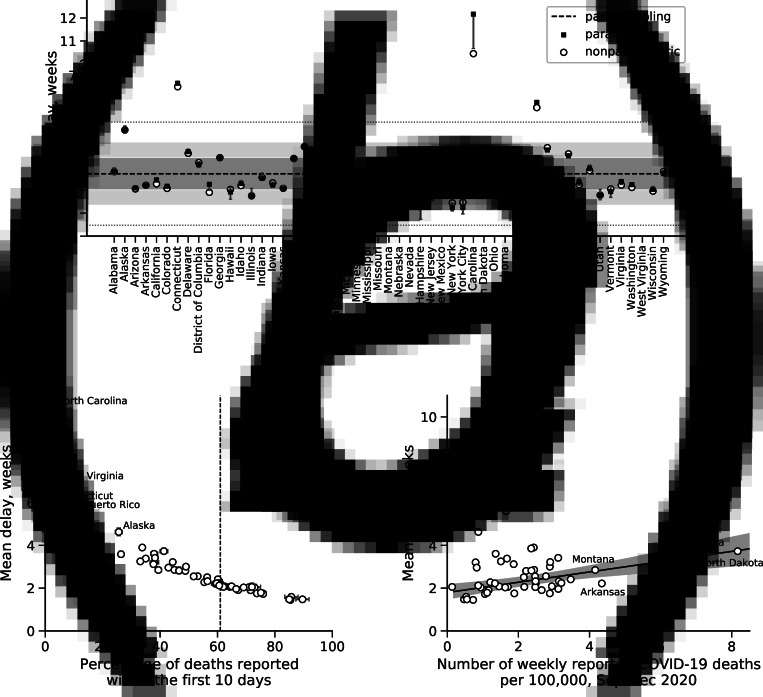
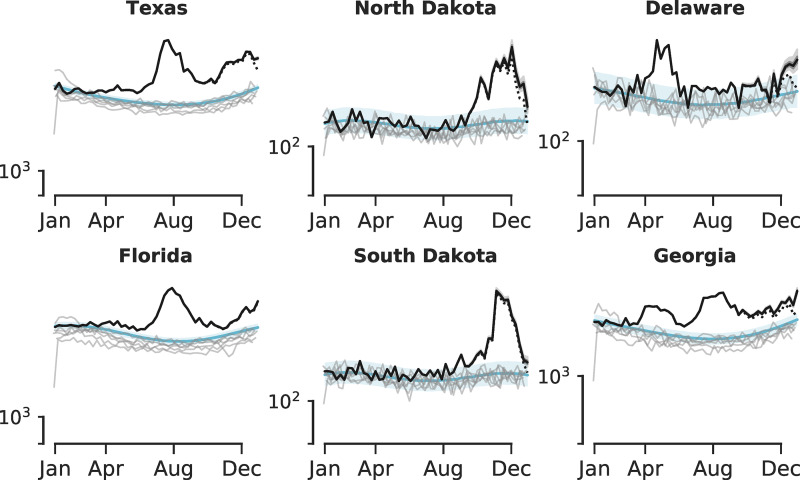
We estimate the delay-adjusted all-cause excess deaths across 53 US jurisdictions. Using provisional data collected from September through December 2020, we first identify a common mean reporting delay of 2.8 weeks, whereas four jurisdictions have prolonged reporting delays compared to the others: Connecticut (mean 5.8 weeks), North Carolina (mean 10.4 weeks), Puerto Rico (mean 4.7 weeks) and West Virginia (mean 5.5 weeks). After adjusting for reporting delays, we estimate the percent change in all-cause excess mortality from March to December 2020 with range from 0.2 to 3.6 in Hawaii to 58.4 to 62.4 in New York City. Comparing the March-December with September-December 2020 periods, the highest increases in excess mortality are observed in South Dakota (36.9-54.0), North Dakota (33.9-50.7) and Missouri (27.8-33.9). Our findings indicate that analysis of provisional data requires caution in interpreting the death counts in recent weeks, while one needs also to account for heterogeneity in reporting delays of excess deaths among US jurisdictions.

Keywords: COVID-19; excess mortality; pandemic; reporting delay.


Conflict of interest statement

The author declares that he has no known competing financial or personal relationships that could have appeared to influence the work reported in this paper.

Figures

Fig. 1.
Fig. 1.
(a) Mean reporting delay by jurisdiction using different estimation approaches (legend). Error bars indicate the 95% CI for individually estimated reporting delays using a parametric model. Dashed line indicates a common mean delay inferred from the partial pool model. The entire shaded area indicates the 95% CI for the common mean delay, whereas the dark shaded area covers the interquartile range of the posterior. (b) Relationship between the fraction of deaths reported within the first 10 days and the mean reporting delay by jurisdiction obtained from non-parametric estimation of the reporting delay distribution. Dashed line indicates an estimate of 61% cited in technical notes of CDC [5]. (c) Correlation between number of reported COVID-19 deaths per 100 000 from September to December 2020 and the mean reporting delay by jurisdiction. Solid line is obtained from a linear regression model. Shaded area indicates 95% CI.
Fig. 2.
Fig. 2.
Comparing the nowcasted all-cause excess deaths by week of 2020 with expected deaths. Black line and grey shaded area show the median and 95% CI of the nowcasted death count in 2020. Blue line and blue shaded area indicate the median and 95% CI derived from posterior distributions of the expected weekly deaths. Individual grey lines indicate the reported deaths in 2014–2019.

Similar articles

Cited by

References

    1. Omori R, Mizumoto K and Chowell G (2020) Changes in testing rates could mask the novel coronavirus disease (COVID-19) growth rate. International Journal of Infectious Diseases 94, 116–118. - PMC - PubMed
    1. Oran DP and Topol EJ (2020) Prevalence of asymptomatic SARS-CoV-2 infection: a narrative review. Annals of Internal Medicine 173, 362–367. - PMC - PubMed
    1. Woolf SH, Chapman DA and Lee JH (2021) COVID-19 as the leading cause of death in the United States. JAMA 325, 123–124. - PMC - PubMed
    1. Leon DA et al. (2020) COVID-19: a need for real-time monitoring of weekly excess deaths. The Lancet 395, e81. - PMC - PubMed
    1. Centers for Disease Control and Prevention. Excess deaths associated with COVID-19. Available at https://www.cdc.gov/nchs/nvss/vsrr/covid19/excess_deaths.htm (Accessed 26 February 2021).

Publication types