. 2021 Jul 1;6(61):eabg5669.
doi: 10.1126/sciimmunol.abg5669.

CD8+ T cells specific for conserved coronavirus epitopes correlate with milder disease in COVID-19 patients

Affiliations

CD8+ T cells specific for conserved coronavirus epitopes correlate with milder disease in COVID-19 patients

Vamsee Mallajosyula et al. Sci Immunol. .

Abstract

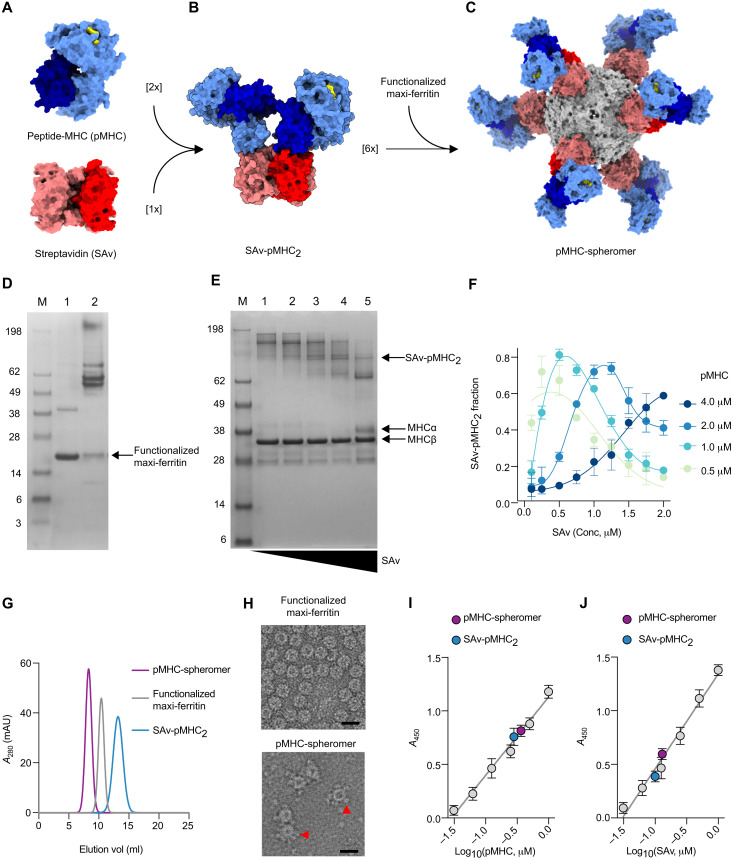
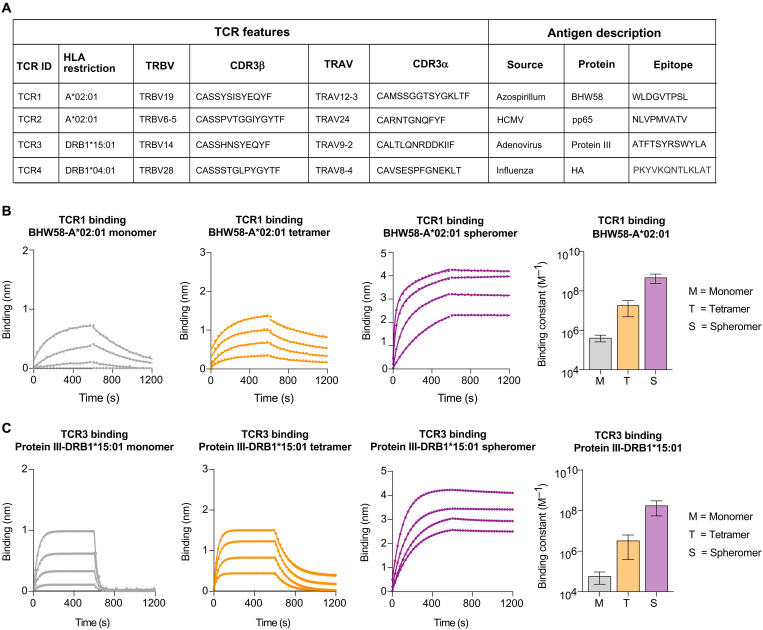
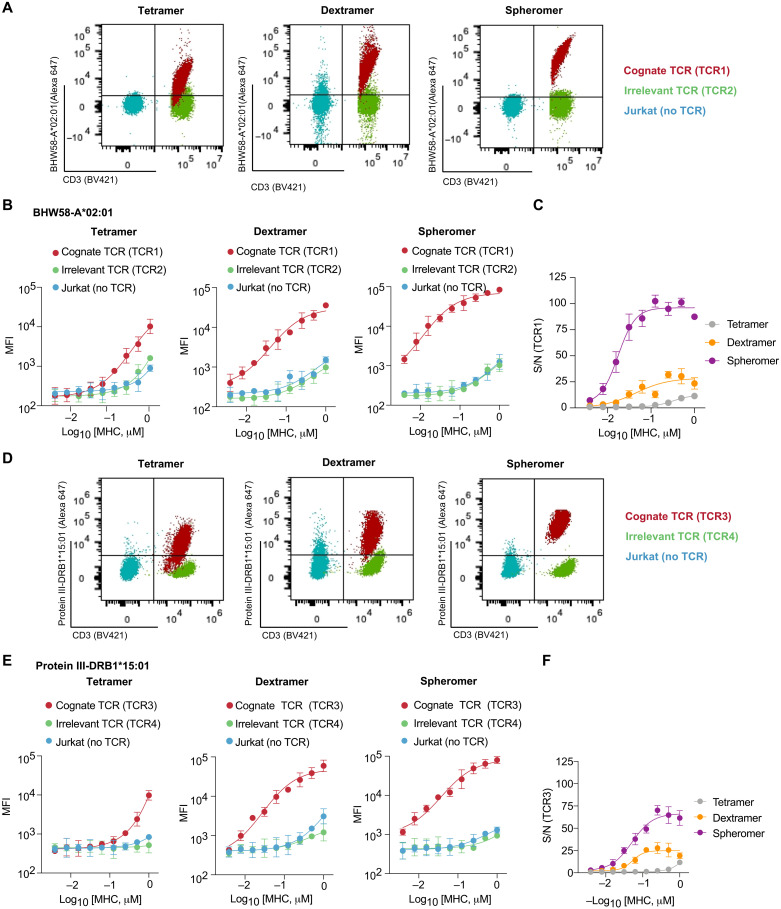
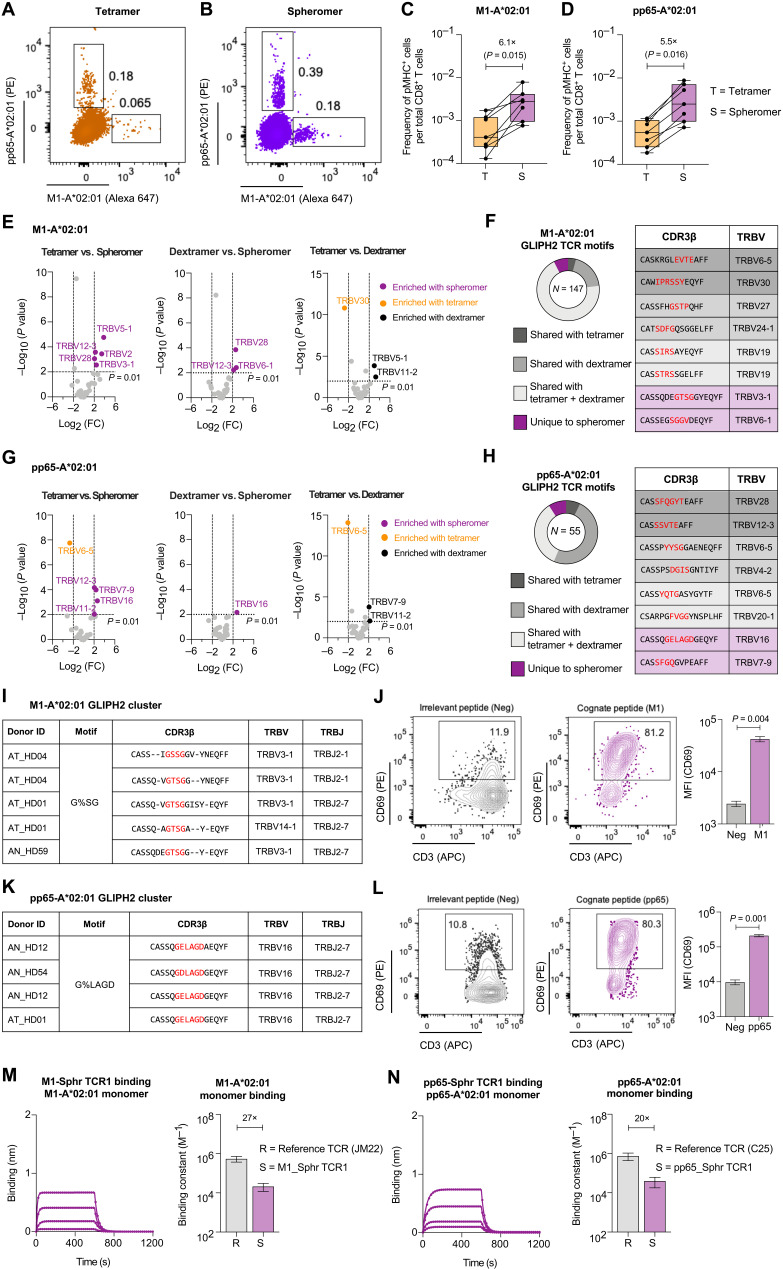
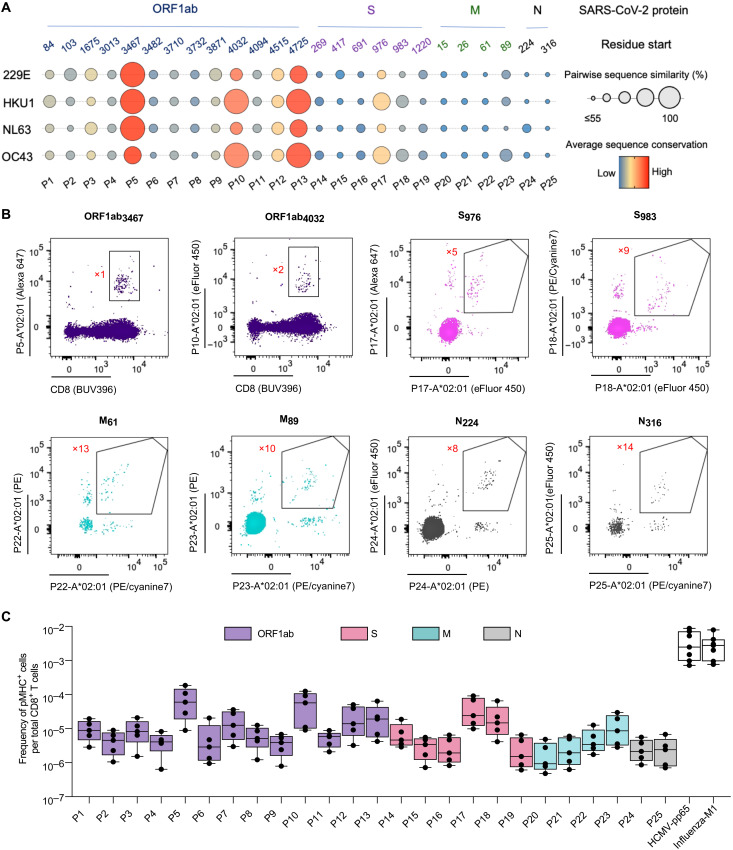
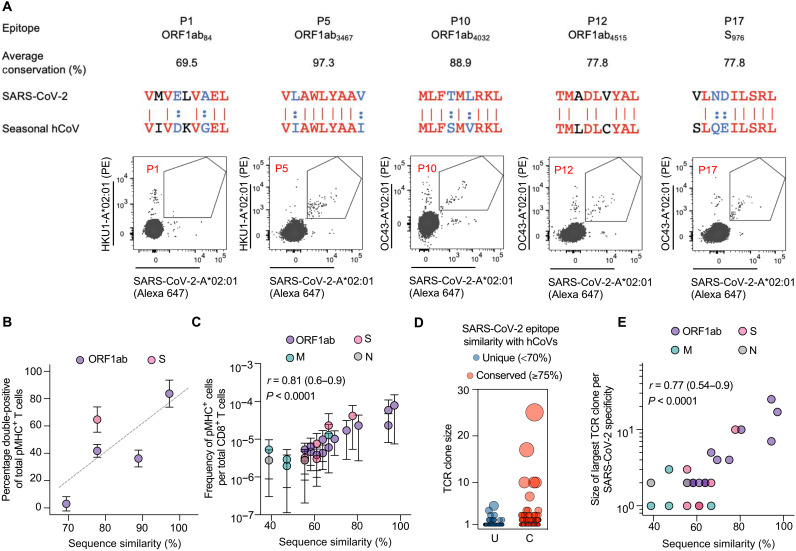
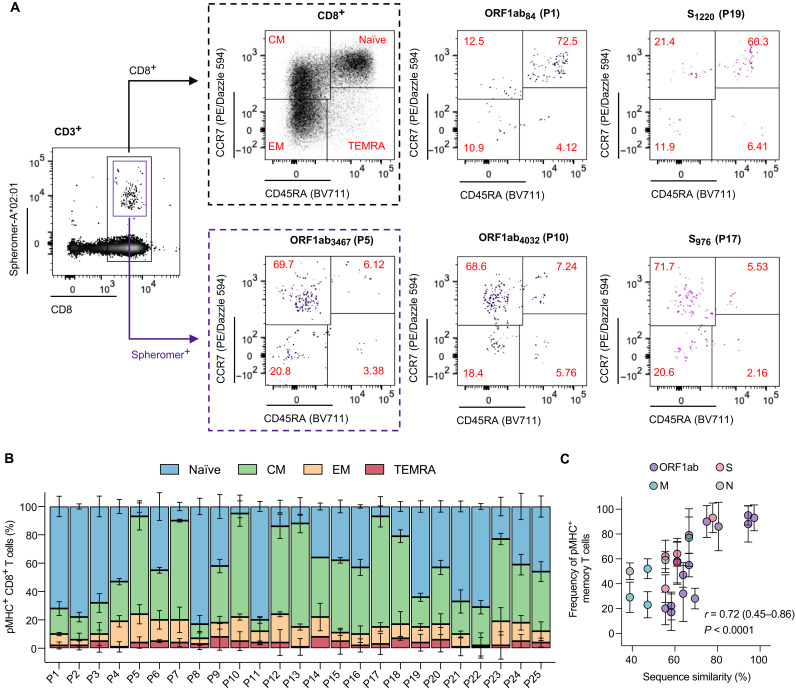
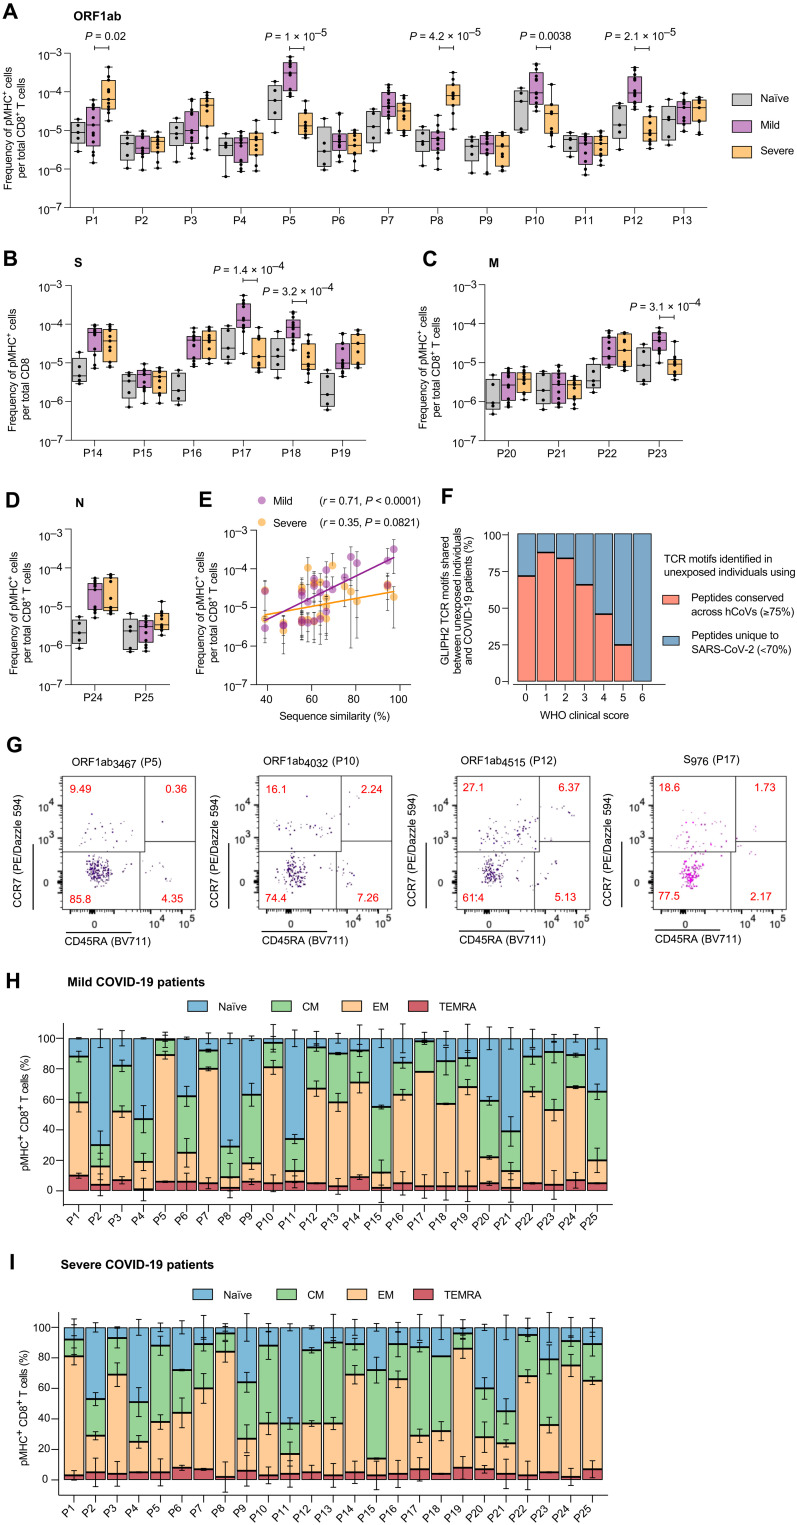
A central feature of the SARS-CoV-2 pandemic is that some individuals become severely ill or die, whereas others have only a mild disease course or are asymptomatic. Here we report development of an improved multimeric αβ T cell staining reagent platform, with each maxi-ferritin "spheromer" displaying 12 peptide-MHC complexes. Spheromers stain specific T cells more efficiently than peptide-MHC tetramers and capture a broader portion of the sequence repertoire for a given peptide-MHC. Analyzing the response in unexposed individuals, we find that T cells recognizing peptides conserved amongst coronaviruses are more abundant and tend to have a "memory" phenotype, compared to those unique to SARS-CoV-2. Significantly, CD8+ T cells with these conserved specificities are much more abundant in COVID-19 patients with mild disease versus those with a more severe illness, suggesting a protective role.


Figures

Fig. 1.
Fig. 1.. Assembly and characterization of the spheromer.
(A) Molecular surface representation of pMHC [Protein Data Bank (PDB) ID: 3TO2; α chain in light blue, β2m in dark blue, and peptide in yellow] and SAv (PDB ID: 2RTG; monomer in red and the rest in coral). (B) Model of a semisaturated SAv-pMHC2 intermediate that has two unoccupied biotin binding sites. A single orientation is shown for simplicity. (C) Model of spheromer that is assembled by the conjugation of six semisaturated SAv-pMHC2 molecules onto a functionalized maxi-ferritin scaffold (PDB ID:2JD6, gray). UCSF Chimera was used for molecular graphics. (D) SAv gel-shift assay to evaluate the functionalization of maxi-ferritin. Lane 1: Biotinylated maxi-ferritin scaffold. The protein dissociates into monomers (23.4 kDa) after boiling and migrates at the corresponding size on a denaturing gel. Lane 2: The flexible tether engineered at the N terminus of each monomer has one biotin binding site. Upon incubation with SAv, migration of the biotinylated maxi-ferritin monomers is retarded because of the formation of a complex. (E) Formation of semisaturated SAv-pMHC2 monitored by SAv gel-shift assay. The MHC α chain is biotinylated and shifts upon binding SAv. The pMHC was incubated with limiting concentrations of SAv resulting in the formation of oligomers with incremental increase in valency. SDS-PAGE is shown for the titration of an MHC-II molecule with SAv. (F) Quantification of SAv-pMHC2 formation as a function of pMHC and SAv reactant concentrations. The mean ± SD of the measurements from three experiments is shown. (G) Size exclusion chromatogram of the spheromer and its components. mAU, milli-absorbance unit. (H) Representative electron micrographs of negatively stained maxi-ferritin and spheromer. SAv-pMHC2 conjugated to the surface of the functionalized scaffold is indicated by red arrows. Scale bars, 20 nm. Validation of SAv-pMHC2 conjugation to the spheromer using (I) anti-MHC and (J) anti-SAv antibodies by ELISA (mean ± SD). The experiment was performed with each sample in triplicate and repeated at least twice.
Fig. 2.
Fig. 2.. Spheromer binds both MHC-I– and MHC-II–restricted TCRs with high avidity.
(A) List of evaluated pMHC-TCR pairs. The binding of (B) TCR1 and (C) TCR3 to different formulations of BHW58-A*02:01 and protein III-DRB1*15:01, respectively, was determined by BLI. An overlay of binding traces over a concentration series of the indicated pMHC formulation from one representative experiment is shown. Each binding experiment was repeated at least three times. The mean ± SD of the binding constant has been graphed.
Fig. 3.
Fig. 3.. Spheromer binds T cell lines expressing MHC-I– or MHC-II–restricted TCRs with high specificity.
(A) Representative flow cytometry plots showing the binding of the indicated BHW58-A*02:01 formulations with equivalent pMHC concentration to a T cell line expressing TCR1. The nonspecific binding of the different formulations was measured using untransduced Jurkat cells and a cell line expressing an irrelevant TCR. CD3 was measured as proxy for TCR expression. (B) Quantification of BHW58-A*02:01 binding measured by flow cytometry (mean ± SD). The experiment was performed with each sample processed in duplicates and repeated at least twice. (C) Signal-to-noise ratio (S/N) of TCR1 binding to distinct BHW58-A*02:01 multivalent formulations. Mean ± SD of the measurements from two independent experiments has been plotted. (D) Representative flow cytometry plots showing the binding of the indicated protein III-DRB1*15:01 formulations with equivalent pMHC concentration to a T cell line expressing TCR3. The nonspecific binding to Jurkat cells and an irrelevant TCR was also measured. CD3 was measured as proxy for TCR expression. (E) Quantification of protein III-DRB1*15:01 binding (mean ± SD) measured by flow cytometry. (F) The signal-to-noise ratio (S/N) of TCR3 binding to distinct protein III-DRB1*15:01 multivalent formulations (mean ± SD).
Fig. 4.
Fig. 4.. Spheromer detects a higher frequency of antigen-specific T cells with a more diverse TCR repertoire.
Representative flow cytometry plots of CD8+ T cells isolated from HLA-A*02:01 individuals stained with influenza-M1 and HCMV-pp65 (A) tetramers or (B) spheromers. Enumeration of epitope-specific (C) M1 and (D) pp65 CD8+ T cells detected in healthy individuals using either tetramer or spheromer. Data from each donor (n = 7) are represented by a point. A two-tailed, matched-pairs Wilcoxon signed-rank test was performed to determine the significance levels. (E) Volcano plots showing the variance in TRBV usage of M1-A*02:01–specific CD8+ T cells detected using the spheromer and other pMHC multimers. The TRBV genes enriched significantly (P ≤ 0.01, Fisher’s exact test) are listed; the spheromers are highlighted in purple. (F) The distribution of spheromer-derived influenza-M1–specific TCR motifs identified by GLIPH2 and representative examples from each category. (G) Volcano plots representing the variance in TRBV usage of pp65-A*02:01–specific CD8+ T cells detected with distinct pMHC multimers. The TRBV genes enriched significantly (P ≤ 0.01, Fisher’s exact test) are listed; the spheromers are highlighted in purple. (H) The distribution of spheromer-derived, HCMV-pp65–specific TCR motifs identified by GLIPH2 and representative examples from each category. (I) Representative GLIPH2 cluster with specificity for influenza-M1 composed of TCR sequences identified exclusively using the spheromer. (J) Representative flow cytometry plots showing the activation of a T cell line (expressing a TCR with “G%SG” motif) stimulated with an irrelevant or cognate (influenza-M1) peptide. The activation was measured by CD69 expression. The significance level was determined by a two-tailed, paired t test. (K) Representative GLIPH2 cluster with specificity for HCMV-pp65 that is composed of spheromer-derived TCR sequences exclusively. (L) Representative flow cytometry plots showing the activation of a T cell line (expressing a TCR with “G%LAGD” motif) stimulated with an irrelevant or cognate (HCMV-pp65) peptide. The activation was measured by CD69 expression. A two-tailed, paired t test was performed to determine significance. The binding of TCR corresponding to clones from GLIPH2 clusters composed exclusively of spheromer-derived sequences to their cognate pMHC monomers (M) M1-A*02:01 and (N) pp65-A*02:01 determined by BLI. Each binding experiment was repeated at least thrice. The mean ± SD of the binding constant has been graphed and compared with a reference influenza-M1 (JM22)– and HCMV-pp65 (C25)–specific TCR.
Fig. 5.
Fig. 5.. The frequency of CD8+ T cells against SARS-CoV-2 epitopes conserved across seasonal hCoVs is elevated in unexposed individuals.
(A) Sequence conservation of SARS-CoV-2 epitopes across seasonal hCoVs. The epitopes were selected on the basis of their biochemical properties and binding to HLA-A*02:01. These peptides span multiple SARS-CoV-2 coding regions (ORF1ab, S, M, and N) and display varying degrees of sequence similarity. The pairwise conservation score between SARS-CoV-2 and any given hCoV is indicated by the size of the bubble. The color represents the average conservation score across all hCoVs. (B) Representative flow cytometry plots of combinatorial, antigen-specific staining of PBMCs from an unexposed individual using HLA-A*02:01 spheromer pools after magnetic enrichment. The fluorophore barcode as shown in the supplementary information used to determine antigen specificity is labeled in red next to the gated population. (C) Enumeration of SARS-CoV-2 epitope–specific CD8+ T cells in unexposed, prepandemic PBMC samples collected between April 2018 and February 2019. Data from each donor (n = 5) are represented by a dot. The frequency of SARS-CoV-2–specific T cells in unexposed individuals is lower than HCMV-pp65– and influenza-M1–specific T cells.
Fig. 6.
Fig. 6.. Cross-reactivity between SARS-CoV-2 and seasonal hCoV CD8+ T cell epitopes.
(A) Representative flow cytometry plots showing the costaining of CD8+ T cells from unexposed individuals using spheromers displaying the indicated SARS-CoV-2 and seasonal hCoV A*02:01 bound peptides after magnetic enrichment. The average conservation score across all hCoVs for each epitope is listed. For the pairwise sequence comparison: identical residues (red), synonymous residues defined in our substitution matrix (blue), and the rest (black). (B) Correlation between the fraction of costained CD8+ T cells and the average sequence similarity of SARS-CoV-2 epitopes with hCoVs in healthy, unexposed individuals (n = 3). (C) A positive correlation was observed between the average sequence similarity of SARS-CoV-2 epitopes with hCoVs and the baseline frequency of SARS-CoV-2 epitope–specific CD8+ T cells in healthy, unexposed individuals. (D) Evaluation of clonal expansion in unexposed individuals using single-cell TCR sequencing of SARS-CoV-2–specific CD8+ T cells identified using spheromer. A summary plot of TCR clonality across all SARS-CoV-2 epitopes tested in this study. The data were divided into two groups (unique or conserved) based on a threshold of ≥75% (allowing for two mismatches in a given 9-mer). Each individual dot represents a distinct TCR clone. (E) Correlation between the average sequence similarity of SARS-CoV-2 epitopes with hCoVs and size of the largest TCR clone of the corresponding specificity.
Fig. 7.
Fig. 7.. CD8+ T cells in unexposed individuals against conserved SARS-CoV-2 epitopes exhibit a predominant memory phenotype.
(A) Representative flow cytometry plots showing the distribution of SARS-CoV-2–specific CD8+ T cells across the naïve and memory subsets defined on the basis of the expression of CD45RA and CCR7 markers: naïve (CD45RA+CCR7+), central memory (CM, CD45RACCR7+), effector memory (EM, CD45RACCR7), and effector memory expressing CD45RA (TEMRA, CD45RA+CCR7) in healthy, unexposed individuals. The antigen-specific CD8+ T cells were enriched using magnetic beads. (B) Quantification of SARS-CoV-2–specific CD8+ T cells across the naïve and memory subsets in healthy, unexposed individuals. (C) Correlation between the average sequence similarity of SARS-CoV-2 epitopes across hCoVs and the frequency of memory (nonnaïve) CD8+ T cells.
Fig. 8.
Fig. 8.. COVID-19 patients with divergent clinical outcomes exhibit distinct SARS-CoV-2 epitope–specific CD8+ T cell responses.
The frequency of SARS-CoV-2 epitope–specific CD8+ T cells across unexposed individuals and COVID-19 patients with mild (n = 13) and severe (n = 11) infections: (A) ORF1ab, (B) S, (C) M, and (D) N. The adjusted P value as determined by Dunn’s test corrected for multiple comparisons is reported for specificities with a significant difference between patients with mild and severe COVID-19. (E) Correlation between the average sequence similarity of SARS-CoV-2 epitopes across hCoVs and the frequency of antigen-specific CD8+ T cells in patients with COVID-19. (F) The distribution of SARS-CoV-2–specific TCR motifs shared between unexposed individuals and patients with COVID-19. TCR motifs were identified using GLIPH2. A lower WHO score indicates milder symptoms. TCR motifs shared between unexposed individuals and patients with mild COVID-19 were identified by conserved SARS-CoV-2 epitopes. In contrast, TCR motifs characterizing patients with severe COVID-19 were detected in unexposed individuals using peptides that were primarily unique to SARS-CoV-2 (adjusted P = 0.00019, Fisher’s test). (G) Representative flow cytometry plots showing the distribution of SARS-CoV-2–specific CD8+ T cells across the naïve and memory subsets in patients with COVID-19. The antigen-specific CD8+ T cells were enriched using magnetic beads. Quantification of SARS-CoV-2–specific CD8+ T cells across the naïve and memory subsets in patients with (H) mild and (I) severe COVID-19.

Similar articles

Cited by

References

    1. Huang C., Wang Y., Li X., Ren L., Zhao J., Hu Y., Zhang L., Fan G., Xu J., Gu X., Cheng Z., Yu T., Xia J., Wei Y., Wu W., Xie X., Yin W., Li H., Liu M., Xiao Y., Gao H., Guo L., Xie J., Wang G., Jiang R., Gao Z., Jin Q., Wang J., Cao B., Clinical features of patients infected with 2019 novel coronavirus in Wuhan, China. Lancet 395, 497–506 (2020). - PMC - PubMed
    1. Krammer F., SARS-CoV-2 vaccines in development. Nature 586, 516–527 (2020). - PubMed
    1. Crawford K. H. D., Dingens A. S., Eguia R., Wolf C. R., Wilcox N., Logue J. K., Shuey K., Casto A. M., Fiala B., Wrenn S., Pettie D., King N. P., Greninger A. L., Chu H. Y., Bloom J. D., Dynamics of neutralizing antibody titers in the months after SARS-CoV-2 infection. J. Infect. Dis. jiaa618 (2020). - PMC - PubMed
    1. Hellerstein M., What are the roles of antibodies versus a durable, high quality T-cell response in protective immunity against SARS-CoV-2? Vaccine X 6, 100076 (2020). - PMC - PubMed
    1. Seow J., Graham C., Merrick B., Acors S., Pickering S., Steel K. J. A., Hemmings O., O’Byrne A., Kouphou N., Galao R. P., Betancor G., Wilson H. D., Signell A. W., Winstone H., Kerridge C., Huettner I., Jimenez-Guardeño J. M., Lista M. J., Temperton N., Snell L. B., Bisnauthsing K., Moore A., Green A., Martinez L., Stokes B., Honey J., Izquierdo-Barras A., Arbane G., Patel A., Tan M. K. I., O’Connell L., O’Hara G., Mahon E. M., Douthwaite S., Nebbia G., Batra R., Martinez-Nunez R., Shankar-Hari M., Edgeworth J. D., Neil S. J. D., Malim M. H., Doores K. J., Longitudinal observation and decline of neutralizing antibody responses in the three months following SARS-CoV-2 infection in humans. Nat. Microbiol. 5, 1598–1607 (2020). - PMC - PubMed

Publication types

Substances