. 2021 Jul 6;118(27):e2106964118.
doi: 10.1073/pnas.2106964118.

A fluorescence-based genetic screen reveals diverse mechanisms silencing small RNA signaling in E. coli

Affiliations

A fluorescence-based genetic screen reveals diverse mechanisms silencing small RNA signaling in E. coli

Jiandong Chen et al. Proc Natl Acad Sci U S A. .

Abstract

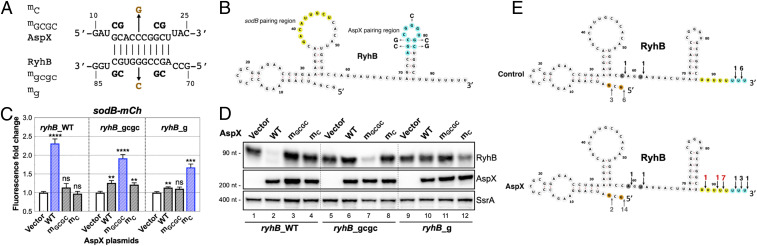
As key players of gene regulation in many bacteria, small regulatory RNAs (sRNAs) associated with the RNA chaperone Hfq shape numerous phenotypic traits, including metabolism, stress response and adaptation, as well as virulence. sRNAs can alter target messenger RNA (mRNA) translation and stability via base pairing. sRNA synthesis is generally under tight transcriptional regulation, but other levels of regulation of sRNA signaling are less well understood. Here we used a fluorescence-based functional screen to identify regulators that can quench sRNA signaling of the iron-responsive sRNA RyhB in Escherichia coli The identified regulators fell into two classes, general regulators (affecting signaling by many sRNAs) and RyhB-specific regulators; we focused on the specific ones here. General regulators include three Hfq-interacting sRNAs, CyaR, ChiX, and McaS, previously found to act through Hfq competition, RNase T, a 3' to 5' exonuclease not previously implicated in sRNA degradation, and YhbS, a putative GCN5-related N-acetyltransferase (GNAT). Two specific regulators were identified. AspX, a 3'end-derived small RNA, specifically represses RyhB signaling via an RNA sponging mechanism. YicC, a previously uncharacterized but widely conserved protein, triggers rapid RyhB degradation via collaboration with the exoribonuclease PNPase. These findings greatly expand our knowledge of regulation of bacterial sRNA signaling and suggest complex regulatory networks for controlling iron homeostasis in bacteria. The fluorescence-based genetic screen system described here is a powerful tool expected to accelerate the discovery of novel regulators of sRNA signaling in many bacteria.

Keywords: Hfq competition; RNA chaperone; RNA sponge; RyhB; exoribonuclease.


Conflict of interest statement

The authors declare no competing interest.

Figures

Fig. 1.
Fig. 1.
A chromosomal tandem fluorescence reporter system allows facile monitoring of endogenous sRNA activity in E. coli. Schematic of the chiP (A) or sodB (D) dual-fluorescence reporter. Colony fluorescence on LB agar for reporter strains carrying translational fusions to chiP (B, WT [JC1200]; ΔchiX [JC1244]) or sodB (E, WT [JC1246]; Δfur [JC1248]; ΔfurΔryhB [JC1252]; and ΔfurΔhfq [JC1269]) was imaged using the Bio-Rad ChemiDoc MP Imaging System. Bright field imaging (B.F.) was used to visualize all colonies on the plate. chiP (C) or sodB (F) reporter fluorescence from cultures grown in LB for 6 h was measured using the TECAN Spark 10M microplate reader. Representative images for colony fluorescence are shown. For fluorescence quantification, three to six individual clones of each strain were grown and measured in 96-well microplates; data are plotted as mean and SD. A detailed description of fluorescence measurement and quantification is included in Materials and Methods.
Fig. 2.
Fig. 2.
A fluorescence-based genomic library screen identified genomic fragments elevating sodB reporter expression. (A) Schematic of the fluorescence-based genomic library suppressor screen. A plasmid library consisting of 1.5 to 5 kb E. coli genomic fragments was introduced into the sodB reporter strain (JC1248). Transformants showing significantly elevated fluorescence were isolated for verification and further analysis. (B) Relative fluorescence of controls (C1, fur and fur+) and candidate clones from the genomic library screen. Cells were grown in 100 μL of LB + Amp in 96-well microplates with shaking (250 rpm) at 37 °C for 6 h, and fluorescence signals were measured at the endpoint. Colony fluorescence of the same set of candidate clones is shown in SI Appendix, Fig. S3D. C1 is a control clone showing basal fluorescence picked from an original screen plate, and fur is the parental reporter strain with the empty vector. Both strains served as basal fluorescence controls. The fur+ strain served as a positive control. The original screen identified 33 brighter clones (#1 to #33), and 7 were dropped after further examination, due to insignificant increase (<1.5-fold) of fluorescence. (C) Summary of total and unique clones aligned to unique genomic loci (cyaR, chiX, yicC, rnt, mcaS, yhbS, and aspX), based on sequencing and mapping of 26 positive clones. Detailed mapping of individual clones to each locus is shown in SI Appendix, Fig. S3E.
Fig. 3.
Fig. 3.
Identification of plasmid-borne regulators necessary and sufficient for suppression of RyhB sRNA function. (A) mCherry fluorescence of sodB reporter strains (JC1248) harboring candidate genomic plasmids (colored bars) or the same plasmids deleted for candidate genes (gray bars). Cells were grown in 96-well microtiter plates with 100 μL of LB + Amp at 37 °C for 6 h, and fluorescence was measured at the endpoint, compared to that of the parental reporter strain with the empty vector. Fluorescence of the sodB reporter was measured in (B) WT (JC1318) or (C) ∆ryhB cells (JC1323) overexpressing CyaR, ChiX, or McaS sRNA from the pBRplac plasmid, RNase T, or YhbS from the pQE-80L plasmid, or AspX, or YicC from the pBR* plasmid. Cells were induced with 50 μM IPTG at inoculation for 6 h at 37 °C; mCherry fluorescence was measured at the endpoint. Biological triplicates were measured for each sample, and data are presented as mean and SD. Whole cell lysates and total RNAs were prepared from cultures in B at the endpoint and analyzed by Western blot (D) and Northern blot (E), respectively. Relative quantitation of mCherry protein and RyhB sRNA is presented in SI Appendix, Fig. S3 G and H, respectively. Unpaired two-tailed Student’s t test was used to calculate statistical significance. Not significant (ns), P > 0.05; (∗) P < 0.05; (∗∗) P < 0.01; (∗∗∗) P < 0.001.
Fig. 4.
Fig. 4.
Many factors, especially ChiX and YhbS, affect stability and function of sRNAs beyond RyhB. Individual regulators, including CyaR, ChiX, and McaS sRNA expressed from pBRplac, or His-RNase T and His-YhbS from pQE-80L, or AspX and YicC from pBR* were transformed into the reporter strains (A) chiP-mCherry (JC1247) or (B) rpoS-mCherry (JC1329) and grown for 6 h at 37 °C with inducer (50 μM IPTG). mCherry fluorescence was measured at the endpoint using a TECAN Spark 10M microplate reader. The chiP reporter is repressed by ChiX, and rpoS translation is activated by three sRNAs (DsrA, RprA, and ArcZ); all are expressed endogenously in these strains. (C) Northern blots were used to measure sRNA levels for CyaR or ArcZ from RNA samples from Fig. 3B; SsrA served as an RNA loading control. The same RNA samples, probing RyhB and sodB, were shown in Fig. 3E. Relative quantitation of CyaR and ArcZ sRNAs are presented in SI Appendix, Fig. S6C. Unpaired two-tailed Student’s t test was used to calculate statistical significance. Not significant (ns), P > 0.05; (∗) P < 0.05; (∗∗) P < 0.01; (∗∗∗) P < 0.001; (∗∗∗∗) P < 0.0001.
Fig. 5.
Fig. 5.
High levels of RNase T suppress RyhB sRNA function by promoting sRNA decay. (A) Plasmid-borne WT or RNase T mutants (R13A: substrate-binding deficient; D23A: noncatalytic) in the sodB reporter strain (JC1249) were induced with IPTG (50 μM) for 6 h prior to fluorescence measurement. The RNase T constructs all carry an N-terminal His tag. (B) sodB reporter strain (JC1249) transformed with WT or RNase T mutants were grown to OD600 of ∼2.0 in LB + Amp + IPTG (50 μM), and total RNAs were extracted for Northern blot analysis. RyhB fragments detected in lane 2 are highlighted with asterisks. Relative levels of the full-length RyhB are shown, normalized to the SsrA loading control first, and then further compared to that of the vector control. Unpaired two-tailed Student’s t test was used to calculate statistical significance. Not significant (ns), P > 0.05; (∗) P < 0.05; (∗∗∗∗) P < 0.0001. (C) Total RNAs from cells expressing vector, WT, or D23A of RNase T in B were subjected to 5′ and 3′ end analysis of RyhB transcripts, by RNA self-ligation, reverse transcription, cloning, and sequencing as described in Materials and Methods. RyhB 5′ and 3′ ends are indicated by upward and downward arrows, respectively. Number of clones mapped to a specific nucleotide position are labeled above/below each arrow, with the significant alterations highlighted in red. RyhB structure shown is based on ref. . Purple highlight shows region detected by the probe used in B. Six or more 3′ U residues have been shown to be important for optimal Hfq binding (66) and are highlighted here in yellow; additional U residues found in RyhB are highlighted in blue.
Fig. 6.
Fig. 6.
AspX, a short RNA expressed from the 3′ end of the aspA gene, selectively antagonizes RyhB function via an RNA-sponge mechanism. (A) Predicted base pairing of RyhB and AspXS. Nucleotide changes of two AspX mutants and corresponding compensatory RyhB chromosomal mutations are shown. (B) Secondary structure of RyhB sRNA (65), with the pairing sequences highlighted in yellow (the primary seed region for mRNA pairing) (65) and in cyan (the predicted region to pair with AspX). (C) RyhB chromosomal variants (WT: JC1291 or mutant ryhB_gcgc: JC1292 or ryhB_g: JC1293) were transformed with WT or mutant AspXL and induced with IPTG (50 μM) for 15 h at 30 °C before measuring mCherry fluorescence. Unpaired two-tailed Student’s t test was used to calculate statistical significance. Not significant (ns), P > 0.05; (∗∗) P < 0.01; (∗∗∗) P < 0.001; (∗∗∗∗) P < 0.0001. (D) Total RNAs were prepared from cultures in C and analyzed by Northern blot for RyhB, AspX, and SsrA. (E) Total RNAs of control or AspX from C were used to map RyhB 5′ and 3′ ends as for Fig. 5C. RyhB 5′ and 3′ ends are indicated by upward and downward arrows, respectively. Number of clones mapped to a specific nucleotide position are labeled above/below each arrow, with the significant alterations highlighted in red. Six or more 3′ U residues have been shown to be important for optimal Hfq binding (66) and are highlighted here in yellow; additional U residues found in RyhB are highlighted in blue.
Fig. 7.
Fig. 7.
YicC collaborates with PNPase to selectively degrade RyhB. (A) The sodB fluorescence fusion strain (JC1249) harboring empty vector (pQE-80L) or pYicC was grown to OD600 of ∼0.15 in LB + Amp and then induced with 100 μM IPTG for 0, 15, 30, and 60 min. Total RNA and protein samples were prepared from cultures at the indicated timepoints and analyzed by Western and Northern blotting. EF-Tu served as a protein loading control and 5S rRNA served as an RNA loading control. (B) WT (XL111) or Δpnp (XL97) transformed with empty vector (pBR*) or pYicC2 were grown to OD600 ∼0.3 in MOPS Neidhardt EZ rich medium; IPTG was added to a final concentration of 200 μM; and sample cultures were taken at 0, 30, 60, and 90 min for RNA and protein extraction. Levels of YicC induction are shown in SI Appendix, Fig. S12D. Total RNA samples were analyzed for RyhB, MicA, ArcZ, GcvB, sodB, and SsrA by Northern blotting (shown in SI Appendix, Fig. S12E). Quantification of the Northern blot for RyhB is in B (biological duplicates) and for sodB in C. Quantitation for other sRNAs by Northern blot is in SI Appendix, Fig. S12F. Data are mean and SD. (D) BACTH reporter strain BTH101 co-transformed with plasmids T18 and T25 fused to YicC or PNPase were grown for 16 h at 30 °C in LB supplemented with Amp and Kan and assayed for β-galactosidase activity. Biological triplicates were assayed, and data are presented as mean and SD. Unpaired two-tailed Student’s t test was used to calculate statistical significance. Not significant (ns), P > 0.05; (∗) P < 0.05; (∗∗) P < 0.01; (∗∗∗) P < 0.001; (∗∗∗∗) P < 0.0001.
Fig. 8.
Fig. 8.
Diverse regulators silence sRNA signaling in E. coli. (I) Three class II sRNAs ChiX, CyaR, and McaS sequester the RNA chaperone Hfq, leading to decay of sRNAs that are not bound to Hfq, including RyhB. (II) Exonuclease RNase T competitively trims sRNA polyU tails, thus compromising Hfq binding, leading to sRNA degradation. (III) YhbS, a putative acetylase, acts broadly on sRNA/Hfq signaling, possibly by acetylating Hfq or proteins in Hfq complexes. (IV) AspX forms complementary base pairing with the RyhB 3′ terminator to destabilize RyhB; AspX appears to selectively repress RyhB function. (V) YicC, a stress-induced protein, selectively degrades RyhB and likely a few other sRNAs via the 3′ to 5′ exoribonuclease PNPase.

References

    1. Frohlich K. S., Gottesman S.; Small regulatory RNAs in the enterobacterial response to envelope damage and oxidative stress , Microbiol. Spectr. 6, 10.1128/microbiolspec.RWR-0022-2018 (2018). - DOI - PMC - PubMed
    1. Holmqvist E., Wagner E. G. H., Impact of bacterial sRNAs in stress responses. Biochem. Soc. Trans. 45, 1203–1212 (2017). - PMC - PubMed
    1. Updegrove T. B., Zhang A., Storz G., Hfq: The flexible RNA matchmaker. Curr. Opin. Microbiol. 30, 133–138 (2016). - PMC - PubMed
    1. Wagner E. G. H., Romby P., Small RNAs in bacteria and archaea: Who they are, what they do, and how they do it. Adv. Genet. 90, 133–208 (2015). - PubMed
    1. Storz G., Vogel J., Wassarman K. M., Regulation by small RNAs in bacteria: Expanding frontiers. Mol. Cell 43, 880–891 (2011). - PMC - PubMed

Publication types