. 2021 Jul 2;373(6550):eabe9383.
doi: 10.1126/science.abe9383.

Diet-regulated production of PDGFcc by macrophages controls energy storage

Affiliations

Diet-regulated production of PDGFcc by macrophages controls energy storage

Nehemiah Cox et al. Science. .

Abstract

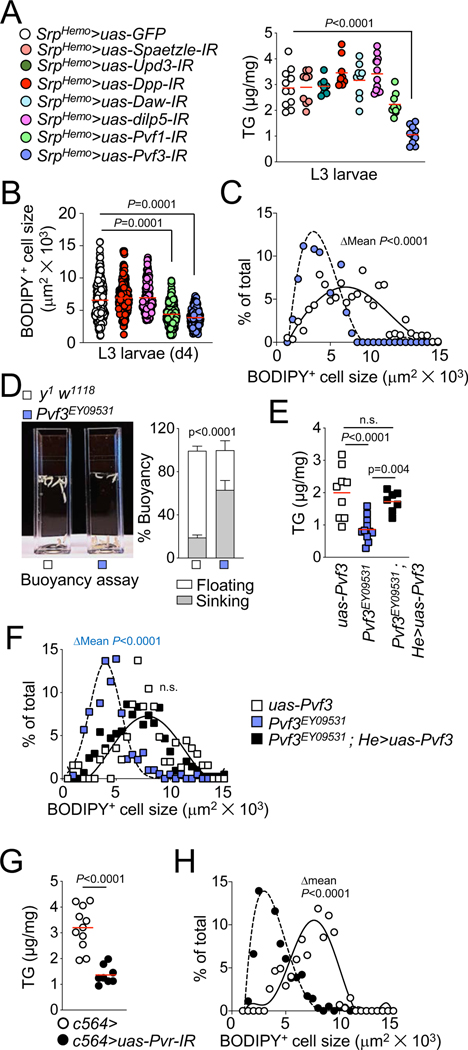
The mechanisms by which macrophages regulate energy storage remain poorly understood. We identify in a genetic screen a platelet-derived growth factor (PDGF)/vascular endothelial growth factor (VEGF)-family ortholog, Pvf3, that is produced by macrophages and is required for lipid storage in fat-body cells of Drosophila larvae. Genetic and pharmacological experiments indicate that the mouse Pvf3 ortholog PDGFcc, produced by adipose tissue-resident macrophages, controls lipid storage in adipocytes in a leptin receptor- and C-C chemokine receptor type 2-independent manner. PDGFcc production is regulated by diet and acts in a paracrine manner to control lipid storage in adipose tissues of newborn and adult mice. At the organismal level upon PDGFcc blockade, excess lipids are redirected toward thermogenesis in brown fat. These data identify a macrophage-dependent mechanism, conducive to the design of pharmacological interventions, that controls energy storage in metazoans.


Figures

Figure 1.
Figure 1.. Ccr2–independent macrophages control lipid storage in mouse adipocytes.
(A) Weight of epididymal (eWAT) and inguinal (iWAT) fat pads from 14-week-old C57Bl/6J mice, Ccr2–/– mice, and 12-week-old Lepr–/– mice all subjected to indicated diets and treatments for eight weeks. N= 12 to 20 mice per experimental group, from four independent experiments for C57Bl/6J mice, and n= 8 to 16 mice per experimental group, from three independent experiments for Ccr2–/– mice, and Lepr–/– mice. Dots represent individual mice. Statistics: P-values were obtained by comparing mean weight using one-way ANOVA with Sidak’s correction for multiple group comparison. Red lines indicate mean values. (B) Representative fluorescent whole-mount images stained for F4/80 and BODIPY of iWAT from 14-week-old C57Bl/6J mice and 12-week-old Lepr–/– (db/db) mice, all subjected to indicated diets and treatments for eight weeks. Scale bars are 40 μm. (C) Quantitative analysis of adipocyte size in iWAT of C57Bl/6J and Ccr2–/– mice from (A,B). N=10 C57Bl/6J and N=6 Ccr2–/– mice per experimental group, from two to three independent experiments. Hundred to two hundred adipocytes per fat pad were measured using bitplane Imaris image analysis software in three different areas. Dots represent percent of adipocytes per size intervals. Statistics: P-values were obtained by comparing mean adipocyte sizes using one-way ANOVA with Sidak’s correction for multiple group comparison. See also fig. S1 and S2.
Figure 2.
Figure 2.. Macrophages control lipid storage in adipocytes of newborn mice and fat body cells of Drosophila larvae.
(A) Representative fluorescent whole-mount images stained for F4/80 and BODIPY (Left) and quantitative analysis of adipocytes size (Right) for inguinal white adipose tissues (iWAT) from 4-week-old Csf1rCre; Csf1rf/f mice, Tnfrsf11aCre; Csf1rf/f mice and their littermate controls. Fat pads from six mice, obtained from three to six litters, were analysed for each group and hundred to two hundred adipocytes were measured using bitplane Imaris image analysis software in three different areas per fat pad. Dots represent percent of adipocytes per size intervals. Scale bars are 40 μm. Statistics: P-values were obtained by comparing mean adipocyte sizes using t-test. See also fig. S3 and S4. (B) Representative fluorescent images of L3 larvae depicting the expression pattern of hemocyte-specific drivers Hemolectin (Hml, Hml-gal4>uas-GFP) and Serpent (Srp, SrpHemo-mCherry) and the contact between hemocytes and fat body cells (c564-gal4>uas-GFP). Scale bars are 500 μm (whole larvae), 80 μm (larvae insets), and 10 μm (far right). (C) Quantitative analysis of buoyancy in wandering L3 larvae from SrpHemo-gal4>uas-reaper and control lines. N=6 independent experiments from three crosses, each with experimental groups of twenty larvae were analyzed. Statistics: Buoyancy (mean ± SD) was compared between groups using t-test. (D) Quantification of triglyceride level (TG) normalized to total protein measured in SrpHemo-gal4>uas-reaper L3 larvae and controls in N=11 independent experiments from four crosses, each with experimental groups of ten larvae, and in Hml-gal4>uas-reaper and controls in N=10 independent experiments, from four crosses, each with experimental groups of ten larvae. Dots represent experimental groups. Statistics: Mean ± SD TG level were compared between genotypes using one-way ANOVA with Sidak’s correction for multiple group comparison. (E) Quantitative analysis of BODIPY+ fat body cell size in wandering L3 SrpHemo-gal4>uas-reaper larvae and controls from N=6 experiments from three crosses, each with experimental groups of twenty larvae, and Hml-gal4>uas-reaper larvae and controls from N=9 experiments from four crosses, each with experimental groups of twenty larvae. For each replicate size of hundred fat body cells were measured using bitplane Imaris image analysis software. Dots represent percent of adipocytes per size intervals. Statistics: P-values were obtained by comparing mean fat body cell sizes between genotypes using t-test.
Figure 3.
Figure 3.. Hemocyte-derived PDGF-family growth factor Pvf3 controls lipid storage in Drosophila fat body cells.
(A) Quantification of triglyceride level (TG) normalized to total protein measured in wandering L3 larvae from flies with hemocyte-specific RNAi for the indicated genes and SrpHemo>uas-GFP control. For each RNAi, N= 8 to 12 experiments from four crosses were analyzed, each with experimental groups of ten larvae. Dots represent means of individual experiments. Statistics: P-values were obtained by comparing mean TG levels in mutant and SrpHemo>uas-GFP control lines using one-way ANOVA with Dunnett’s correction for multiple group comparison with a single control. Red lines indicate mean values. (B) Quantification of BODIPY+ fat body cell size in L3 larvae from flies with hemocyte-specific RNAi for the indicated genes and SrpHemo>uas-GFP control. For each RNAi, N= 4 to 7 experiments from three to six crosses were analyzed, each with experimental groups of ten larvae, and hundred cells per replicate were measured. Dot represents individual fat body cells. Statistics: P-values were obtained by comparing mean BODIPY+ fat body cell sizes using oneway ANOVA with Dunnett’s correction for multiple group comparison with a single control. Red lines depict mean values. (C) Analysis of BODIPY+ fat body cells size distribution in L3 SrpHemo-gal4>uas-pvf3-IR and control larvae in N=3 experiments from three crosses, each with experimental groups of ten larvae. Hundred fat body cells were measured using bitplane Imaris image analysis software for each replicate. Dots represent percent of fat body cells per size intervals. Statistics: P-values were obtained by comparing mean adipocyte sizes using t-test. (D) Quantitative analysis of buoyancy in wandering L3 larvae from Pvf3EY09531 and control uas-Pvf3 L3 larvae in N=6 independent experiments, from three crosses, each with experimental groups of twenty larvae. Statistics: Buoyancy (mean ± SD) was compared between groups using t-test. (E) Quantification of TG level normalized to total protein measured in Pvf3EY09531 , uas-Pvf3 (control), and Pvf3EY09531 ; He>uas-Pvf3 (rescue) L3 larvae. For each genotype N= 7 to 12 experiments from four crosses were analyzed, each with ten larvae per experimental group. Dots represents individual experimental groups. Statistics: Mean TG levels were compared using one-way ANOVA with Sidak’s correction for multiple group comparison. Red lines indicate mean values. (F) Analysis of BODIPY+ fat body cells size distribution in larvae from (E), in N=5 experiments per genotypes from three crosses, each with ten larvae per experimental group. Hundred fat body cells were examined using bitplane Imaris image analysis software for each replicate. Statistics: P-values were obtained by comparing mean adipocyte sizes using one-way ANOVA with Sidak’s correction for multiple group comparison as in (E). (G) Quantification of TG level normalized to total protein measured in L3 larvae from flies with fat body-specific RNAi of Pvr (the PVF receptor) and controls. For Pvf RNAi flies and controls N=8 and N=11 independent experiments, respectively, were performed, from four crosses, and with ten larvae per experiment. Dots represents individual experimental groups. Statistics: Mean TG levels were compared between the two genotypes using t-test. (H) Analysis of BODIPY+ fat body cell size distribution in L3 larvae from (G). N=4 experiments from four crosses, ten larvae per experiment, and hundred to hundred and fifty cells per replicate were analyzed using bitplane Imaris image analysis software. Dots represent percent of fat body cells per intervals of size. Statistics: Mean BODIPY+ fat body cell sizes were compared between the two genotypes using t-test. Red lines indicate mean values.
Figure 4.
Figure 4.. Macrophage-derived PDGFcc is required for adipocyte hypertrophy in mice.
(A) Normalized expression of Pdgf/Vegf family genes in murine macrophages from indicated tissues. Data were obtained from the Immgen database and the expression values were normalized by DESeq2. (B) qPCR analysis of Pdgfc transcripts normalized to Gapdh (2-ΔCt) in inguinal white adipose tissues (iWAT) from 14-week-old C57Bl/6J mice, Ccr2–/– mice, and 12-week-old Lepr–/– (db/db) mice all subjected to indicated diets and treatments for eight weeks. Fat pads from N= 8 to 15 mice from two to three independent experiments were analyzed for each group and experimental condition. Dots represent values for individual mice. Statistics: P-values were obtained by comparing mean expression values using one-way ANOVA with Sidak’s correction for multiple group comparison. Red lines indicate mean values. (C) qPCR analysis of Pdgfc transcripts, normalized to Gapdh (2-ΔCt), in iWAT of 4-week-old Csf1rCre; Csf1rf/f mice and littermate controls. Fat pads from five mice per genotype from three independent litters were analyzed. Dot represents values for individual mice. Statistics: P-values were obtained by comparing mean expression values between different genotypes using t-test. Red lines indicate mean values. (D) Weight of iWAT and interscapular brown adipose tissue (iBAT) from 4-week-old Csf1rCre; Pdgfcf/f mice and control littermates, N= 4 to 7 mice per genotype, from four litters. Dots represent individual mice. Statistics: P-values were obtained using one-way ANOVA with Sidak’s correction for multiple group comparison. Red lines indicate mean values. (E) Representative whole-mount images and quantitative analysis of adipocyte size of iWAT from Csf1rCre; Pdgfcf/f mice and control littermates at four weeks of life. Fat pads from N=5 mice from four independent litters were analyzed for each genotype. Hundred adipocytes were measured per fat pad using bitplane Imaris image analysis software, from three different areas. Dots represent percent of adipocytes per size interval. Scale bars are 40 μm. Statistics: P-values were obtained by comparing mean adipocyte sizes between different genotypes using t-test. (F) Representative photographs of teeth from N= 4 to 7 Csf1rCre; Pdgfcf/f mice and littermate controls at four weeks of life from four litters. (G) Weight gain of 12-week-old C57Bl/6J mice fed a 10% or 45% lipid diet and treated with anti-PDGFcc antibodies or Goat IgG for six weeks. N=9 mice per experimental group, from two independent experiments were analyzed. Mice were weighted weekly for six weeks. Dots and bars represent mean body weight ± SD. Statistics: P-values were obtained by comparing the mean body weights between experimental groups using two-way ANOVA with Sidak’s correction for multiple group comparison. (H) Weight of epididymal (eWAT) and inguinal (iWAT) fat pads from 12-week-old C57Bl/6J mice, N= 8 mice per experimental group, from two independent experiments. Dots represent individual mice. Statistics: P-values were obtained by comparing mean adipose tissue weights using one-way ANOVA with Sidak’s correction for multiple group comparison. Red lines indicate mean values. (I) Whole-mount images and quantitative analysis of adipocyte size for iWAT from 12-week-old C57Bl/6J mice. Fat pads from N= 9 mice from two independent experiments were analyzed for each group and experimental condition and hundred adipocytes were measured using bitplane Imaris image analysis software in three different areas per fat pad. Dots represent percent of adipocytes per size interval. Scale bars are 40 μm Statistics: P-values were obtained by comparing mean adipocyte sizes using one-way ANOVA with Sidak’s correction for multiple group comparison.
Figure 5.
Figure 5.. Diet regulates PDGFcc production by adipose tissue resident macrophages.
(A) Representative tSNE color coded flow plot (Top) and May–Grunwald Giemsa staining (Bottom) of Csf1r-dependent F4/80+ macrophage subsets from inguinal white adipose tissue (iWAT) of C57Bl/6J mice. Fat pads from thirty wild-type mice were analyzed with similar results, see fig. S7. Scale bars are 10 μm. (B) qPCR analysis of Pdgfa, Pdgfb, Pdgfc, and Pdgfd transcripts, normalized to Gapdh and ActinB, in FACS-sorted iWAT macrophages from 4-week-old C57Bl/6J mice. N= 10 to 30 sorted macrophage samples from thirty mice were analyzed per group. Each dot represents a sorted sample from an individual mouse. Statistics: P-values were obtained by comparing mean expression values using one-way ANOVA with Sidak’s correction for multiple group comparison. Red lines indicate mean values. (C) qPCR analysis of Pdgfc, Tnf, and Il1b transcripts, normalized to Gapdh and ActinB, in iWAT macrophages, liver Kupffer cells, interscapular brown adipose tissue (iBAT) macrophages, and blood monocytes isolated by FACS from 14-week-old C57Bl/6J subjected to the indicated diets and treatments for eight weeks. N= 5 to 7 sorted macrophage samples and N=9 blood monocyte samples were analyzed per indicated treatment and diet. Each dot represents a sorted macrophage sample from an individual mouse. Statistics: P-values were obtained by comparing mean expression values using one-way ANOVA with Sidak’s correction for multiple group comparison. Red lines indicate mean values. (D) Representative tSNE color coded flow plot of Csf1r-dependent F4/80+ macrophage subsets from iWAT of Csf1rCre; Csf1rf/f mice, Flt3Cre; Csf1rf/f mice, Ccr2–/– mice, and Tnfrsf11aCre; Csf1rf/f mice. Fat pads from N= 4 to 9 mice per genotype were analyzed from at least three independent litters. (E) Analysis of YFP+ embryo-derived macrophages by flow cytometry of iWAT from 4-week-old Csf1rMeriCreMer; RosaLSL-YFP mice, pulse labeled at embryonic day (E) 8.5 with 4-hydroxy tamoxifen (OH-TAM). Fat pads from ten mice from eight independent litters were analyzed with similar results. (F) Analysis of macrophage dynamics in parabiotic pairs by flow cytometry of blood monocytes and adipose tissue macrophages from iWAT of CD45.1 / CD45.2 female parabiotic pairs maintained for eight weeks on 10% or 45% fat diet before analysis at 14-week-old. N=8 mice were analyzed, and each dot represents one mouse. (G) Fluorescent whole-mount images and quantitative analysis of PDGFcc+ F4/80+ cells from iWAT of 4-week-old Tnfrsf11aCre; Csf1rf/f mice and littermate control mice. Images are representative of N=5 fat pads from four independent litters. Scale bars are 40 μm. Fat pads from N=6 mice from four independent litters were analyzed for each genotype and cells were quantified from three different areas per fat pad. Each dot represents data from an individual mouse. Statistics: P-values were obtained by comparing mean values between different genotypes using t-test. Red lines indicate mean values.
Figure 6.
Figure 6.. PDGFcc controls adipocyte hypertrophy and thermogenesis in mice.
(A, B) Cumulative food intake measured gravimetrically over 5 days (A) and fecal caloric density measured by bomb calorimetry on the last day of the experiment (B) in groups of 8-week-old C57Bl/6J mice fed a 45% lipid diet and treated with anti-PDGFcc antibodies or Goat IgG, N=8. Dots represent mean cumulative food intake ± SD in (A) and individual mice in (B). Statistics: Mean cumulative food intake and fecal caloric density were compared by t-test. (C) Representative H&E staining (Left) and quantification of triglycerides (TG) content per mg of tissue (right) of livers from 12-week-old C57Bl/6J mice (from Fig 4 G to I) fed a 10% or 45% lipid diet for six weeks and injected with anti-PDGFcc antibodies or with Goat IgG. N=8 mice per group, from two independent experiments were analyzed. Dots represent individual mice. Scale bars are 100 μm. Statistics: Mean values were compared by one-way ANOVA with Sidak’s correction for multiple group comparison. Red lines indicate mean values. (D) Quantification of TG content per mg of tissue from 4-week-old Csf1rcre; Pdgfcf/fmice and control littermates. N= 5 to 6 mice from three litters were analyzed. Dots represent individual mice. Statistics: Mean TG values were compared by t-test. Red lines indicate mean values. (E) Heatmap representation of Pdgfc, Plin1, Ucp1, Dio2, Prdm16, and Cidea transcripts expression (2-ΔCt, relative to Gapdh) in inguinal white adipose tissue (iWAT), epididymal white adipose tissue (eWAT), and interscapular brown adipose tissue (iBAT) from 12-week-old C57Bl/6J mice treated for six weeks with anti-PDGFcc antibodies or Goat IgG. Color scale is normalized to mean expression value of each transcript in fat tissues of mice fed a control diet (10% lipid) and treated with control Goat IgG. N= 5 to 10 mice per group were analyzed. Statistics: Mean expressions values were compared by one-way ANOVA with Sidak’s correction for multiple group comparison. * indicates P<0.01 as compared to control-diet-fed mice injected with Goat IgG controls, indicates P<0.01 as compared to control-diet-fed mice injected with anti-PDGFcc neutralizing antibodies (⍺ PDGFcc), and # indicates P<0.001 as compared to high-fat-diet-fed (45% lipid) mice injected with Goat IgG controls. (F) Heatmap representation as in (E), from iWAT, eWAT, and iBAT from 14-week-old C57Bl/6J mice treated for eight weeks with PLX5622 or vehicle control. N= 5 to 10 mice per group were analyzed. Color scale is normalized as in (E) to transcripts in fat pads from controldiet-fed mice treated with vehicle control. Statistics: As in (E), * indicates P<0.01 as compared to control-diet-fed mice and treated with vehicle control, indicates P<0.01 as compared to control-diet-fed mice and treated with PLX, @ indicates P <0.01 as compared to high-fat-diet-fed mice and treated with vehicle control. (G) Heatmap representation as in (E) from iWAT and iBAT from 4-week-old Csf1rcre; Csf1rf/f mice, Tnfrsf11acre; Csf1rf/f mice, Csf1rcre; Pdgfcf/f mice, and their littermate controls, N= 5 to 12 mice per group. Color scale is normalized to exoression in fat pads of Crenegative controls. Statistics: Mean expression values are compared by t-test. * indicates P<0.01 as compared to Cre-negative littermate controls. (H, I) Representative infrared images (H) and quantitative measurement of body temperature using the top 10% warmest pixels (I) of the interscapular area on day six of treatment in C57Bl/6J mice fed a 45% lipid diet and injected with anti-PDGFcc antibodies or Goat IgG, N=8 per condition. Dots represent individual mice. Statistics: Mean of experimental groups were compared by one-way ANOVA with Sidak’s correction for multiple group comparison. Red lines indicate mean values. (J, K) Analysis of Oxygen uptake (VO2) and Carbon Dioxide (VCO2) kinetics (J) and covariance corrected cumulative energy expenditure (EE, ANVOVA Corr.) (K) of C57Bl/6J mice fed a 45% lipid diet and injected with anti-PDGFcc antibodies or Goat IgG over a five-day period in a Promethion Metabolic Screening System. N=8 mice per experimental group were analyzed. Dots in J represent mean values over time, and dots in K represent individual mice. Statistics: Mean of experimental groups in K are compared using t-test. Red lines indicate mean values.
Figure 7.
Figure 7.. PDGFcc is both required and sufficient for adipocyte hypertrophy in isolated fat tissue.
(A-C) Representative whole-mount staining (A), quantitative analysis of BODIPY+ area (B), and quantitative analysis of adipocyte size (C), in wild-type epididymal white adipose tissue (eWAT) explants cultivated for ten days with Goat IgG or anti-PDGFcc neutralizing antibodies (⍺ PDGFcc) and stained for PERILIPIN (PLIN1), F4/80, and BODIPY, N=5. Dots represent individual explants in (B), and the % of adipocytes per size intervals in (C). For adipocyte size distribution, >10,000 cells were analyzed per explant using bitplane Imaris image analysis software. Scale bars are 20 μm. Statistics: Mean BODIPY+ area in (B) and adipocyte size in (C) were compared using t-test. Red lines indicate mean values. (D) Representative whole-mount staining of eWAT explants from Tnfrsf11aCre; Csf1rf/f mice and littermate Csf1rf/f controls. N= 10 to 15 explants from five litters were cultured for ten days ex vivo and stained for PLIN1, F4/80, and BODIPY. Dots represent individual explants. Scale bars are 20 μm. (E, F) Quantitative analysis of BODIPY+ area (E) and quantitative analysis of adipocyte size (F) using bitplane Imaris image analysis software in explants from Tnfrsf11aCre; Csf1rf/f mice and Csf1rf/f littermate controls. Explants were cultured with PBS or recombinant PDGFcc. N= 5 to 11 explants obtained from five litters were analyzed. Dots represent individual explants in (E) and the percent of adipocytes per intervals of size in (I). Statistics: Results from genotypes and treatment groups were compared by one-way ANOVA with Sidak’s correction for multiple group comparison. Red lines indicate mean values.
Figure 8.
Figure 8.. anti-PDGF regulates genes involved in lipid storage
(A) Hallmark pathway analysis of RNAseq dataset obtained from whole inguinal white adipose tissues (iWAT) of 8-week-old mice treated with anti-PDGFcc antibodies or Goat IgG for two weeks, N=4 per condition. A selection of hallmark pathways significantly affected (FDR < 0.05) in untreated high-fat-diet-fed mice (HFU) as compared to untreated control-fat-fed mice (CFU), and in anti-PDGFcc antibody treated high-fat-diet-fed mice (HFT) as compared to untreated high-fat-diet-fed mice (HFU) are depicted. Statistics: P-values were estimated by the number of random gene sets with the same or more extreme enrichment scores divided by the total number of generated gene sets using the fgsea package. q-values were obtained via Benjamini-Hochberg multiple hypothesis correction. (B) Heatmap depicting row-based log2(fold change) z-scores is shown for leading-edge genes from the custom lipogenesis/lipid storage (See Methods) gene set in anti-PDGFcc antibody treated control-fat-fed mice (CFT) as compared to untreated control-fat-fed mice (CFU), anti-PDGFcc antibody treated high-fat-diet-fed mice (HFT) as compared to untreated high-fat-diet-fed mice (HFU), untreated high-fat-diet-fed mice group (HFU) as compared to untreated control-diet-fed mice group (CFU), and anti-PDGFcc antibody treated high-fat-diet-fed mice group (HFT) as compared to anti-PDGFcc antibody treated control-diet-fed mice group (CFT) are depicted. Crosses denote leading-edge genes. (C) qPCR analysis of Insig1 transcripts normalized to Perilipin (2-ΔCt) in iWAT from 14-week-old C57Bl/6J mice, Ccr2–/– mice, and 12-week-old Lepr–/– (db/db) mice all subjected to indicated diets and treatments for eight weeks. Fat pads from N=4 mice were analyzed for each group and experimental condition. Dots represent values for individual mice. Statistics: P-values were obtained by comparing mean expression values using one-way ANOVA with Sidak’s correction for multiple group comparison. Red lines indicate mean values. (D, E) qPCR analysis of Insig1 expression (2-ΔCt calculated relative to Perilipin) in explants from Csf1rf/f and Tnfrsf11aCre; Csf1rf/f littermates (D), and from wildtype explants cultured in the presence of Goat IgG or anti-PDGFcc neutralizing antibodies (⍺ PDGFcc) (E), as depicted in Fig 7. N=4 explants per experimental condition from two independent experiments were analyzed. Dots represent individual explants. Statistics: Results from (D) and (E) were compared using t-test. Red lines indicate mean values.

Comment in

References

    1. Rosen ED, Spiegelman BM, Adipocytes as regulators of energy balance and glucose homeostasis. Nature 444, 847–853 (2006). - PMC - PubMed
    1. Rodeheffer MS, Birsoy K, Friedman JM, Identification of white adipocyte progenitor cells in vivo. Cell 135, 240–249 (2008). - PubMed
    1. Hotamisligil GS, Foundations of Immunometabolism and Implications for Metabolic Health and Disease. Immunity 47, 406–420 (2017). - PMC - PubMed
    1. Wise A, Adipocyte number and size in hypothalamic obesity induced in weanling mice by gold thioglucose and bipiperidyl mustard. Nutr Metab 19, 291–298 (1975). - PubMed
    1. Hirsch J, Batchelor B, Adipose tissue cellularity in human obesity. Clin Endocrinol Metab 5, 299–311 (1976). - PubMed

Publication types

MeSH terms

Substances