. 2021 Jul 1;12(1):4064.
doi: 10.1038/s41467-021-24375-3.

Xanthomonas effector XopR hijacks host actin cytoskeleton via complex coacervation

Affiliations

Xanthomonas effector XopR hijacks host actin cytoskeleton via complex coacervation

He Sun et al. Nat Commun. .

Abstract

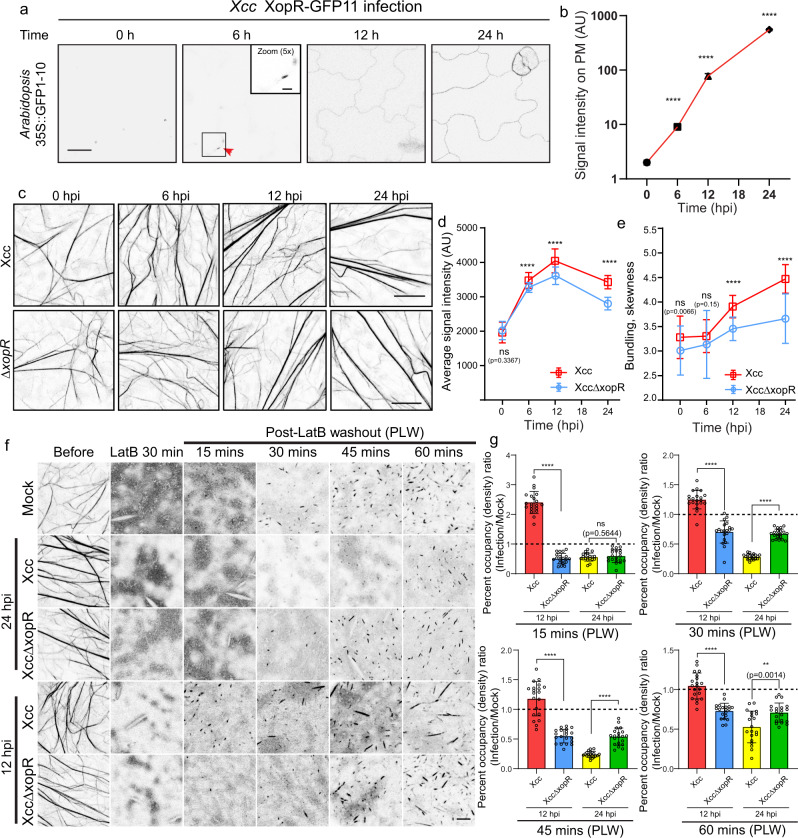
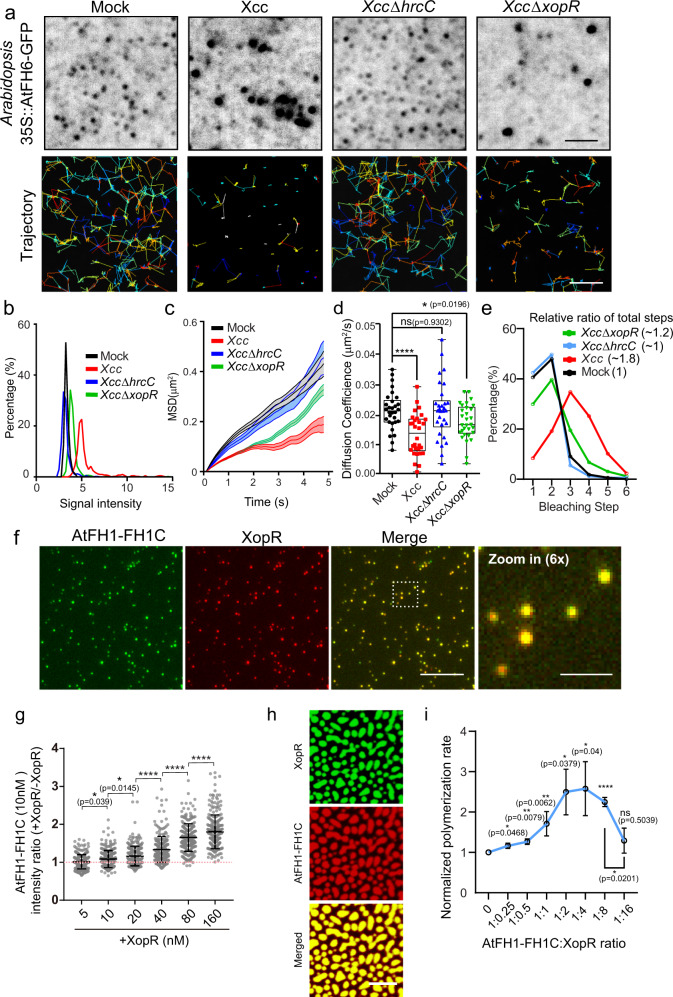
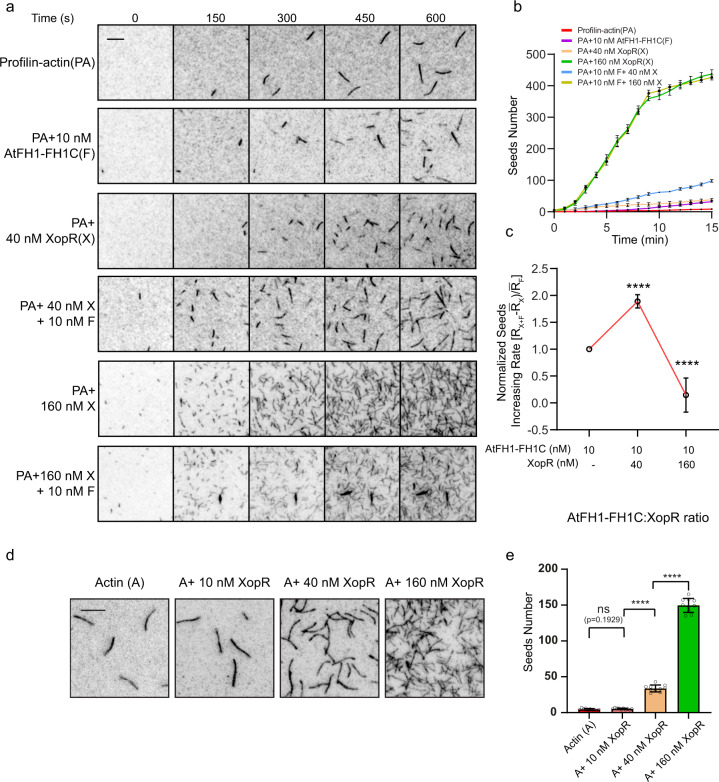
The intrinsically disordered region (IDR) is a preserved signature of phytobacterial type III effectors (T3Es). The T3E IDR is thought to mediate unfolding during translocation into the host cell and to avoid host defense by sequence diversification. Here, we demonstrate a mechanism of host subversion via the T3E IDR. We report that the Xanthomonas campestris T3E XopR undergoes liquid-liquid phase separation (LLPS) via multivalent IDR-mediated interactions that hijack the Arabidopsis actin cytoskeleton. XopR is gradually translocated into host cells during infection and forms a macromolecular complex with actin-binding proteins at the cell cortex. By tuning the physical-chemical properties of XopR-complex coacervates, XopR progressively manipulates multiple steps of actin assembly, including formin-mediated nucleation, crosslinking of F-actin, and actin depolymerization, which occurs through competition for actin-depolymerizing factor and depends on constituent stoichiometry. Our findings unravel a sophisticated strategy in which bacterial T3E subverts the host actin cytoskeleton via protein complex coacervation.


Conflict of interest statement

The authors declare no competing interests.

Figures

Fig. 1
Fig. 1. T3E XopR remodels the Arabidopsis actin cytoskeleton during Xcc infection.
a, b Representative images of XopR-GFP (self-complementing) at different time points and quantification (n = 20) after infection. The red arrow indicates weak signal accumulation on the plasma membrane. Data were presented as mean values ± SD. ce Representative images of Lifeact-Venus in epidermal cells of Arabidopsis cotyledons and image quantification. Seven-day-old seedlings were dip-inoculated with WT Xcc and XccΔxopR. Images were taken at 0, 6, 12, and 24 h postinoculation (hpi). The average signal intensity per image and skewness of Lifeact-Venus were measured (n = 50 images from ten individual seedlings). Data were presented as mean values ± SD. f, g Representative images and actin density analysis of Lifeact-venus in LatB washout assay. Seven-day-old seedlings were flood-inoculated with Xcc or XccΔXopR at the indicated hpi, then subjected to 5 μM LatB treatment for 30 min before washout and image acquisition at the indicated time points of post-LatB washout (PLW). Percent occupancy was measured in the LatB washout assay (g, n = 20, from five seedlings). Data were presented as mean values ± SD. Two-tailed Student’s t-test was performed assuming equal variance. Ns no significant difference, *p < 0.05, **p < 0.01, ***p < 0.001, ****p < 0.0001. AU arbitrary unit. Scale bar: 20 μm in a 5 μm in zoomed-in image of a, 10 μm in c, and 5 μm in f.
Fig. 2
Fig. 2. Biochemical and biophysical characterizations of XopR LLPS.
a Schematic diagram of the domains and charge pattern of XopR. IDR (upper panel) and charged residues (bottom panel) were analyzed by IUPRED2 and CIDER, respectively. b Representative SPR sensorgram of the XopR–XopR interaction. XopR at concentrations of 11 μM to 43 nM flowed over the chip with immobilized XopR. Binding parameters were generated using bivalent model. c Size exclusion chromatography of XopR at the indicated concentration of NaCl solution using Superdex 200 GL 10/300 Increase. The green dashed curve represents the elution profile of standard protein markers. d Liquid-liquid phase separation (LLPS) of XopR. XopR (10 μM, 10% XopR-mRuby2) was prepared in 50 mM NaCl solution, pH = 7.4, for 10 min before imaging. e XopR phase diagram was generated using ten images for each condition. Turbidity tests of XopR in solution are shown at the indicated NaCl concentration. f Typical force-distance profiles measured during approaching (open symbols) and separation (solid symbols) of the mica surfaces with an injected mixture of XopR coacervate as a function of the concentration of NaCl. g Representative SPR sensorgrams for XopR (on-chip) and AtFH1-FH1C, which were injected at concentrations of 20 μM to 39 nM. Binding parameters were generated using bivalent model. h Complex coacervation of XopR-AtFH1-FH1C in the low salt buffer (20 mM HEPES, 50 mM NaCl, pH = 7.4) and physiological buffer (20 mM HEPES, 150 mM NaCl, pH = 7.4). XopR (5 μM, 10% XopR-mRuby2) and AtFH1-FH1C (5 μM, 10% Alexa647-AtFH1-FH1C) were mixed for 10 min before imaging. i Effective interfacial energy of coacervates of XopR (10 μM), XopR-ScGFP (10 μM XopR + 10 μM ScGFP), and XopR-AtFH1-FH1C (10 μM XopR + 5 μM AtFH1-FH1C), as a function of NaCl concentration. Each of the effective surface energy values is averaged from three measurements.Scale bar: 10 μm in d, 1 µM for magnified images in d, and 10 μm in h.
Fig. 3
Fig. 3. XopR clusters Arabidopsis formin in vivo and in vitro.
a Representative images of the AtFH6-GFP clusters and moving trajectories in Arabidopsis. Seven-day-old seedlings were dip-inoculated with Xcc/XccΔhrcC/XccΔxopR for 24 h before imaging using VA-TIRFM. be Distributions of signal intensity (from left to right, n = 454, n = 406, n = 650, and n = 636 punctates), mean square displacement (MSD) and diffusion coefficient (n = 0 movies from six seedlings for each infection assay), and percentage distribution of the bleaching step (n = 165 punctates for mock, n = 167 for Xcc, n = 165 for XccΔhrcC, and n = 164 for XccΔxopR) were analyzed for AtFH6-GFP foci. The relative ratios of total bleaching steps are indicated in brackets, which were normalized by mock without Xcc. Error bands and error bars in Fig. 3c, d are ± SD. Whiskers represent min to max. f Representative dual-color TIRF images of 2.5 nM AtFH1-FH1C (10% Alexa647-AtFH1-FH1C) with 2.5 nM XopR (10% XopR-mRuby2) on an immobilized supported lipid bilayer (SLB). g Signal intensity quantification of AtFH1-FH1C (50% Alexa647 labeled) on SLB for Supplementary Fig. 5g (n = 250 particles, Error bar, SD). h Representative dual-color confocal images of AtFH1-FH1C (5 μM, 10% Alexa647-AtFH1-FH1C) with XopR (5 μM, 10% Alexa488-XopR) that were incubated on dynamic SLB with 50 mM NaCl for 15 min before imaging. i Actin polymerization rate in the pyrene–actin assay, which was normalized by spontaneous actin polymerization, in the presence of 100 nM AtFH1-FH1C and XopR (left to right, 0, 25, 50, 100, 200, 400, and 1600 nM) at the indicated stoichiometries in the presence of 5 μM profilin AtPRF1 (n = 4 for 0, 25, 50, 100, 200 nM, n = 6 for 400 nM, and n = 7 for 1600 nM; Error bar, SD). Scale bar: 2 μm for a, 10 μm for bf, 2 μm for magnified images in f, 10 μm for h. Two-tailed Student’s t-test was performed assuming equal variance. Ns no significant difference, *p < 0.05, **p < 0.01, ***p < 0.001, ****p < 0.0001.
Fig. 4
Fig. 4. XopR modulates AtFH1-mediated actin nucleation in the TIRF-actin assembly assay.
a Representative time-lapse images from TIRFM where 0.5 μM G-actin (10% Oregon-actin) was incubated with 2 μM AtPRF1 and polymerized in the presence of the indicated concentrations of AtFH1-FH1C and XopR. b Actin seed number quantification in the area of 22 × 22 μm2 from a (n = 6, Error bar, SD). c Normalized actin seed increasing rate calculated from b (n = 6, Error bar, SD). Scale bar = 5 μm for a. d Representative images from TIRFM experiments where 0.5 μM G-actin (10% Oregon-actin) was polymerized in the presence of the indicated concentration of XopR for 300 s. e Quantification of actin seed number in the area of 22 × 22 μm2 from d (n = 10, Error bar, SD). Scale bar: 5 μm for a and d. Two-tailed Student’s t-test was performed assuming equal variance. Ns no significant difference, *p < 0.05, **p < 0.01, ***p < 0.001, ****p < 0.0001.
Fig. 5
Fig. 5. Binding and bundling of F-actin by XopR.
a Schematic domain illustration of four XopR truncation variants, EHWH2, HH, WH2, and WH2α. b MST binding curves of LatB-G-actin titrated with different XopR peptides with three biological replicates each. n = 3; Error bar, SD. c High-speed F-actin cosedimentation assay using MBP-EHWH2-msfGFP, MBP-HH-msfGFP, MBP-WH2-msfGFP, and MBP-WH2α-msfGFP. The data were fit using a Hill equation. d Negative stain electron microscopy (EM) of F-actin bundles formed by mixing 1 μM XopR with 0.2 μM F-actin in 150 mM NaCl. Scale bar from left to right: 400, 50, and 50 nm. e Micrographs of 0.2 μM F-actin in the presence of 10 μM XopR and XopRΔHH in the indicated NaCl buffer. F-actin was labeled with Acti-stain™ phalloidin. Scale bar = 5 μm. f Low-speed F-actin cosedimentation assay with XopR and XopRΔHH in the buffer with both 150 and 200 mM NaCl. g Low-speed cosedimentation assay of XopR full-length, XopR-IDR and XopR-Cter in 150 mM NaCl solution (n = 3 biological replicates). Data were presented as mean values ± SD. The data were fit using a Hill equation. h Representative time-lapse images of TIRF-actin polymerization over 480 s with 0.5 μM G-actin (10% Oregon-actin), 100 nM AtFH1-FH1C, and 400 nM XopR under 50 mM NaCl conditions. Scale bar = 2 μm for f.
Fig. 6
Fig. 6. XopR inhibits ADF-mediated actin depolymerization through direct competition.
a Representative time-lapse TIRF images of F-actin depolymerization. To obtain these images, 100 nM XopR, 100 nM XopRΔCC, 0.2 μM AtADF3, and 20 μM CC peptide were used. b Mean fluorescence intensity of F-actin of a (n = 6, data were presented as mean values with error bands which represent SD). c Representative images of Lifeact-Venus in epidermal cells of WT Arabidopsis cotyledons. Seven-day-old seedlings were flood-inoculated with Xcc or XccΔxopR, and then treated with 1 μM actin LatB for 1 h after 24 hpi. Scale bar = 10 μm. d F-actin density quantification in c (n = 50 images from five individual seedlings (Data were presented as mean values ± SD). e Representative images of Lifeact-Venus in epidermal cells of Arabidopsis cotyledons expressing XVE-XopR. The expression of XopR was first induced for 24 h using 10 μM β−estradiol before being subjected to 1 μM LatB treatment for 1 h before imaging. Scale bar = 5 μm for a, Scale bar = 10 μm for c, e. Two-tailed Student’s t-test was performed assuming equal variance. Ns no significant difference, *p < 0.05, **p < 0.01, ***p < 0.001, ****p < 0.0001.
Fig. 7
Fig. 7. Remodeling of Arabidopsis actin by XopR during Xcc infection.
Schematic illustration of the molecular mechanisms by which bacterial effector XopR progressively hijacks plant host actin assembly. Using a type III secretion system, XopR stepwise manipulates different steps of host actin assembly, including activating formin-mediated nucleation at the early stage of infection and then stabilizing actin cytoskeleton at the later stage by crosslinking of F-actin and inhibiting actin depolymerization with a high protein level of XopR in the host.

References

    1. Marin M, Ott T. Intrinsic disorder in plant proteins and phytopathogenic bacterial effectors. Chem. Rev. 2014;114:6912–6932. doi: 10.1021/cr400488d. - DOI - PubMed
    1. Deslandes L, Rivas S. Catch me if you can: bacterial effectors and plant targets. Trends Plant Sci. 2012;17:644–655. doi: 10.1016/j.tplants.2012.06.011. - DOI - PubMed
    1. Macho AP. Subversion of plant cellular functions by bacterial type-III effectors: beyond suppression of immunity. N. Phytol. 2016;210:51–57. doi: 10.1111/nph.13605. - DOI - PubMed
    1. van der Hoorn RA, Kamoun S. From guard to decoy: a new model for perception of plant pathogen effectors. Plant Cell. 2008;20:2009–2017. doi: 10.1105/tpc.108.060194. - DOI - PMC - PubMed
    1. Stebbins CE, Galan JE. Maintenance of an unfolded polypeptide by a cognate chaperone in bacterial type III secretion. Nature. 2001;414:77–81. doi: 10.1038/35102073. - DOI - PubMed

Publication types

Substances