. 2021 Jul 1;11(1):13657.
doi: 10.1038/s41598-021-92621-1.

A Bayesian approach to extracting free-energy profiles from cryo-electron microscopy experiments

Affiliations

A Bayesian approach to extracting free-energy profiles from cryo-electron microscopy experiments

Julian Giraldo-Barreto et al. Sci Rep. .

Abstract

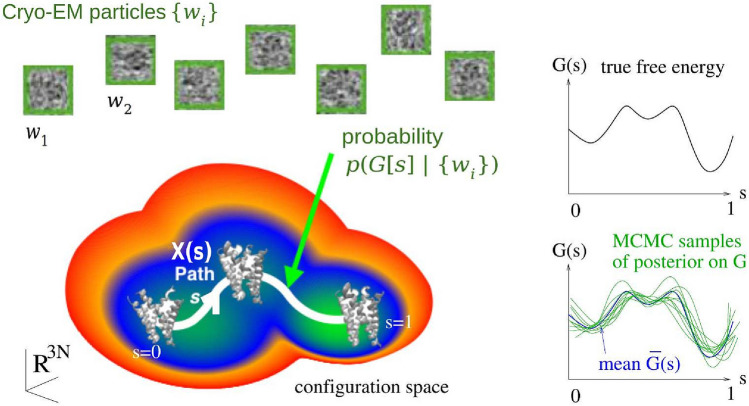
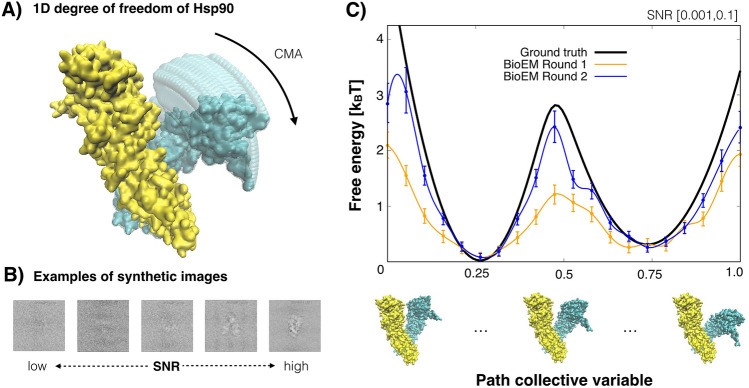
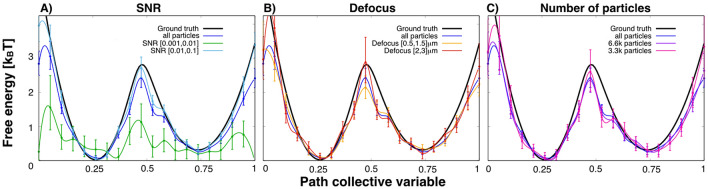
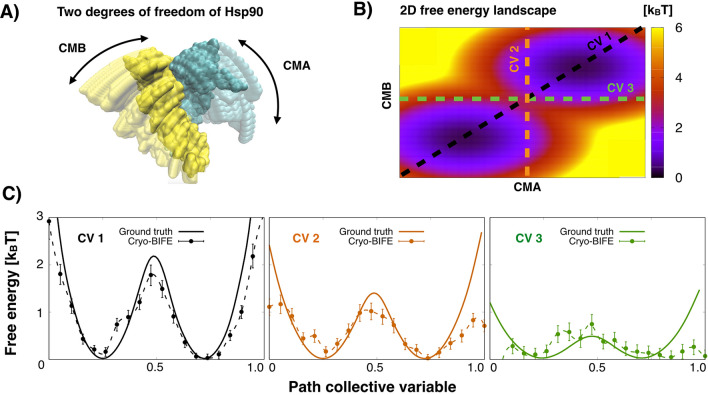
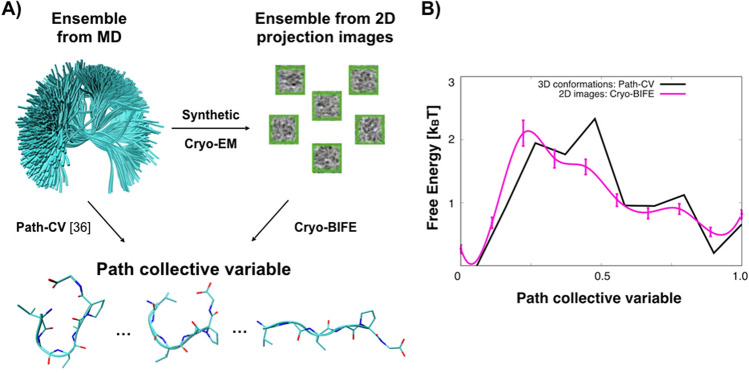
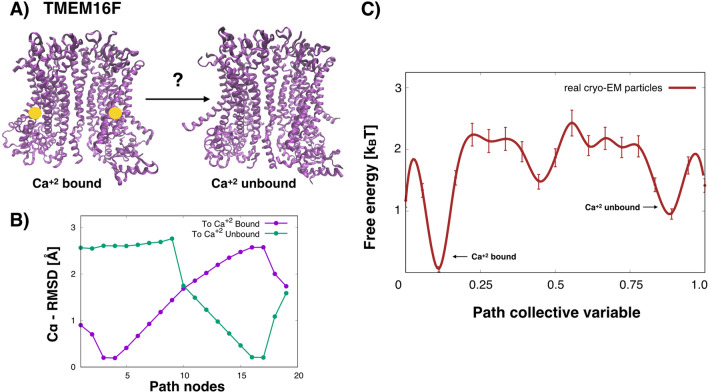
Cryo-electron microscopy (cryo-EM) extracts single-particle density projections of individual biomolecules. Although cryo-EM is widely used for 3D reconstruction, due to its single-particle nature it has the potential to provide information about a biomolecule's conformational variability and underlying free-energy landscape. However, treating cryo-EM as a single-molecule technique is challenging because of the low signal-to-noise ratio (SNR) in individual particles. In this work, we propose the cryo-BIFE method (cryo-EM Bayesian Inference of Free-Energy profiles), which uses a path collective variable to extract free-energy profiles and their uncertainties from cryo-EM images. We test the framework on several synthetic systems where the imaging parameters and conditions were controlled. We found that for realistic cryo-EM environments and relevant biomolecular systems, it is possible to recover the underlying free energy, with the pose accuracy and SNR as crucial determinants. We then use the method to study the conformational transitions of a calcium-activated channel with real cryo-EM particles. Interestingly, we recover not only the most probable conformation (used to generate a high-resolution reconstruction of the calcium-bound state) but also a metastable state that corresponds to the calcium-unbound conformation. As expected for turnover transitions within the same sample, the activation barriers are on the order of [Formula: see text]. We expect our tool for extracting free-energy profiles from cryo-EM images to enable more complete characterization of the thermodynamic ensemble of biomolecules.


Conflict of interest statement

The authors declare no competing interests.

Figures

Figure 1
Figure 1
Schematic representation of the path collective variable and Bayesian formalism for cryo-BIFE. The main goal of our methodology is to determine the posterior probability distribution of free-energy profiles G(s) over a given configuration space path X(s), given a set of noisy cryo-EM particle (projection) images w={wi} from i=1,,I. The green graphs on the right show independent samples drawn from this posterior, and the blue curve their mean. The black curve represents the true free-energy profile. Variation between sampled free energy surfaces arises from a detailed Bayesian model of imaging noise. The path 0s1 is discretized using M nodes.
Figure 2
Figure 2
1D analysis of Hsp90. (A) Movement of Hsp90 along the single degree of freedom (CMA). The rotation of chain A relative to a fixed chain B. (B) Examples of the synthetic images with varying SNR between [0.001, 0.1]. (C) Free-energy profiles along the path for the entire set of images recovered from cryo-BIFE. The ground truth free-energy profile is shown in black. The expected free energy profile using cryo-BIFE is shown for BioEM orientation rounds 1 and 2 in orange and blue, respectively. The R-hat test for the MCMC stationarity yielded 1.000 and 1.001 for BioEM round 1 and 2, respectively. The bars show the credible interval at 5% and 95% of the empirical quantile at each node. A cubic spline is used to fit the expected free-energy profile, providing a smooth profile.
Figure 3
Figure 3
Free-energy profile recovery for different cryo-EM conditions. (A) Particles grouped by SNR from [0.01,0.1] (cyan) and from [0.001, 0.01] (green). Each subset contained around 6600 particles. (B) Particles grouped by defocus. Sets with small defocus [0.5, 1.5] μm (orange) and large defocus [2, 3] μm (red). Each subset contained around 5300 particles. (C) Particle subsets with a different number of particles: 3300 (pink) and 6600 (purple). For reference, the ground truth and expected free-energy profiles using all particles are shown in black and blue, respectively. The R-hat test for the MCMC yielded values <1.01 for all cases. The bars show the credible interval at 5% and 95% of the empirical quantile at each node. The results are for the second BioEM round of orientation estimate.
Figure 4
Figure 4
2D analysis of Hsp90. (A) Two degrees of freedom of Hsp90 along the CMA and CMB rotation directions (see the Methods). (B) Ground truth free-energy surface along CMA and CMB directions. Black (CV1), orange (CV2) and green (CV3) dashed lines show three paths used for the cryo-BIFE analysis. (C) The free-energy profiles along these three path CVs, extracted with cryo-BIFE using synthetic particle images (dashed lines), are compared to the ground truth projected profiles (solid lines). The R-hat test for the MCMC yielded values <1.003 for all cases. The bars show the credible interval at 5% and 95% of the empirical quantile at each node. The results are for the second BioEM round of orientation estimate.
Figure 5
Figure 5
Free-energy profiles from 2D images (cryo-BIFE) or 3D conformations of the VGVAPG hexapeptide. (A) The conformational ensemble of the VGVAPG hexapeptide from MD simulations is used to generate synthetic images. The nodes belonging to the path (bottom) are selected with equally spaced end-to-end distances between successive nodes (see the Methods). The path-CV method compares 3D conformations to the path nodes, whereas cryo-BIFE compares 2D particle images to the same nodes. (B) Free-energy profile calculated over the 3D ensemble using the path-CV with RMSD metric [Eq. (8) in Ref.] with λ=50 Å –2 (black), and the expected free energy G¯(s) extracted using cryo-BIFE with synthetic cryo-EM particles (pink line). The R-hat test for the MCMC yielded values <1.01 for all cases. The bars show the credible interval at 5% and 95% of the empirical quantile at each node. See the Methods for details about the path and set of images for each system.
Figure 6
Figure 6
Real cryo-EM data for studying the TMEM16F Ca+2—bound/unbound transition with cryo-BIFE. (A) Ca+2-bound to the Ca+2-unbound states of TMEM16F (with PDB codes 6p46 and 6p47, respectively). (B) Cα RMSD of the nodes along the path to the Ca+2-bound and Ca+2-unbound states (purple and green, respectively). (C) Free-energy profile extracted along the path CV from real cryo-EM particles from the dataset used to generate the Ca+2-bound reconstruction in digitonin (EMPIAR code 10278). The R-hat test for the MCMC yielded 1.001. The bars show the credible interval at 5% and 95% of the empirical quantile at each node. Arrows point to the free-energy basins corresponding to the Ca+2-bound/unbound states.

References

    1. McMullan G, Faruqi AR, Henderson R. Direct electron detectors. Methods Enzymol. 2016;587:1–17. doi: 10.1016/bs.mie.2016.05.056. - DOI - PubMed
    1. Cossio P, Hummer G. Likelihood-based structural analysis of electron microscopy images. Curr. Opin. Struct. Biol. 2018;49:162–168. doi: 10.1016/j.sbi.2018.03.004. - DOI - PubMed
    1. Cheng Y, Grigorieff N, Penczek PA, Walz T. A primer to single-particle cryo-electron microscopy. Cell. 2015 doi: 10.1016/j.cell.2015.03.050. - DOI - PMC - PubMed
    1. Yip KM, Fischer N, Paknia E, Chari A, Stark H. Breaking the next Cryo-EM resolution barrier Atomic resolution determination of proteins! bioRxiv. 2020 doi: 10.1101/2020.05.21.106740. - DOI - PubMed
    1. Nakane T, et al. Single-particle cryo-EM at atomic resolution. Nature. 2020;587:152–156. doi: 10.1038/s41586-020-2829-0. - DOI - PMC - PubMed

Publication types