. 2021 Dec;5(12):1717-1730.
doi: 10.1038/s41562-021-01135-3. Epub 2021 Jul 1.

Identification of 371 genetic variants for age at first sex and birth linked to externalising behaviour

Collaborators, Affiliations

Identification of 371 genetic variants for age at first sex and birth linked to externalising behaviour

Melinda C Mills et al. Nat Hum Behav. 2021 Dec.

Erratum in

Abstract

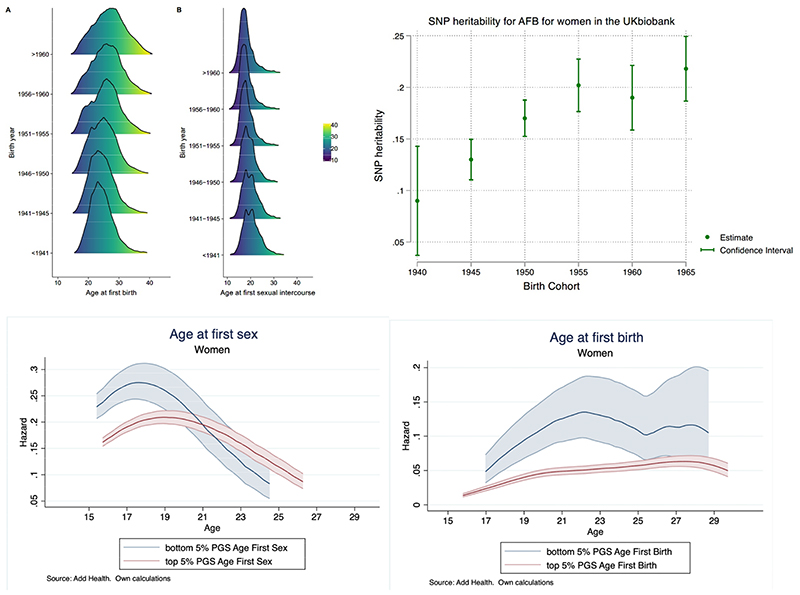
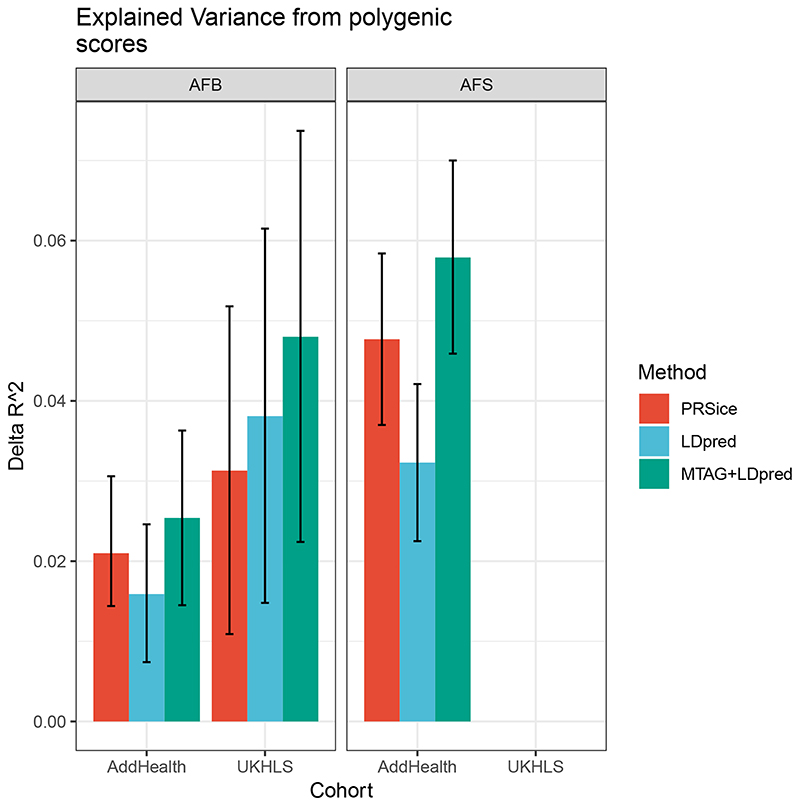
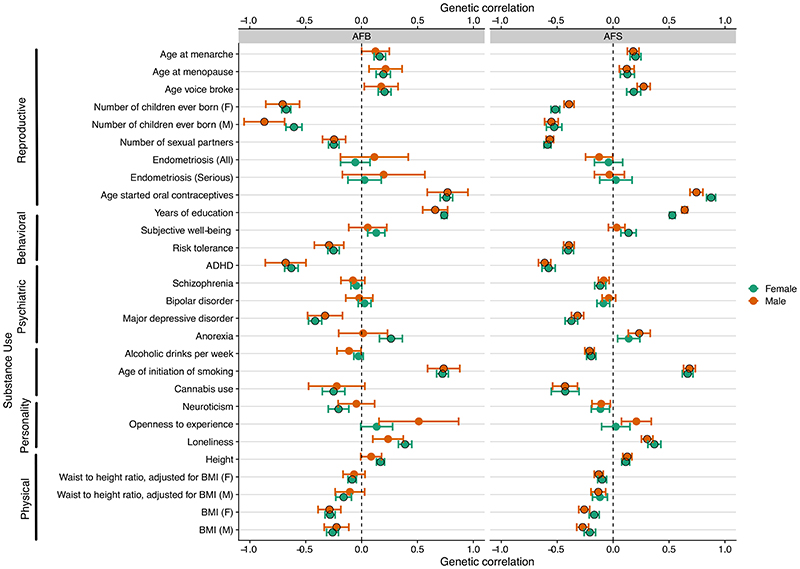
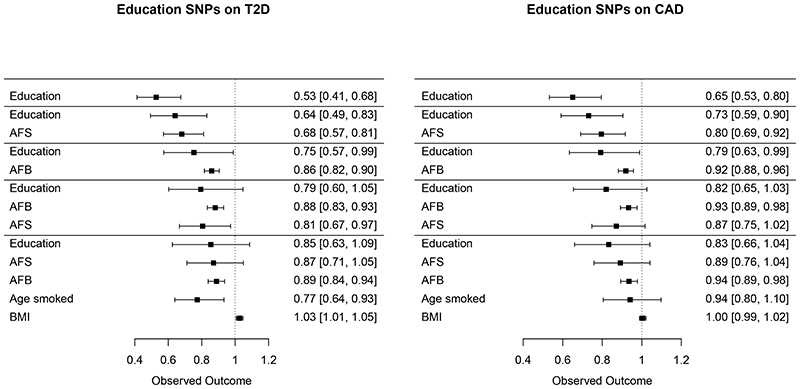
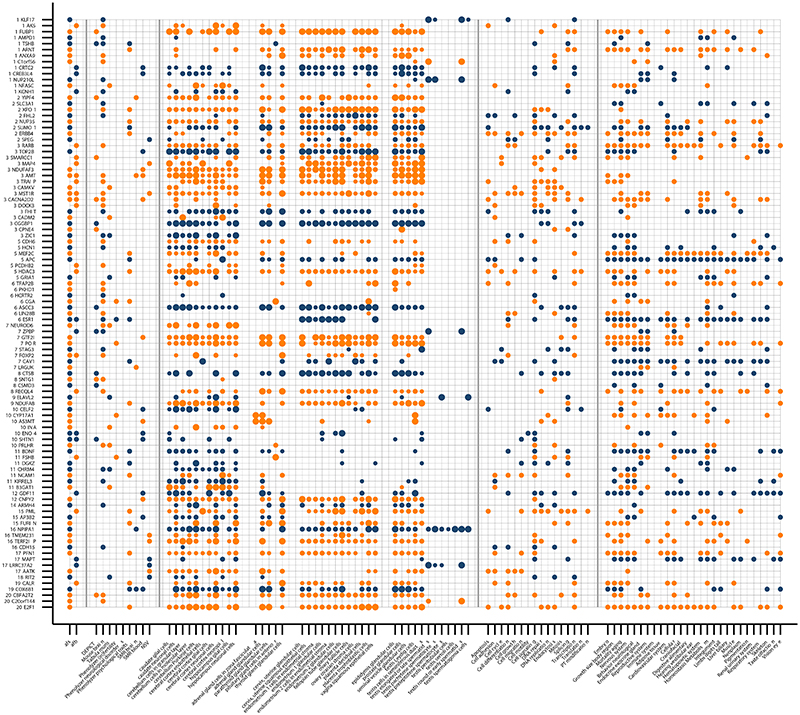
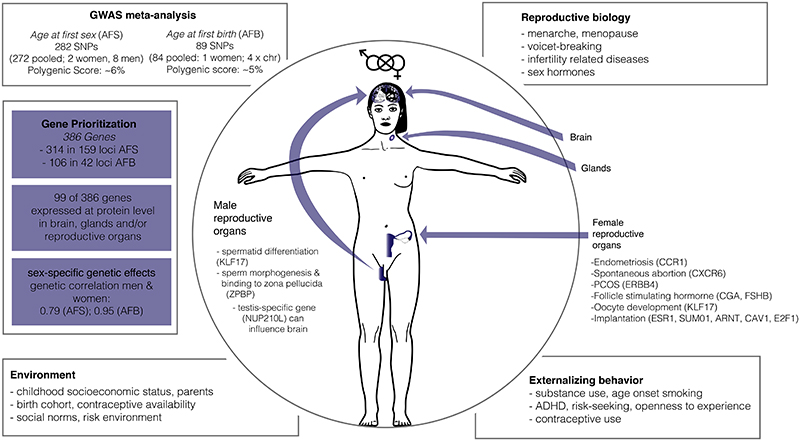
Age at first sexual intercourse and age at first birth have implications for health and evolutionary fitness. In this genome-wide association study (age at first sexual intercourse, N = 387,338; age at first birth, N = 542,901), we identify 371 single-nucleotide polymorphisms, 11 sex-specific, with a 5-6% polygenic score prediction. Heritability of age at first birth shifted from 9% [CI = 4-14%] for women born in 1940 to 22% [CI = 19-25%] for those born in 1965. Signals are driven by the genetics of reproductive biology and externalising behaviour, with key genes related to follicle stimulating hormone (FSHB), implantation (ESR1), infertility and spermatid differentiation. Our findings suggest that polycystic ovarian syndrome may lead to later age at first birth, linking with infertility. Late age at first birth is associated with parental longevity and reduced incidence of type 2 diabetes and cardiovascular disease. Higher childhood socioeconomic circumstances and those in the highest polygenic score decile (90%+) experience markedly later reproductive onset. Results are relevant for improving teenage and late-life health, understanding longevity and guiding experimentation into mechanisms of infertility.


Conflict of interest statement

Competing interests

The main authors declare no competing interests. The views expressed in this article are those of the author(s) and not necessarily those of the NHS, the NIHR, or the Department of Health. MMcC (Mark McCarthy) has served on advisory panels for Pfizer, NovoNordisk and Zoe Global, has received honoraria from Merck, Pfizer, Novo Nordisk and Eli Lilly, and research funding from Abbvie, Astra Zeneca, Boehringer Ingelheim, Eli Lilly, Janssen, Merck, NovoNordisk, Pfizer, Roche, Sanofi Aventis, Servier, and Takeda. As of June 2019, MMcC is an employee of Genentech, and a holder of Roche stock.

Figures

Figure 1
Figure 1. Change in age at first sex (AFS) and age at first birth (AFB) over time, heritability by birth cohort and polygenic score (PGS) prediction.
(A) AFB (A) and AFS (B) by birth cohort, UK biobank shows a shift in the ages over time. (B) Increased SNP heritability for women over time by birth cohort, UK Biobank. (C) Nelson-Aalen hazard estimates of AFS by age for women comparing the upper and lower 5% of the PGS for AFS. (D) Nelson-Aalen hazard estimates of AFB by age for women comparing the upper and lower 5% of the PGS for AFB.
Figure 2
Figure 2. Variance explained from polygenic scores for age at first birth (AFB) and age at first sex (AFS) using different methods in out-of-sample cohorts
Shows the out-of-sample prediction scores for AFB and AFS performed in two cohorts: The National Longitudinal Study of Adolescence to Adult Health (Add Health) and the UK Household Longitudinal Study (UKLS). The bars represent the delta (Δ) R2, also indicating confidence intervals. R2 measures of the proportion of variance of the phenotype that is explained by the model and Δ R2 shows the change in R2 values when comparing a model without the PGS to one that includes the PGS. The different methods of PRSice, LDPred and MTAG+LDPred are described in the Supplementary Information, Section 5.
Figure 3
Figure 3. Genetic correlations of age at first birth (A) and age at first sex (B) with a selection of related traits.
The horizontal bars represent 95% confidence intervals. If the trait was initially assessed separately for males and females, this is indicated on the left in brackets with F referring to females and M to males. The black circles represent the Bonferonni significant correlations, but the magnitude of the effect (rg, the genetic correlation) is the most informative. Definitions and sources of all traits can be found in the Supplementary Information, Section 7.1 with full results shown in Supplementary Table S11.
Figure 4
Figure 4. Mendelian randomisation of years of education on type 2 diabetes (T2D) and coronary artery disease (CAD) adjusted for age at first birth (AFB) and age at first sex (AFS).
Shows the coefficients and confidence intervals (CIs) of Mendelian Randomisation analyses to examine the effects of SNPs associated with years of education on Type 2 Diabetes (T2D) and Coronary Artery Disease (CAD), after adjustment by AFB and AFS and other covariates. The association with years of education and T2D and CAD are substantially attenuated by the effects of AFB. Even when BMI is included in the model, the level of attenuation of educational attainment by AFB remains striking.
Figure 5
Figure 5. Gene prioritization of age at first sex (AFS) and age at first birth (AFB).
Information for 99 genes prioritized in loci identified by GWAS for age at first sex and/or age at first birth that are located within 1 million bp of lead SNPs and are expressed at the protein level in brain, glands and/or reproductive organs. Transitions in colour from blue to orange highlight whether the gene in the next row is still within the same locus or not. Numbers before the genes show the chr. Panels are separated by vertical grey lines. The first panel (left) indicates if the locus was identified as being associated at genome-wide significance with age at first sex (AFS) and/or age at first birth (AFB). The second panel shows which bioinformatic approaches highlighted the gene as a candidate. The third panel shows – from left to right - the cell types in brain, glands, female reproductive organs, and male reproductive organs in which the genes are expressed at a low, moderate or high level (small, medium and large circles), based on data from the Human Protein Atlas. The fourth panel shows gene functions as extracted from Entrez, Uniprot and GeneCards. The fifth panel indicates which phenotypes were observed in mutant mice, as reported by the Mouse Genome Informatics (MGI) database.
Figure 6
Figure 6. Summary genome-wide association study of timing of onset of reproductive behaviour: age at first sex (AFS) and age at first birth (AFB).
Provides a summary of the GWAS meta-analysis results and highlights that the timing of onset of reproductive behaviour is shaped by the combined effects of reproductive biology and externalizing behaviour but also exogenous environmental factors. Sex-specific genetic correlations are higher for AFB than AFS, with gene prioritization revealing some genes prioritized for men and women as well as sex-specific findings. Of the prioritized genes, 99 were expressed at the protein level in cell types of brain, glands and/or (fe)male reproductive organs. The fact that some prioritised proteins are expressed in some relevant tissues does not provide clear evidence supporting a causal role. Figure created by authors.

References

    1. Mercer CH, et al. Changes in sexual attitudes and lifestyles in Britain through the life course and over time: findings from the National Surveys of Sexual Attitudes and Lifestyles (Natsal) Lancet. 2013;382:1781–1794. - PMC - PubMed
    1. Lara LAS, Abdo CHN. Age at Time of Initial Sexual Intercourse and Health of Adolescent Girls. J Pediatr Adolesc Gynecol. 2016;29:417–423. - PubMed
    1. Polimanti R, et al. The Interplay between Risky Sexual Behaviors and Alcohol Dependence: Genome-Wide Association and Neuroimaging Support for LHPP as a Risk Gene. Neuropsychopharmacology. 2017;42:598–605. - PMC - PubMed
    1. Karlsson Linnér R, et al. Genome-wide association analyses of risk tolerance and risky behaviors in over 1 million individuals identify hundreds of loci and shared genetic influences. Nat Genet. 2019;51:245–257. - PMC - PubMed
    1. Balbo N, Billari FC, Mills M. Fertility in Advanced Societies: A Review of Research. Eur J Popul / Rev Eur Démographie. 2013;29:1–38. - PMC - PubMed

Publication types