. 2021 Jul;53(7):1006-1021.
doi: 10.1038/s41588-021-00886-z. Epub 2021 Jul 1.

Pathogenic SPTBN1 variants cause an autosomal dominant neurodevelopmental syndrome

Margot A Cousin #  1   2 Blake A Creighton #  3 Keith A Breau  3 Rebecca C Spillmann  4 Erin Torti  5 Sruthi Dontu  3 Swarnendu Tripathi  6 Deepa Ajit  3 Reginald J Edwards  3 Simone Afriyie  3 Julia C Bay  3 Kathryn M Harper  7   8 Alvaro A Beltran  9   10 Lorena J Munoz  10 Liset Falcon Rodriguez  3 Michael C Stankewich  11 Richard E Person  5 Yue Si  5 Elizabeth A Normand  5 Amy Blevins  5 Alison S May  12 Louise Bier  13 Vimla Aggarwal  13   14 Grazia M S Mancini  15 Marjon A van Slegtenhorst  15 Kirsten Cremer  16 Jessica Becker  16 Hartmut Engels  16 Stefan Aretz  16 Jennifer J MacKenzie  17 Eva Brilstra  18 Koen L I van Gassen  18 Richard H van Jaarsveld  18 Renske Oegema  18 Gretchen M Parsons  19 Paul Mark  19 Ingo Helbig  20   21   22   23 Sarah E McKeown  20   21 Robert Stratton  24 Benjamin Cogne  25   26 Bertrand Isidor  25   26 Pilar Cacheiro  27 Damian Smedley  27 Helen V Firth  28   29 Tatjana Bierhals  30 Katja Kloth  30 Deike Weiss  31 Cecilia Fairley  32 Joseph T Shieh  32   33 Amy Kritzer  34 Parul Jayakar  35 Evangeline Kurtz-Nelson  36 Raphael A Bernier  36 Tianyun Wang  37 Evan E Eichler  37   38 Ingrid M B H van de Laar  15 Allyn McConkie-Rosell  4 Marie T McDonald  4 Jennifer Kemppainen  39   40 Brendan C Lanpher  39   40 Laura E Schultz-Rogers  39   41 Lauren B Gunderson  39   40 Pavel N Pichurin  39 Grace Yoon  42 Michael Zech  43   44 Robert Jech  45 Juliane Winkelmann  43   44   46   47 Undiagnosed Diseases NetworkGenomics England Research ConsortiumAdriana S Beltran  10   48   49 Michael T Zimmermann  6   50   51 Brenda Temple  52 Sheryl S Moy  7   8 Eric W Klee  39   41   40 Queenie K-G Tan  4 Damaris N Lorenzo  53   54   55
Affiliations

Pathogenic SPTBN1 variants cause an autosomal dominant neurodevelopmental syndrome

Margot A Cousin et al. Nat Genet. 2021 Jul.

Abstract

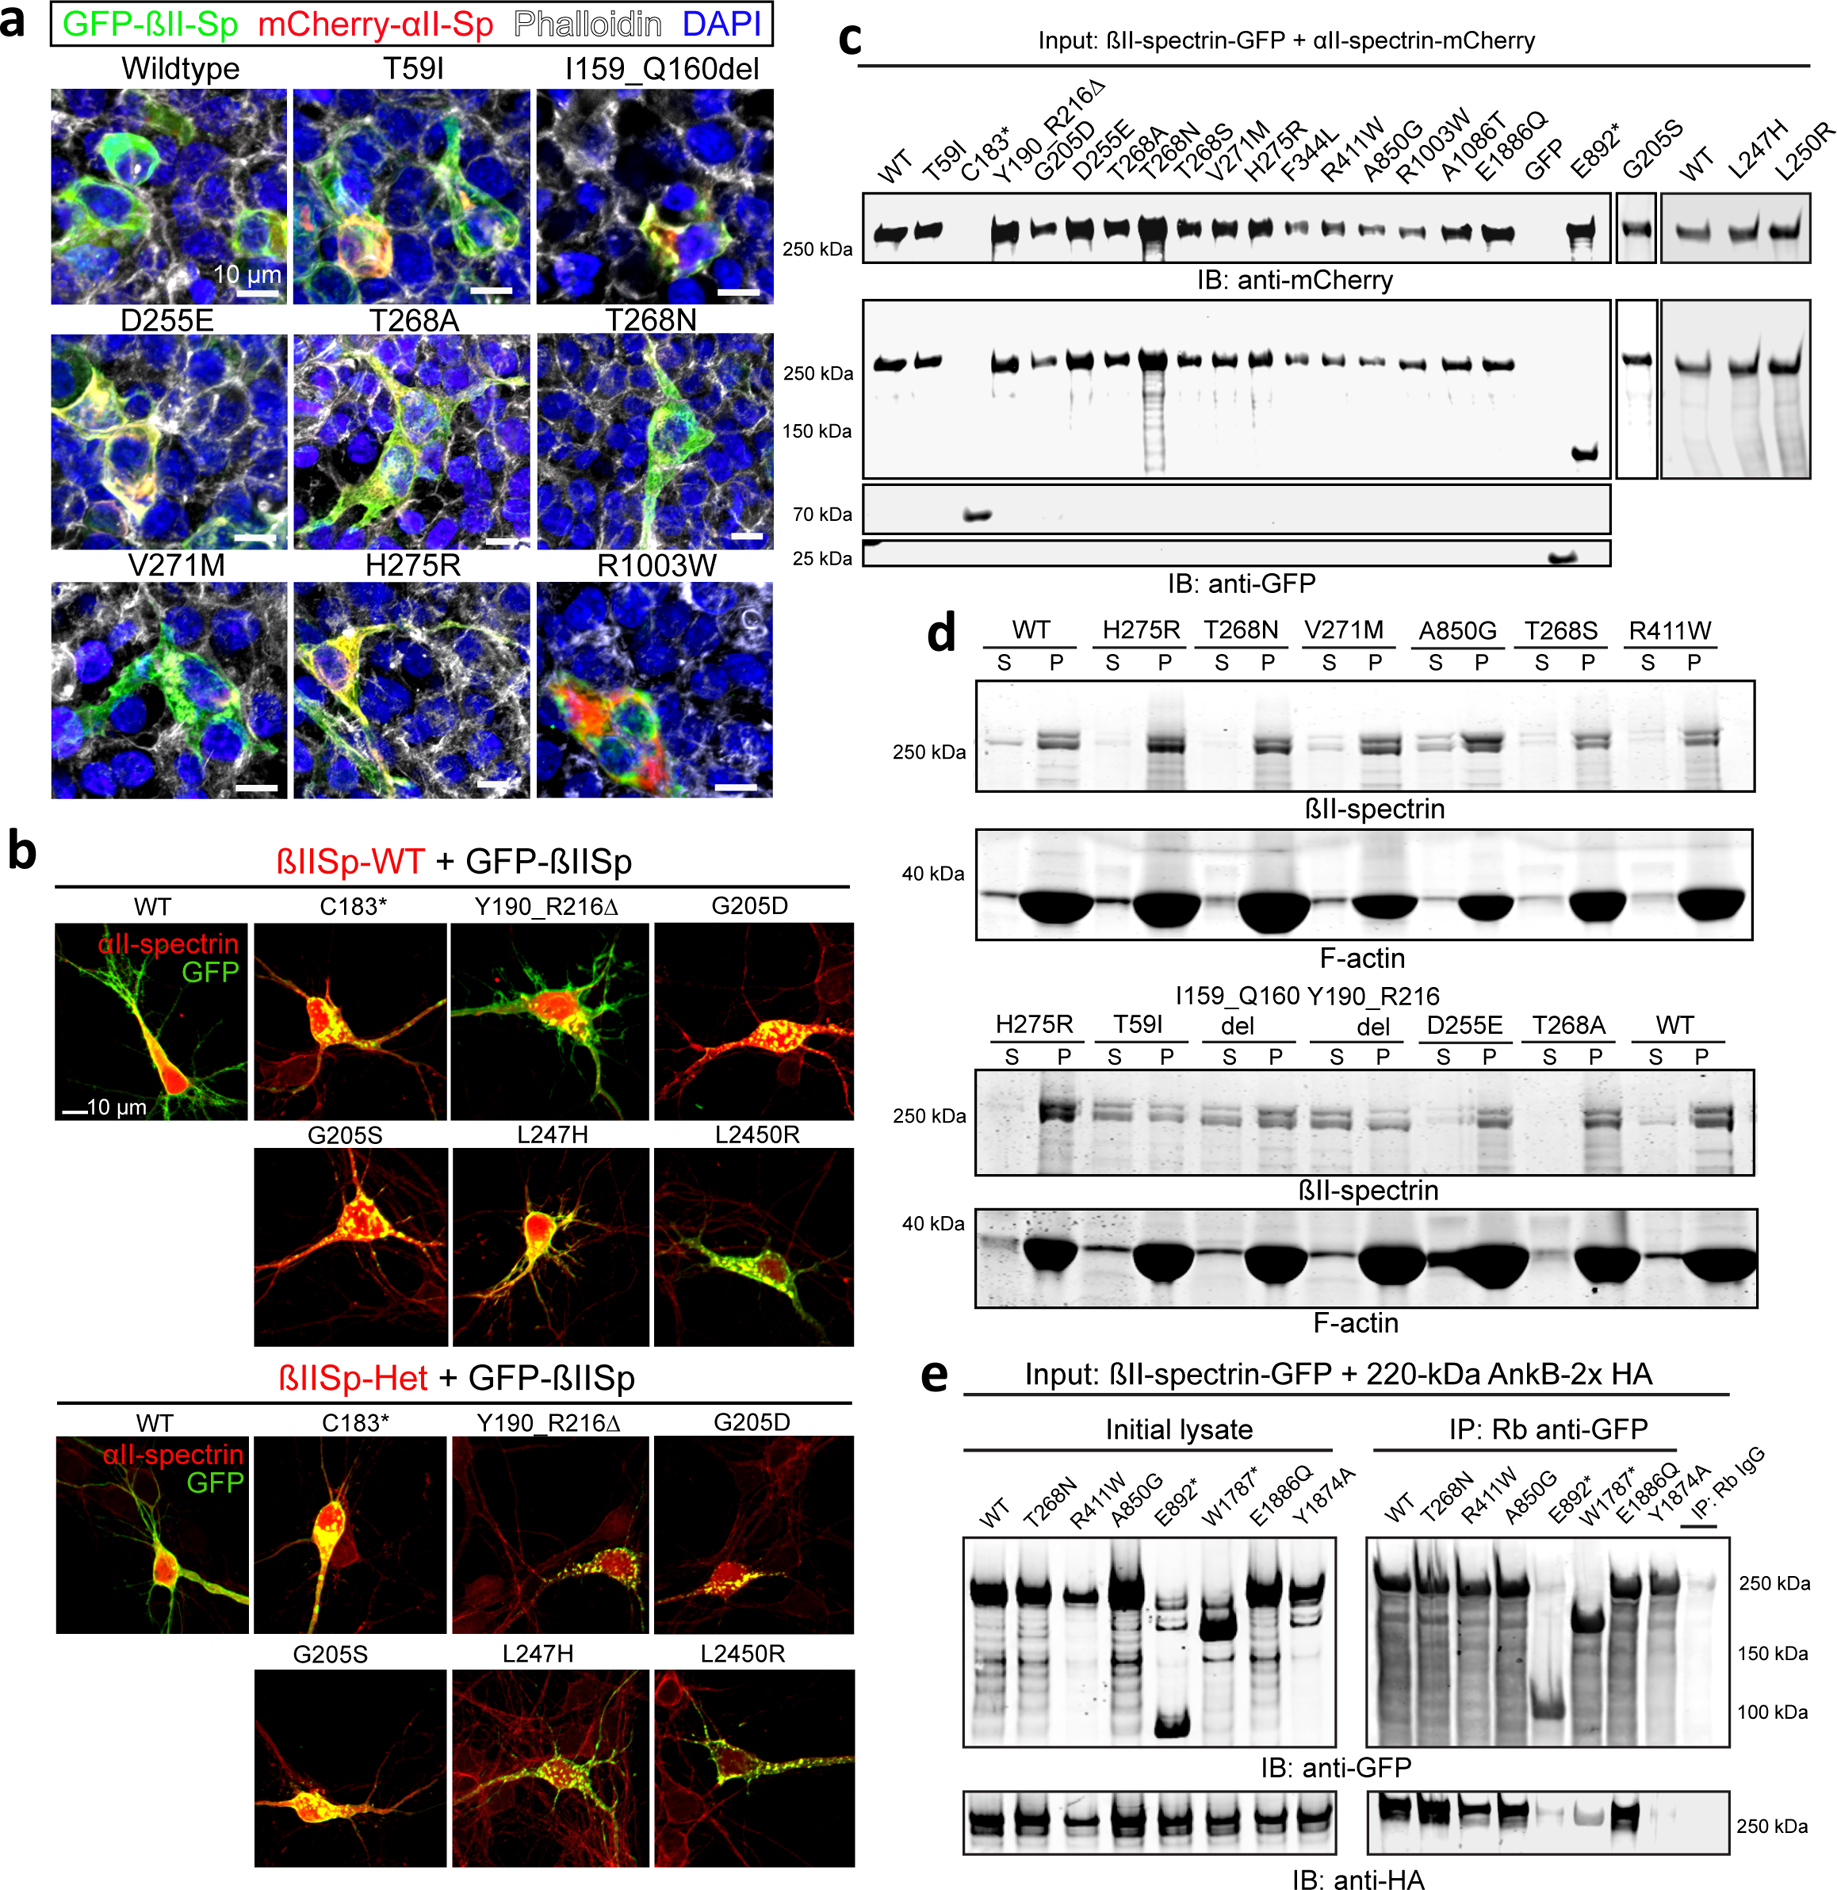
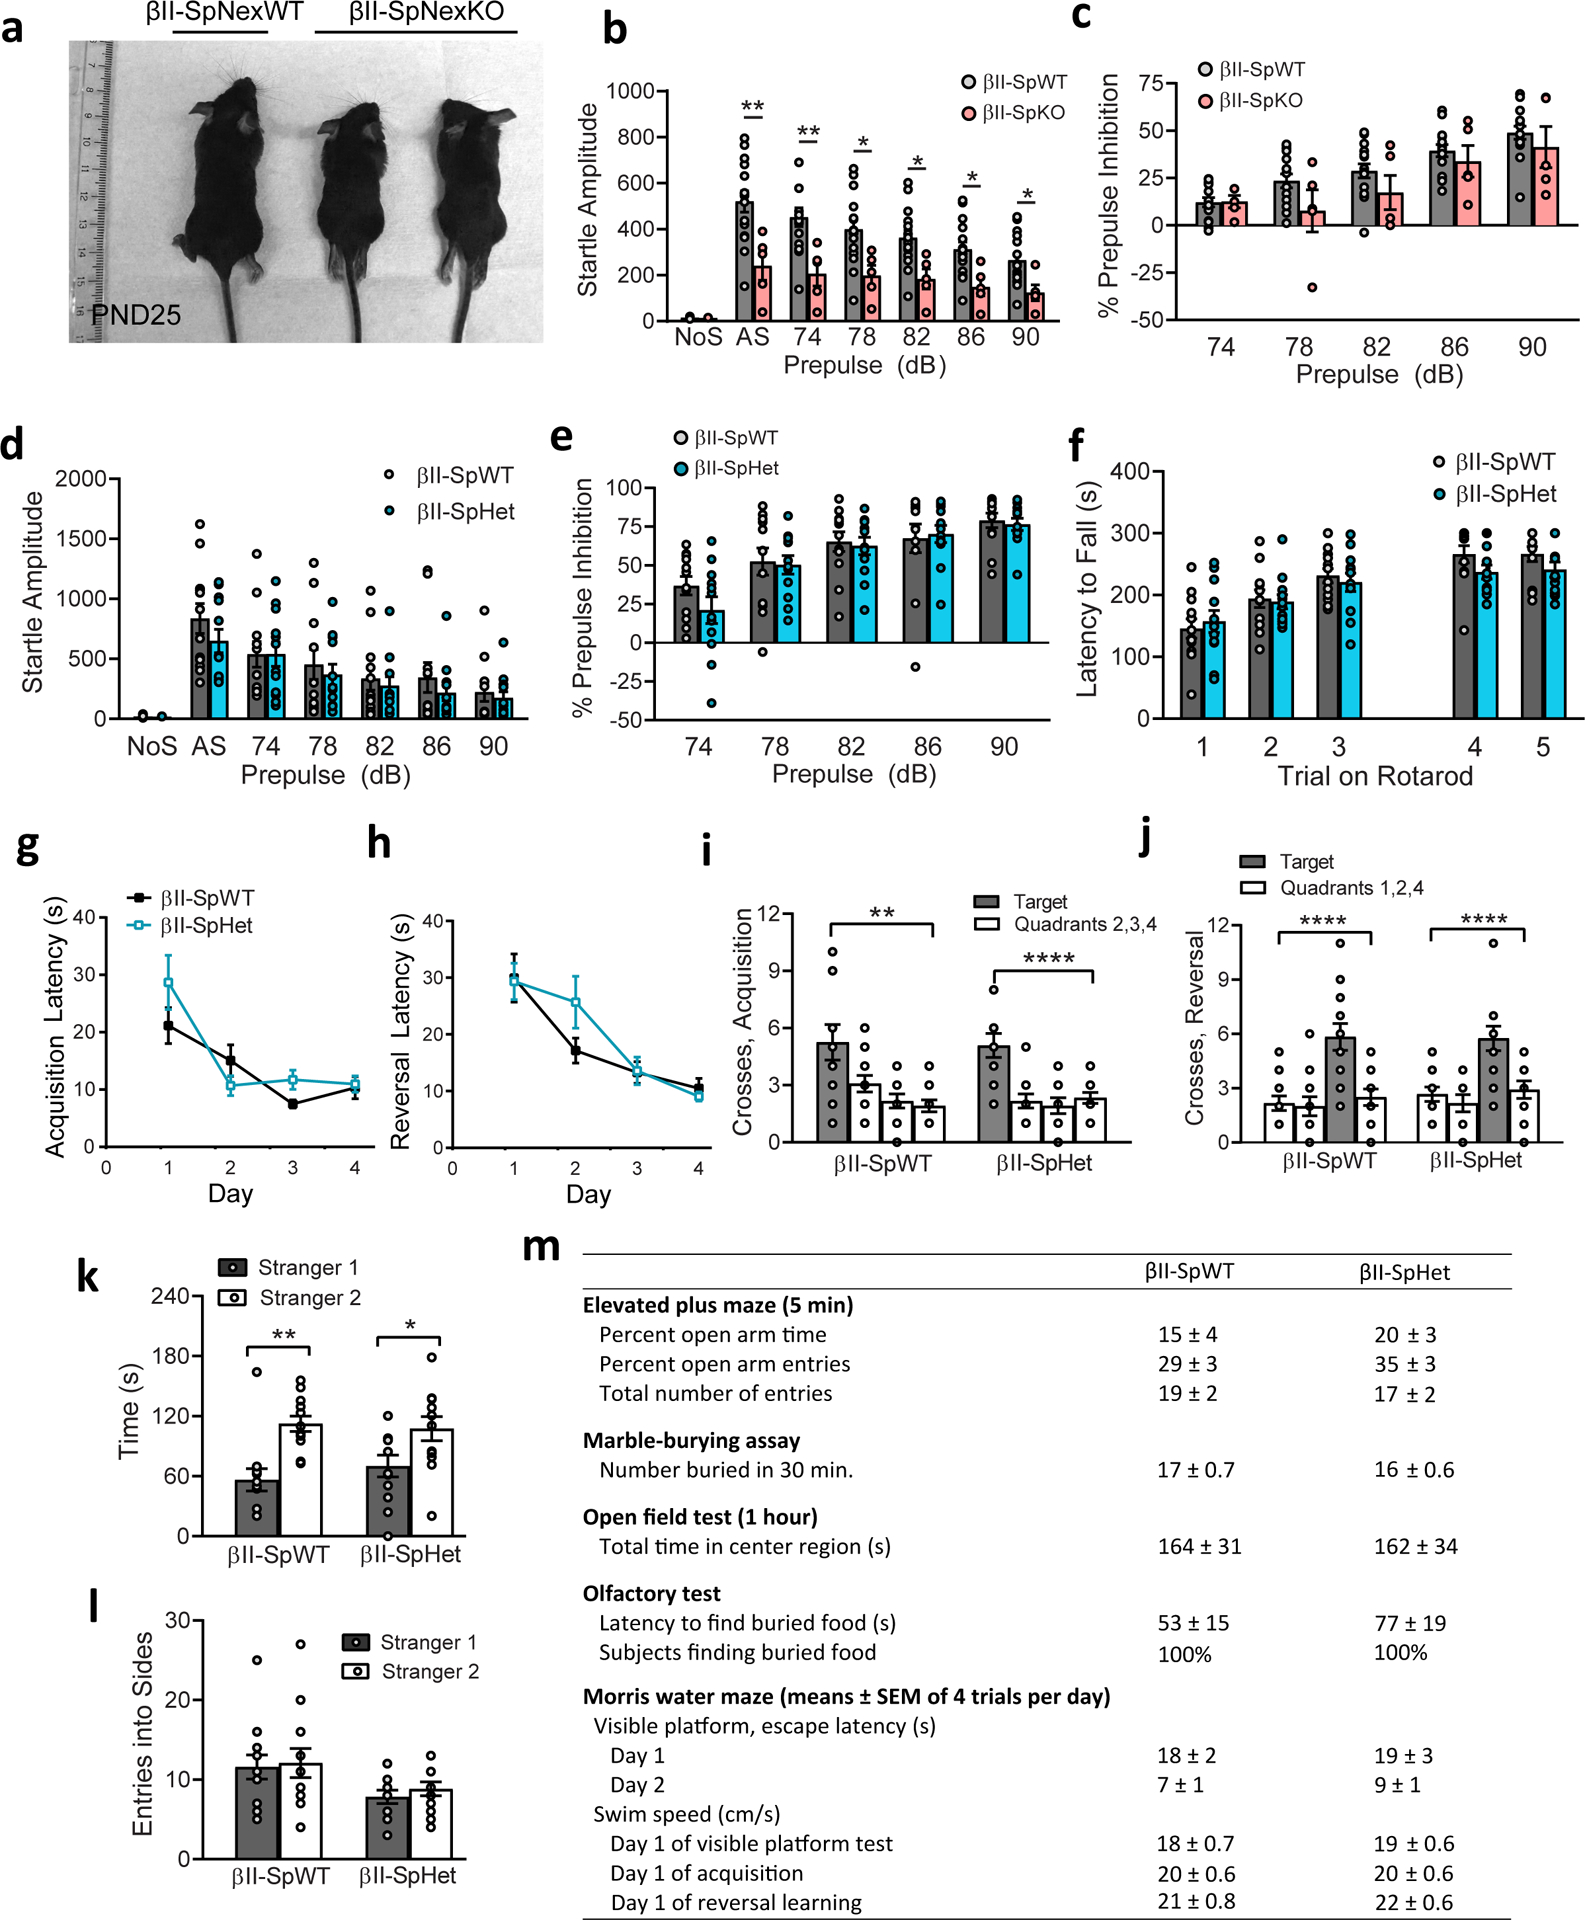
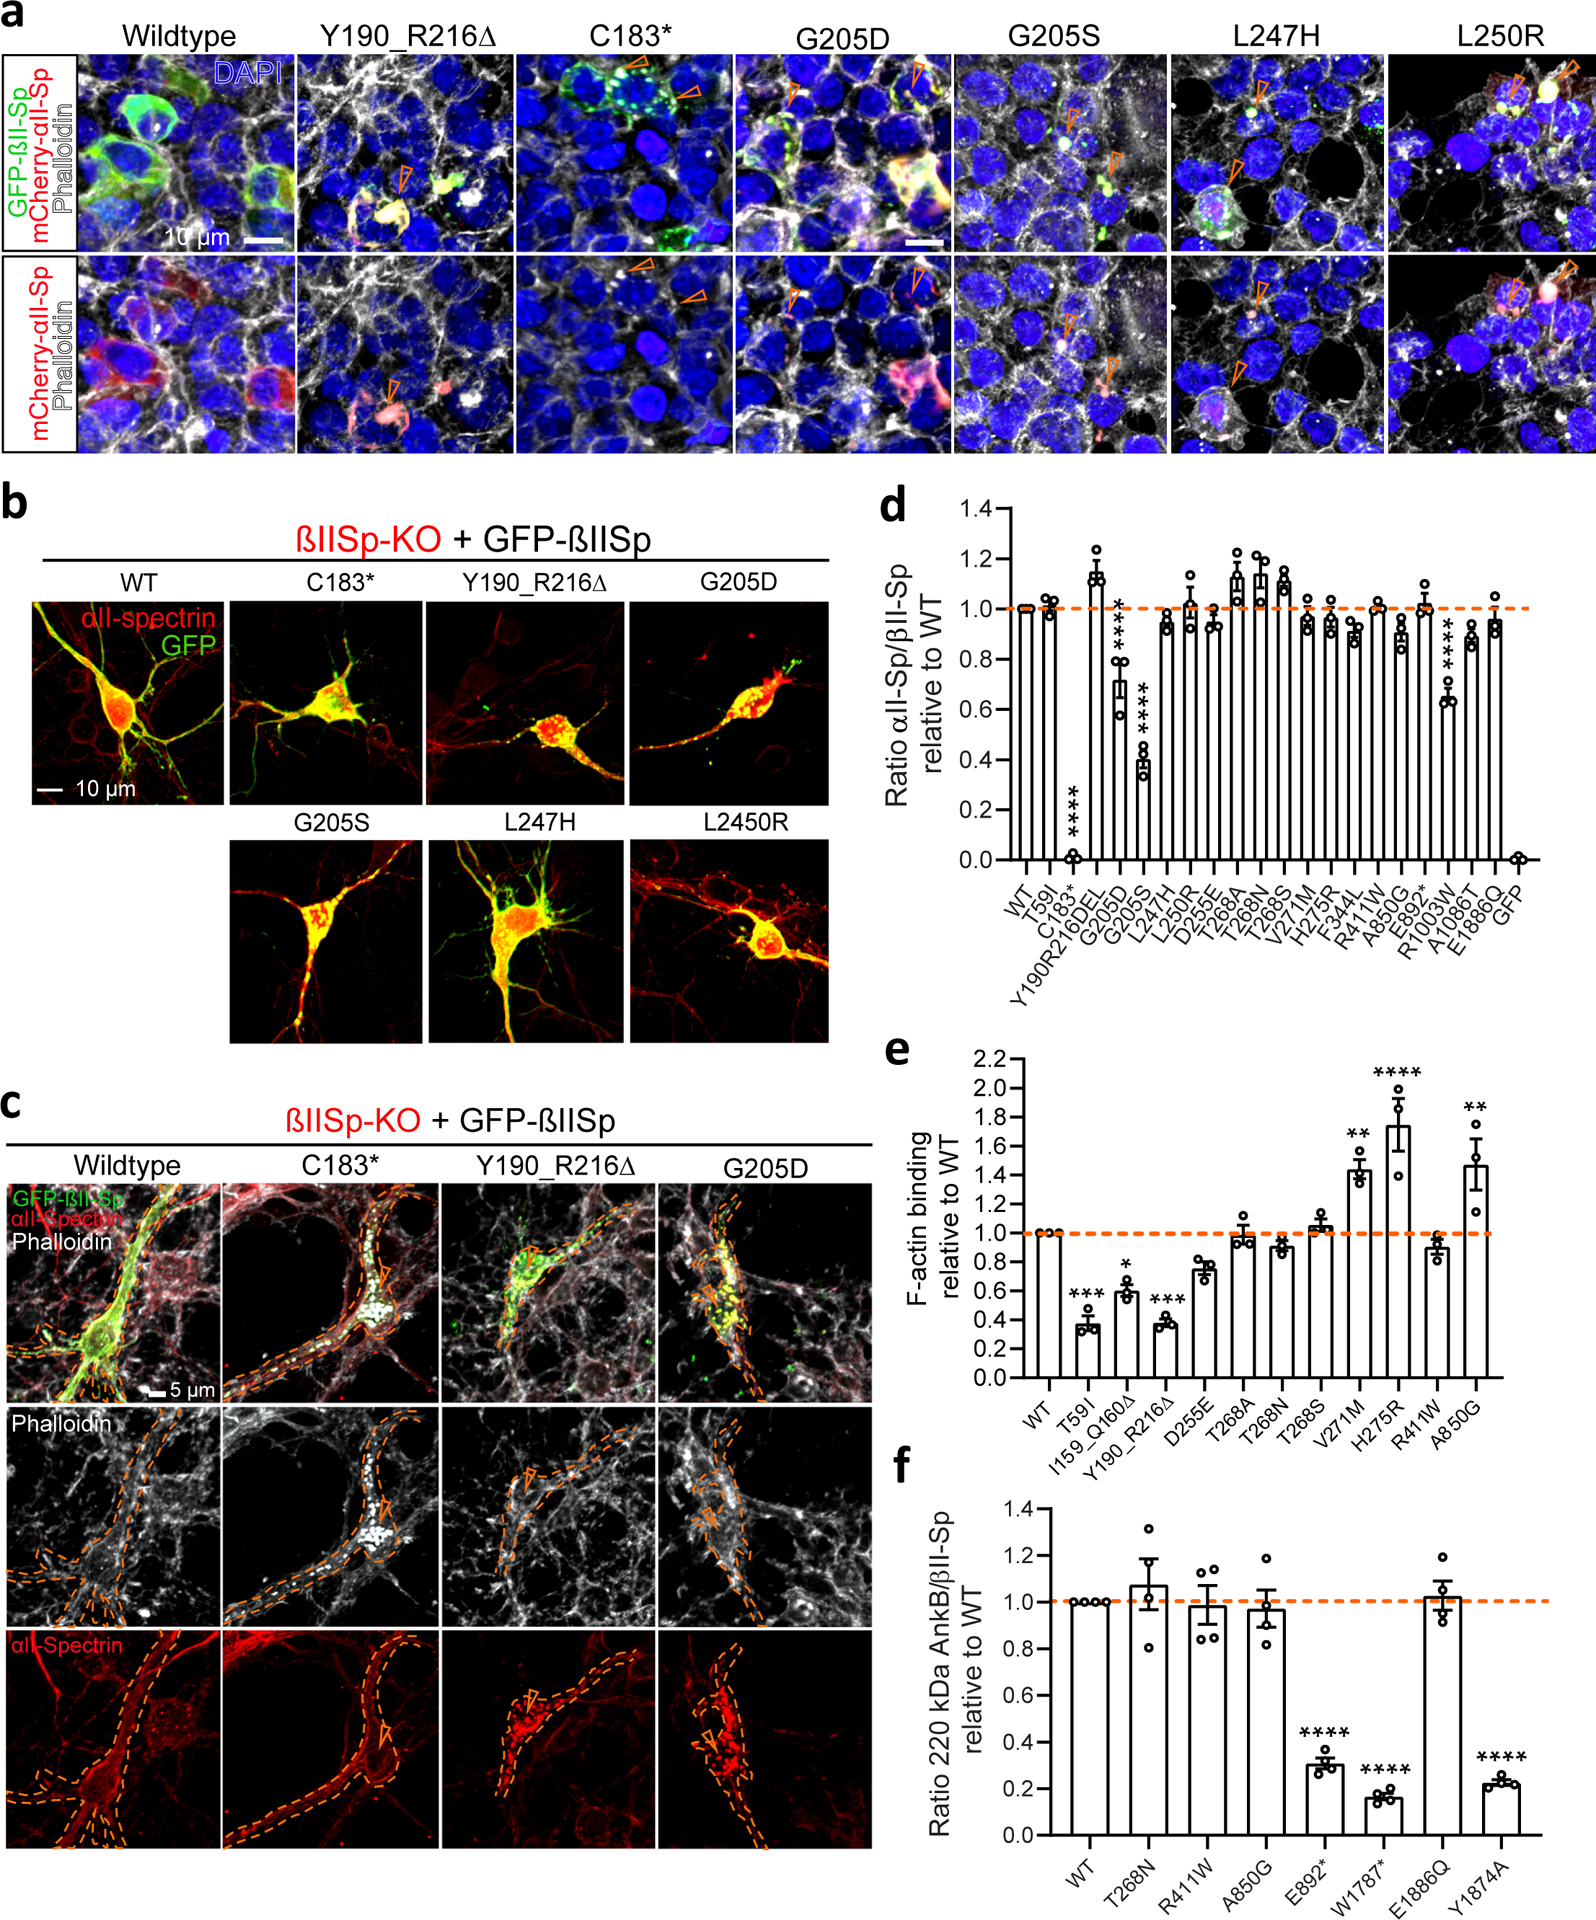
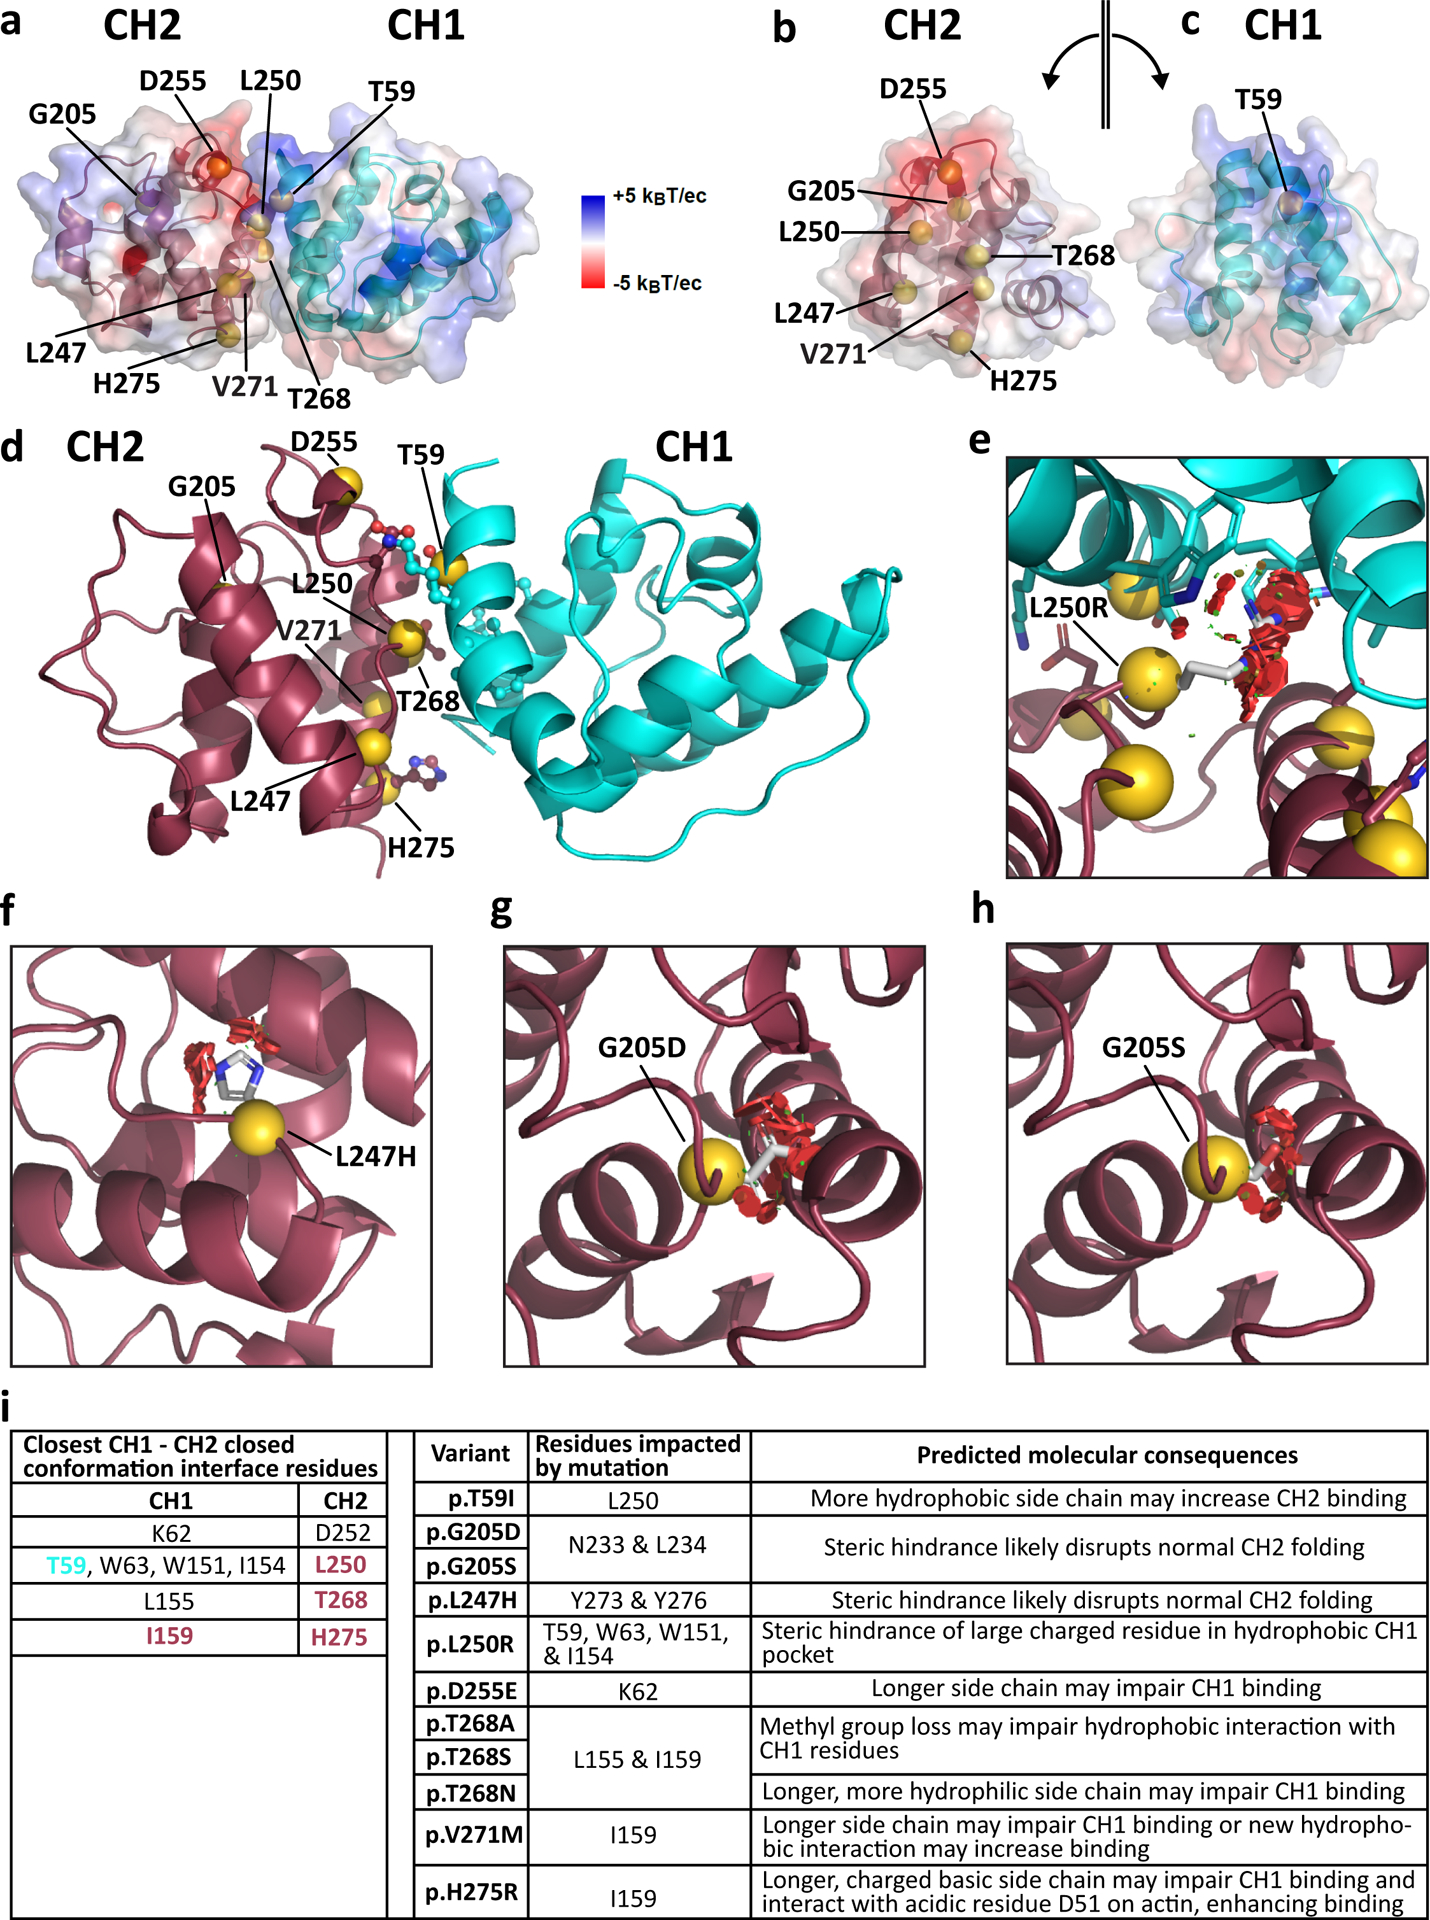
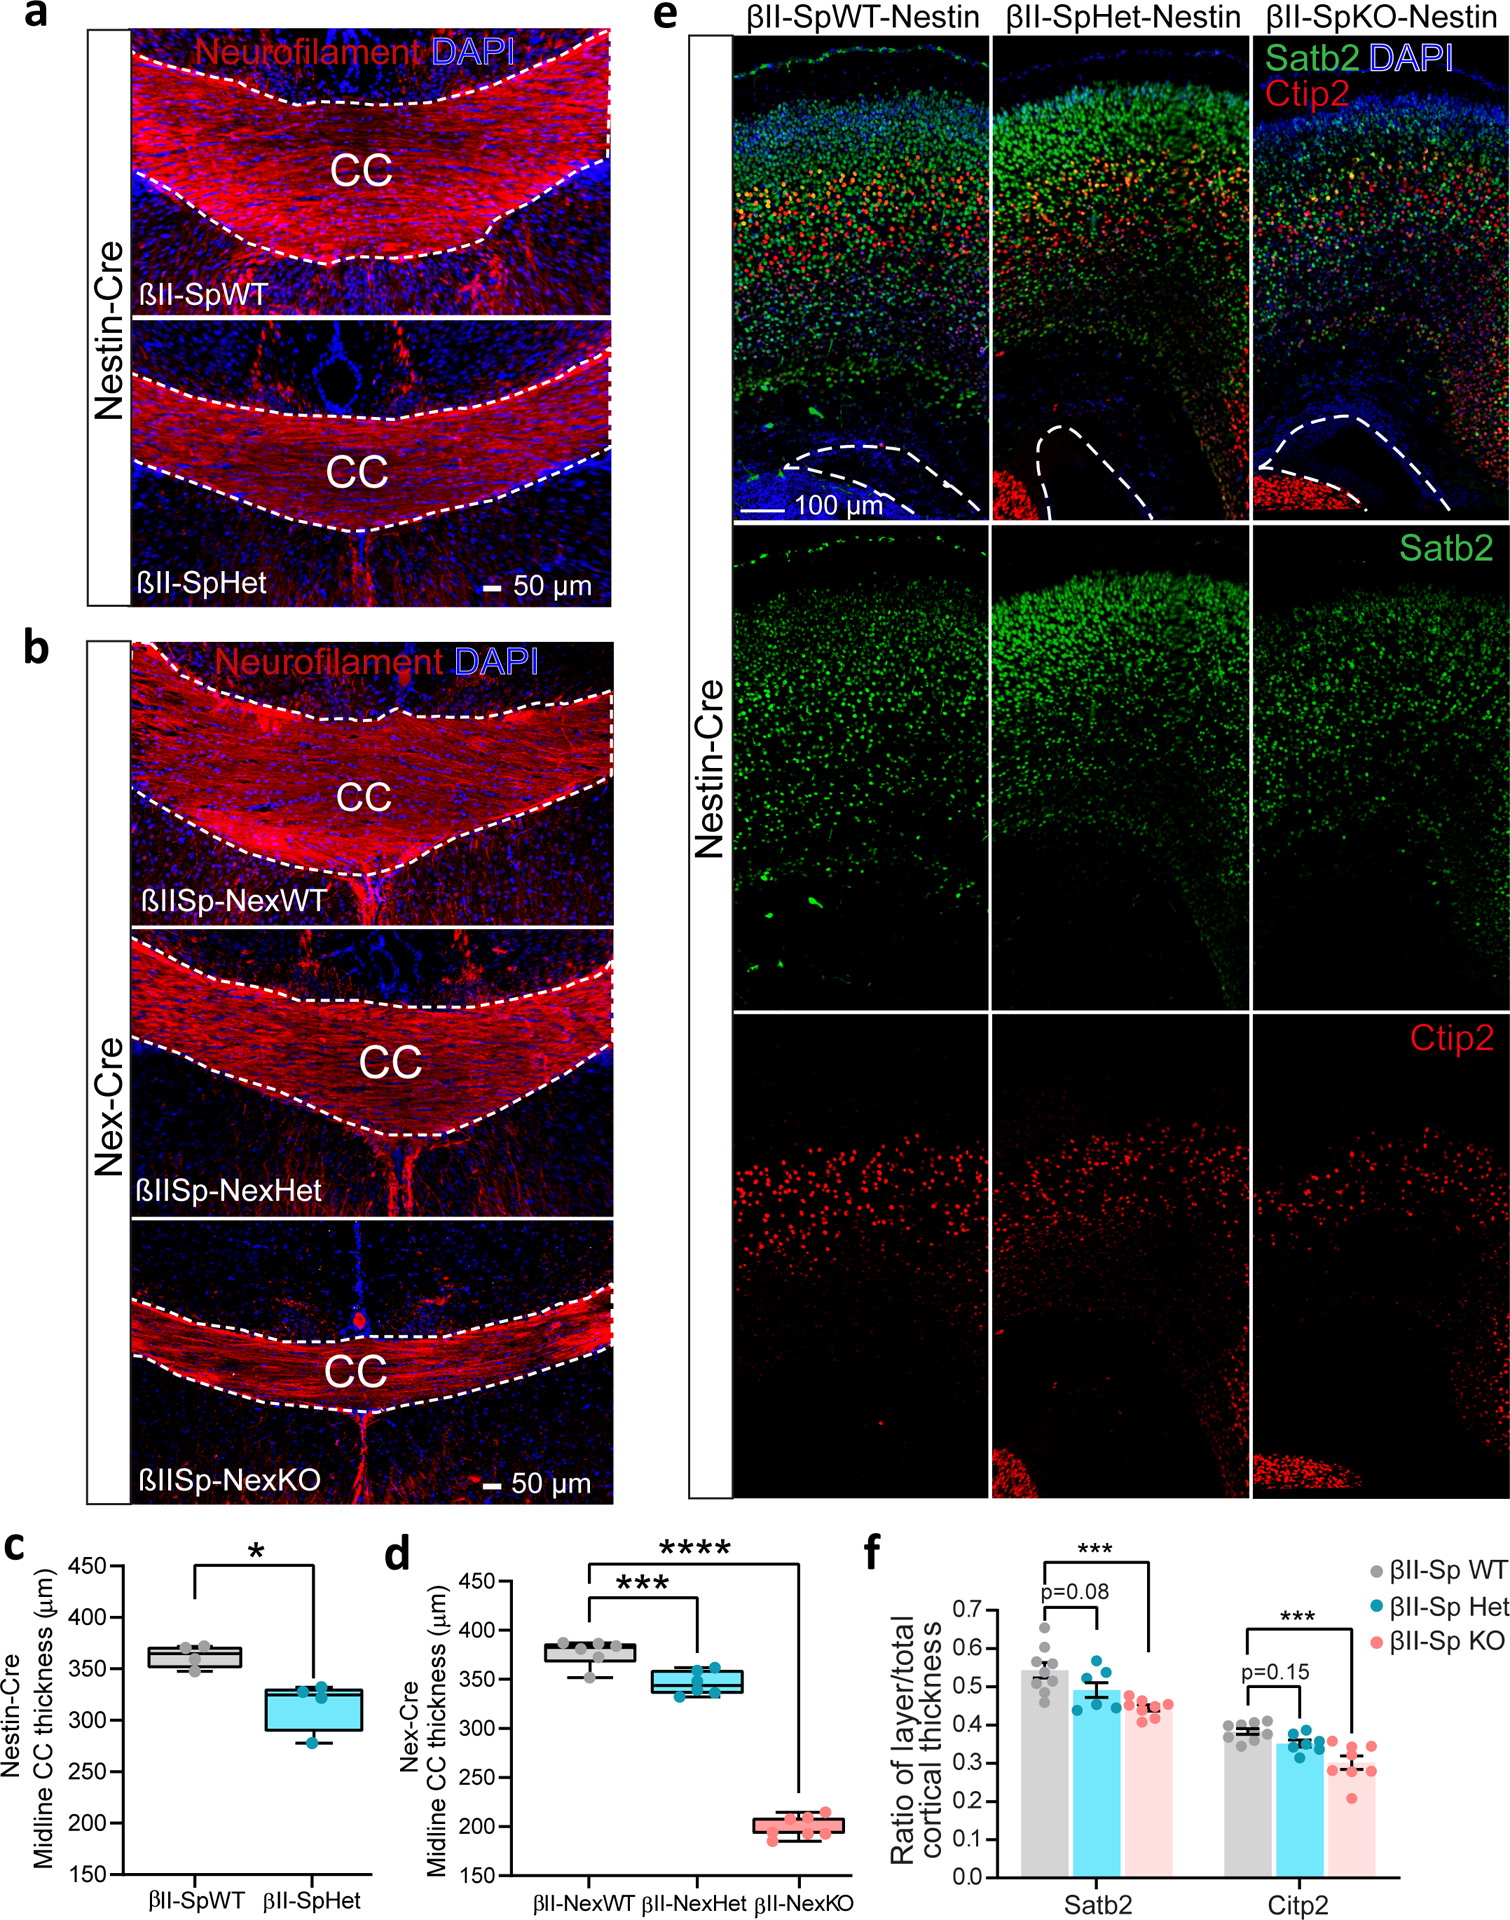
SPTBN1 encodes βII-spectrin, the ubiquitously expressed β-spectrin that forms micrometer-scale networks associated with plasma membranes. Mice deficient in neuronal βII-spectrin have defects in cortical organization, developmental delay and behavioral deficiencies. These phenotypes, while less severe, are observed in haploinsufficient animals, suggesting that individuals carrying heterozygous SPTBN1 variants may also show measurable compromise of neural development and function. Here we identify heterozygous SPTBN1 variants in 29 individuals with developmental, language and motor delays; mild to severe intellectual disability; autistic features; seizures; behavioral and movement abnormalities; hypotonia; and variable dysmorphic facial features. We show that these SPTBN1 variants lead to effects that affect βII-spectrin stability, disrupt binding to key molecular partners, and disturb cytoskeleton organization and dynamics. Our studies define SPTBN1 variants as the genetic basis of a neurodevelopmental syndrome, expand the set of spectrinopathies affecting the brain and underscore the critical role of βII-spectrin in the central nervous system.


Conflict of interest statement

Competing interests

The authors declare the following competing interests: E.T., R.E.P., Y.S., E.A.N., and A.B. are employees of GeneDx, Inc.

Figures

Extended Data Fig. 1
Extended Data Fig. 1. Expression of SPTBN1 variants alters protein expression, cellular distribution and morphology.
a, Western blot of total lysates from HEK 293T/17 cells co-transfected with GFP-βIISp and mCherry plasmids and blotted with anti-GFP and anti-mCherry antibodies. Results are representative of three independent experiments. b, Western blot of Triton-X100 soluble and insoluble fractions from HEK 293T/17 cell lysates transfected with GFP-βIISp plasmids and blotted with anti-GFP antibody. Images are representative of three independent experiments. c, Partition of indicated GFP-βIISp proteins expressed in HEK 293T/17 cells between Triton-X100 soluble and insoluble fractions relative to total GFP-βIISp levels. Data in c were collected from n = 3 biological replicates in three independent experiments. Data represent mean ± SEM. One-way ANOVA with Dunnett’s post hoc analysis test for multiple comparisons, ***P = 0.001, ****P < 0.0001. d, Western blot of total lysates from primary mouse cortical neurons from βIISp-KO mice transduced with lentivirus expressing RFP-PP-βIISp proteins driven by the neuronal-specific synapsin I promoter and blotted with anti-RFP and anti-βIII-tubulin antibodies. Red arrowheads and boxes mark the presence of an additional 70-kDa GFP-positive fragment in HEK 293T/17 (a) and mouse neuron (d) lysates expressing variants that result in GFP-positive aggregates. Blots are representative of three separate experiments. e, Western blot of total lysates from human iPSC lines reprogrammed from PBMCs carrying the indicated variants and blotted with anti-βII-spectrin and anti-α-tubulin antibodies. A red asterisk indicates the presence of a truncated 205-kDa βII-spectrin fragment in lysates from iPSCs reprogrammed from P27 (p.W1787*, c.5361G>A). Blots are representative of four independent experiments. Western blot images were cropped from Source Data Extended Data Figure 1. f, Analysis of sequencing reads from RNA-seq of blood RNA obtained from P27 (p.W1787*, c.5361G>A) indicate allelic expression bias, suggesting some level of nonsense mediated decay of the SPTBN1 allele transcript harboring the nonsense variant, and increased abundance of the major c.5361G SPTBN1 allele. g, Quantification of the percent of GFP-positive HEK 293T/17 cells with GFP aggregates for each of the indicated variants. Data were collected from n = 20 cells/genotype pooled from three independent experiments and the following number of transfection replicates: WT (n = 10), T59I (n = 3), I59Q_160Δ (n = 5), C183* (n = 6), Y190_R216Δ (n = 3), G205D (n = 4), G205S (n = 6), L247H (n = 5), L250R (n = 7), D255E (n = 5), T268A (n = 4), T268N (n = 4), T268S (n = 6), V271M (n = 4), H275R (n = 6), F344L (n = 4), R411W (n = 3), E491Q (n = 4), A850G (n = 3), E892* (n = 3), R1003W (n = 9), A1086T (n = 4), E1110D (n = 4), G1398S (n = 3), W1787* (n = 3), E1886Q (n = 4). h,i, Quantification of cell length (h) and filopodia density normalized to cell length (i) of GFP-positive HEK 293T/17 cells expressing the indicated variants. Data in h and i were collected from WT (n = 23), T59I (n = 13), I59Q_160Δ (n = 12), C183* (n = 12), Y190_R216Δ (n = 26), G205D (n = 11), G205S (n = 11), L247H (n = 22), L250R (n = 14), D255E (n = 18), T268A (n = 13), T268N (n = 15), T268S (n = 12), V271M (n = 10), H275R (n = 13), F344L (n = 12), R411W (n = 10), E491Q (n = 11), A850G (n = 11), E892* (n = 12), R1003W (n = 15), A1086T (n = 10), E1110D (n = 12), G1398S (n = 10), W1787* (n = 12), and E1886Q (n = 12) cells pooled from six independent experiments. All data represent mean ± SEM. One-way ANOVA with Dunnett’s post hoc analysis test for multiple comparisons. (g) ****P < 0.0001, nsP > 0.05. (h) *P = 0.0119 (T268S), *P = 0.0376 (H275R), *P = 0.0184 (R411W), *P = 0.0492 (A850G); **P = 0.0029 (T59I), **P = 0.0083 (V271M); ***P = 0.0009 (E1110D), ***P = 0.0005 (E1886Q); ****P < 0.0001. (i) *P = 0.0141 (G205D); **P = 0.0079 (C183*), **P = 0.0023 (Y190_R216Δ), **P = 0.0027 (G205S), **P = 0.0083 (R411W); ***P = 0.0006 (E491Q), ***P = 0.0002 (E1886Q); ****P < 0.0001. See statistics summary in Source Data Extended Data Figure 5.
Extended Data Fig. 2
Extended Data Fig. 2. SPTBN1 variants alter interaction with critical cytoskeleton partners.
a, Immunofluorescence images, representative of three independent experiments, show HEK 293T/17 cells transfected with mCherry-αIISp and with either WT or mutant GFP-βIISp plasmids. Cells were stained for actin (phalloidin) and DAPI. Scale bar, 10 μm. b, Immunofluorescence images of DIV8 mouse βIISp-WT (top) and βIISp-Het (bottom) cortical neurons transfected with indicated GFP-βIISp plasmids. Scale bar, 10 μm. GFP-positive aggregates are detected in neurons expressing these subsets of CH domain variants regardless of the level of endogenous βII-spectrin. Images are representative of n = 15 neurons per transfection derived from three independent experiments. c, Western blot from a binding assay to assess interaction between mCherry-αIISp and GFP-βII-spectrin proteins representative of n = 3 biological replicates from three independent experiments. Lysates from HEK 293T/17 cells expressing mCherry-αII-spectrin were incubated with GFP-βII-spectrin proteins coupled to GFP beads. The presence of mCherry-αII-spectrin in eluates from GFP beads was evaluated by blotting with anti-GFP and anti-mCherry antibodies. d, Coomassie blue staining showing the presence of purified full-length βII-spectrin and F-actin in the supernatant (S) and pellet (P) fractions from an actin co-sedimentation assay. Blot is representative of three independent experiments each with n = 1 biological replicate. e, Co-IP assay in HEK 293T/17 cells to assess interaction between 220-kDa ankyrin-B (AnkB)-2HA and GFP-βII-spectrin proteins. The presence of 220-kDa AnkB-3xHA and GFP-βII-spectrin proteins in initial lysates and eluates from beads coupled to rabbit IgG isotype control of a rabbit anti-GFP antibody was detected by blotting with anti-GFP and anti-HA antibodies. Blot is representative of four independent experiments, each with n = 1 biological replicate. Western blot images were cropped from Source Data Extended Data Figure 2.
Extended Data Fig. 3
Extended Data Fig. 3. Modeling effects of SPTBN1 variants.
a–c, Potential coevolution of the closed conformation of the tandem calponin homology domain (CH1–CH2) of βII-spectrin (SPTBN1) (CH1 domain (teal), CH2 domain (red)), actinin-4 (ACTN4) (brown), and utrophin (UTRN) (purple). d,e, Top hits from docking simulations of βII-spectrin’s CH1 (d) and CH2 (e) onto F-actin (gray). Domains in dark blue correspond to cryo-EM structure of the CH1 domain of βIII-spectrin bound to F-actin. f, Correct length of simulated interdomain linker (dark blue) in agreement with the orientation of the docked CH2 domain (red). g,h, Spatial distributions of the missense variants in βII-spectrin implicate disease mechanisms. g, Linear conformation of the entire 3D protein model is shown with the calponinhomology (CH) domains (CH1 and CH2) in the N-terminus (red), the spectrin repeats (SR) (green) and the pleckstrin homology (PH) domain in the C-terminus (purple). h, The 17 SR domains are superimposed with a minimal cartoon representation to emphasize the consistency of the 3D architecture despite high sequence diversity. The positions of the amino acid residues representing the missense variants are marked by gold-colored spheres.
Extended Data Fig. 4
Extended Data Fig. 4. Effects of SPTBN1 variants on axonal growth.
a, Images of DIV8 βII-SpWT, βII-SpHet, βII-SpKO, and GFP-βIISp rescued βII-SpKO neurons transfected at DIV3 with mCherry. Staining with an antibody specific for AnkG was used to label the AIS (yellow arrowhead) and to identify axonal processes. Scale bar, 30 μm. Images are representative of three independent experiments.
Extended Data Fig. 5
Extended Data Fig. 5. Effects of SPTBN1 variants on dendrites.
a, Images of DIV18 βII-SpWT, βII-SpHet, βII-SpKO, and GFP-βIISp rescued βII-SpKO neurons stained with an anti-GFP antibody. Scale bar, 30 μm. b,c, Quantification of length of primary dendrites (b) and of total number of primary and secondary dendrites (c) of βII-SpWT, βII-SpHet, βII-SpKO, and rescued βII-SpKO DIV18 neurons (n = 6–16 neurons/genotype) compiled from three independent experiments. Data represent mean ± SEM. One-way ANOVA with Dunnett’s post hoc analysis test for multiple comparisons, *P < 0.05, **P < 0.01, ***P < 0.001, ****P < 0.0001. See statistics summary in Source Data Extended Data Figure 5.
Extended Data Fig. 6
Extended Data Fig. 6. Effects of βII-spectrin deficiency on neuronal morphology and brain development.
a, Image, representative from three independent experiments show DIV8 βII-SpKO cortical neurons rescued with WT GFP-βIISp or with GFP-βIISp bearing variants within the distal portion of the CH2 domain. Neurons were stained for actin (phalloidin) and endogenous αII-spectrin. Yellow dotted lines demark the cell edge. Scale bar, 5 μm. b, Images of PND25 βII-SpNexWT and βII-SpNexKO brains stained for neurofilament to label axons and DAPI. Staining for βII-spectrin show specific loss of the protein in axons from callosal projection neurons from βII-SpNexKO mice. Scale bar, 50 μm. White dotted lines denote the position and boundaries of the corpus callosum (CC). Brains were collected from two separate litters and processed for staining and imaging as part of one independent experiment.
Extended Data Fig. 7
Extended Data Fig. 7. Developmental and behavioral phenotypes of βII-spectrin deficient mice.
a, Images of male PND25 wildtype (βII-SpNexWT) mice and mice lacking βII-spectrin only in cortical and hippocampal projection neurons (βII-SpNexKO) driven by Nex-Cre. b–e, Magnitude of acoustic startle responses (b,d) and percent of prepulse inhibition (c,e) in βII-SpWT mice and mice with partial (βII-SpHet) and complete (βII-SpKO) loss of βII-spectrin in neural progenitors driven by Nestin-Cre. Trials included no stimulus (NoS) trials and acoustic startle stimulus (AS; 120 dB) alone trials. Data in b and c represent mean ± SEM (n = 15 βII-SpWT and n = 5 βII-SpKO male mice). Data in d and e represent mean ± SEM (n = 12 male mice/genotype). Fisher’s PLSD tests following repeated measures ANOVA. b,*P < 0.05, **P < 0.01. c–e, P > 0.05. f, Latency to fall from an accelerating rotarod. Trials 4 and 5 were given 48 h after the first three trials. g,h, Latencies to find the hidden escape platform during acquisition (g) and reversal (h) learning phases of the Morris water maze test for βII-SpWT and βII-SpHet mice. Data represent mean ± SEM of four trials per day. Fisher’s PLSD tests following repeated measures ANOVA. f–h, P > 0.05. i,j, Mice were given a one-minute probe trial without the platform following the acquisition and reversal phases of the Morris water maze test. Target indicates the site where the platform had been located in each phase. Measures were taken of swim path crossings over the target location or corresponding areas in the other quadrants. Within-genotype repeated measures ANOVA, effect of quadrant (the repeated measure), **P = 0.0012, ****P < 0.0001. k,l, Preference for social novelty during a three-chamber choice task. Within-genotype repeated measures ANOVA, *P = 0.0145, **P = 0.0052. Data in f–l represent mean ± SEM (n = 12 male mice/genotype). m, Lack of significant genotype effects on anxiety-like behavior in the elevated plus maze, marble-burying assay, and open field; sensory ability in the buried food test for olfactory function and hot plate test for thermal sensitivity; and vision and swimming ability in the Morris water maze. Data represent mean ± SEM (n = 12 male mice/genotype). Within-genotype repeated measures ANOVA, P > 0.05.
Fig. 1 |
Fig. 1 |. SPTBN1 variants found in individuals with neurodevelopmental disorders.
a, Schematic representation of functional domains of βII-spectrin. CH1, calponin homology domain 1 (teal); CH2, calponin homology domain 2 (red); SR, spectrin repeat (green); PH, pleckstrin homology domain (purple). The locations of SPTBN1 variants are indicated. b, Alignment of protein sequences for βII-spectrin and orthologs show that missense variants identified in affected individuals in this study are located at highly conserved residues across species from humans to Drosophila. Accession numbers: human (Homo Sapiens, NP_003119.2), chimp (Pan troglodytes, XP_001154155.1), mouse (Mus musculus, NP_787030.2), frog (Xenopus tropicalis, NP_001362280.1), zebrafish (Danio rerio, XP_009304586.2), worm (C. elegans, NP_001024053.2), fly (Drosophila melanogaster, NP_001259660.1). The position of SPTBN1 variants analyzed in the sequenced of human βII-spectrin is shown for reference. c, Photos of individuals with SPTBN1 variants. Ages at the time of photograph are: P8, 7y8m; P9, 16y; P12, 11y; P13, 6y; P21 left, unknown; P21 right, 11y; P22, 15y; P28, 3y11m. d, Examples of brain MRI findings: diffuse cerebral parenchymal volume loss (L>R) and asymmetric appearance of hippocampi (P1, acquired at <1y), white matter disease in the supratentorial and infratentorial regions (P18, acquired at 7y), thinning of the posterior body of the corpus callosum without significant volume loss (P28, acquired at 10m).
Fig. 2 |
Fig. 2 |. SPTBN1 variants alter protein expression and subcellular distribution.
a, Levels of mutant GFP-βIISp in HEK 293T/17 relative to WT GFP-βIISp. b, Levels of RFP-βIISp proteins in cortical βIISp-KO neurons transduced with indicated RFP-βIISp lentivirus. c, (left) Pluripotency assessment of iPSCs harvesting SPTBN1 variants reprogrammed from PBMCs. Representative bright field images and immunofluorescence staining for pluripotency markers of reprogrammed iPSCs (n = 1 line per variant) collected from one independent experiment. Scale bar, 125 μm. c, (right) TaqMan ScoreCard assessment of pluripotency and trilineage differentiation potential of undifferentiated (top) and differentiated (bottom) p.E1886Q iPSCs. The box plot displays the sample score (color dot) (n = 1) against the internal control reference set (gray box and whiskers) provided by the manufacturer. d, Endogenous βIISp expression in iPSCs of the indicated genotypes. α-tubulin is a loading control. Data in a were compiled from n = 3 biological replicates from three experiments. Data in b (n = 3 biological replicates) and d (n = 1 biological replicate) were collected from three and four independent experiments, respectively. All data represent mean ± SEM. One-way ANOVA with Dunnett’s post hoc test for multiple comparisons. a, *P = 0.0441, ****P < 0.0001. b, *P = 0.0136, **P = 0.0011, ****P < 0.0001. d, *P = 0.0103. e, Immunofluorescence images of HEK 293T/17 cells expressing GFP-βIISp plasmids and stained for actin (phalloidin) and DAPI. Scale bar, 10 μm. White arrowheads indicate GFP-positive aggregates. White asterisk mark cells with increased density of membrane protrusions. Data in e are representative of six independent experiments. See statistics summary in Source Data Figure 2.
Fig. 3 |
Fig. 3 |. SPTBN1 variants alter interaction with critical cytoskeleton partners.
a, Immunofluorescence images of HEK 293T/17 cells transfected with mCherry-αIISp and with either WT or mutant GFP-βIISp plasmids. Cells were stained for actin (phalloidin) and DAPI. Scale bar, 10 μm. b, Immunofluorescence images of DIV8 mouse βIISp-KO cortical neurons transfected with indicated GFP-βIISp plasmids and stained for endogenous αII-spectrin. Scale bar, 10 μm. c, Immunofluorescence images of DIV8 mouse βIISp-KO cortical neurons transfected with indicated GFP-βIISp plasmids and stained for actin (phalloidin) and endogenous αII-spectrin. Scale bar, 5 μm. In a and c GFP-positive aggregates (orange arrowheads) also contain either actin or αII-spectrin proteins, or both. d, Quantification of binding of mCherry-αIISp to GFP-βIISp proteins relative to the abundance of mCherry-αIISp/WT GFP-βIISp complexes. e, Binding of purified βII-spectrin proteins to purified F-actin assessed through an actin co-sedimentation assay. f, Binding of GFP-βIISp proteins to 220-kDa AnkB-3xHA assessed via co-IP from HEK 293T/17 cells. The Y1874A βII-spectrin variant known to disrupt the formation of AnkB/βII-spectrin complexes was used as control. Graphs in d and e summarize results from three independent experiments. Data in f summarize four independent experiments. All data represent mean ± SEM. One-way ANOVA with Dunnett’s post hoc analysis test for multiple comparisons. d, ****P < 0.0001. e, *P = 0.0222, **P = 0.0098 (V271M), **P = 0.0051 (A850G), ***P = 0.0003, ****P < 0.0001. f, ****P < 0.0001. See statistics summary in Source Data Figure 3.
Fig. 4 |
Fig. 4 |. βII-spectrin CH domain variants likely alter CH1–CH2 dimer stability.
a, Closed conformation of the βII-spectrin CH1–CH2 dimer modeled after utrophin showing the sites of βII-spectrin variants and the electrostatic surface of each domain calculated independently. Electrostatic surface scale from negatively (red) to positively (blue) charged. b,c, Electrostatic complementarity shows that both CH domains have a polar side, where CH2 is negatively charged (red) (b) and CH1 is positively charged (blue) (c), and both have a neutral side. d, Closed conformation of the βII-spectrin CH1–CH2 dimer modeled by docking the CH2 domain of βII-spectrin onto the CH1 domain modeled after βIII-spectrin. e, The p.L250R variant introduces a large, positively charged residue that clashes with a hydrophobic CH1 pocket through steric hindrance and electric instability. f, p.L247H introduces a large aromatic amino acid and likely disrupts normal CH2 folding. g,h, Steric hindrance and negative charge introduced by p.G205D (g) and p.G205S (h) in the interior of CH2 likely disrupts normal CH2 folding. i, Key interactions at the CH1–CH2 interface (site of variants in CH1 (teal) and CH2 (red)) and likely molecular perturbations caused by STPBN1 variants.
Fig. 5 |
Fig. 5 |. SPTBN1 variants affect neuronal axonal growth, AIS morphology and organelle transport.
a, Axonal length of DIV8 neurons (n = 12–34 neurons/genotype) from three experiments. Data represent mean ± SEM. One-way ANOVA with Tukey’s multiple comparisons test, ****P < 0.0001. Orange and blue lines indicate average length of βII-SpWT and βII-SpHet axons, respectively. b, Images representative of three independent experiments show AnkG clustering at the AIS. Scale bar, 10 μm. c, AIS length (n = 10–80 neurons/genotype) compiled from three experiments. Data represent mean ± SEM. d, Kymographs of RFP-LAMP1 motion in axons. Trajectories are shown in green for anterograde, red for retrograde, and blue for static vesicles. Scale bar, 10 μm and 60 s. e, Percent of motile axonal LAMP1-RFP cargo. f,g, Quantification of the anterograde and retrograde velocity (f) and distance traveled (g) of LAMP1-RFP cargo. For e-g the box plots show all data points from minimum to maximum. Boxes represent data from the lower (25th percentile) to the upper (75th percentile) quartiles. The box center corresponds to the 50th percentile. The median is indicated by a horizontal line. Whiskers extends from the largest dataset number smaller than 1.5 times the interquartile range (IQR) to the smallest dataset number larger than 1.5IQR. Data was collected in n=9–13 axons from three independent experiments. Data in c and e–g were analyzed by one-way ANOVA with Tukey’s (c) and Dunnett’s (e–g) post hoc analysis tests, *P < 0.05, **P < 0.01, ***P < 0.001, ****P < 0.0001. See statistics summary in Source Data Figure 5.
Fig. 6 |
Fig. 6 |. βII-spectrin deficiency disrupts proper cortical development.
a,b, Images of coronal sections from PND25 mice expressing Nestin-Cre (a) or Nex-Cre (b) collected from n = 2 litters and stained for neurofilament and DAPI in one independent experiment. Scale bar, 50 μm. White lines indicate the corpus callosum (CC). c, Midline CC thickness of mice expressing Nestin-Cre (n = 4 mice/genotype). Data represent mean ± SEM. Two-tailed unpaired t-test, *P = 0.0134. d, Midline CC thickness assessed from βII-SpWT (n = 6), βII-SpHet-Nex (n = 6) and βII-SpKO-Nex (n = 7) brains. For c and d, the box plots show all data points from minimum to maximum. Boxes represent data from the lower (25th percentile) to the upper (75th percentile) quartiles. The box center corresponds to the 50th percentile. The median is indicated by a horizontal line inside the box. Whiskers extends from the largest dataset number smaller than 1.5 times the interquartile range (IQR) to the smallest dataset number larger than 1.5IQR. e, Images of PND0 βII-SpWT, βII-SpHet and βII-SpKO brains expressing Nestin-Cre stained for Satb2 and Ctip2 to label neocortical layers and DAPI. A white line indicates the position of the left ventricle. Scale bar, 100 μm. f, Quantification of Sabt2- and Ctip2-positive cortical layer thickness relative to total cortical thickness assessed from βII-SpWT (n = 9), βII-SpHet (n = 8) and βII-SpKO (n = 7) brains expressing Nestin-Cre. Data in d and f represent mean ± SEM and were analyzed by one-way ANOVA with Dunnett’s post hoc test for multiple comparisons. d, ***P = 0.0003, ****P < 0.0001. f, Satb2 (***P = 0.0008), Ctip2 (***P = 0.0002). See statistics summary in Source Data Figure 6.
Fig. 7 |
Fig. 7 |. βII-spectrin deficiency causes developmental and behavioral deficits.
a, E19 male embryos. b, Head circumference (n = 5). c, Eye distance (βII-SpWT (n = 7), βII-SpHet (n = 5), βII-SpKO (n = 5) of E19 embryos. Box plots show data points from minimum to maximum. Boxes represent data from the lower (25th-percentile) to the upper (75th-percentile) quartiles. Center and horizontal line inside a box indicate the 50th-percentile and the median, respectively. Whiskers extends from the largest dataset number smaller than 1.5 times the interquartile range (IQR) to the smallest dataset number larger than 1.5IQR. One-way ANOVA with Tukey’s post hoc test. b, *P = 0.029, **P = 0.003. d, PND25 male mice. e, Body length at PND25. Data represent mean ± SEM (n = 12 mice/genotype). One-way ANOVA with Tukey’s post hoc test, ****P < 0.0001. f, Growth curve. Data represent mean ± SEM (n = 12 mice/genotype). g,h, Locomotor activity (g) and rearing (h) during an open-field test. Data in g and h represent mean ± SEM (n = 15 βII-SpWT, n = 5 βII-SpKO PND30 male mice). Data for f, g, i, and j were analyzed by Fisher’s PLSD tests following repeated measures ANOVA, *P < 0.05, **P < 0.01, ***P < 0.001, ****P < 0.0001. Statistical comparisons were not conducted for h due to zero scores in the βII-SpKO group. i, j, Locomotor activity (i) and rearing (j) during an open-field test. k, Social preference during a three-chamber choice task. Within-genotype repeated measures ANOVA, *P = 0.0452. l, Entries into a chamber with a stranger mouse. Fisher’s PLSD test following repeated measures ANOVA, *P = 0.0306. Data in i–l represent mean ± SEM (n = 12 mice/genotype). See statistics summary in Source Data Figure 7.

References

    1. Bennett V & Lorenzo DN Spectrin- and ankyrin-based membrane domains and the evolution of vertebrates. Curr. Top. Membr 72, 1–37 (2013). - PubMed
    1. Bennett V & Lorenzo DN An adaptable spectrin/ankyrin-based mechanism for long-range organization of plasma membranes in vertebrate tissues. Curr. Top. Membr 77, 143–184 (2016). - PubMed
    1. Lorenzo DN Cargo hold and delivery: Ankyrins, spectrins, and their functional patterning of neurons. Cytoskeleton 77, 129–148 (2020). - PubMed
    1. Ikeda Y et al. Spectrin mutations cause spinocerebellar ataxia type 5. Nat. Genet 38, 184–190 (2006). - PubMed
    1. Saitsu H et al. Dominant-negative mutations in alpha-II spectrin cause West syndrome with severe cerebral hypomyelination, spastic quadriplegia, and developmental delay. Am. J. Hum. Genet 86, 881–891 (2010). - PMC - PubMed

Publication types