Review
. 2021 Jul;3(7):896-908.
doi: 10.1038/s42255-021-00419-2. Epub 2021 Jul 1.

Quantitative flux analysis in mammals

Affiliations
Review

Quantitative flux analysis in mammals

Caroline R Bartman et al. Nat Metab. 2021 Jul.

Abstract

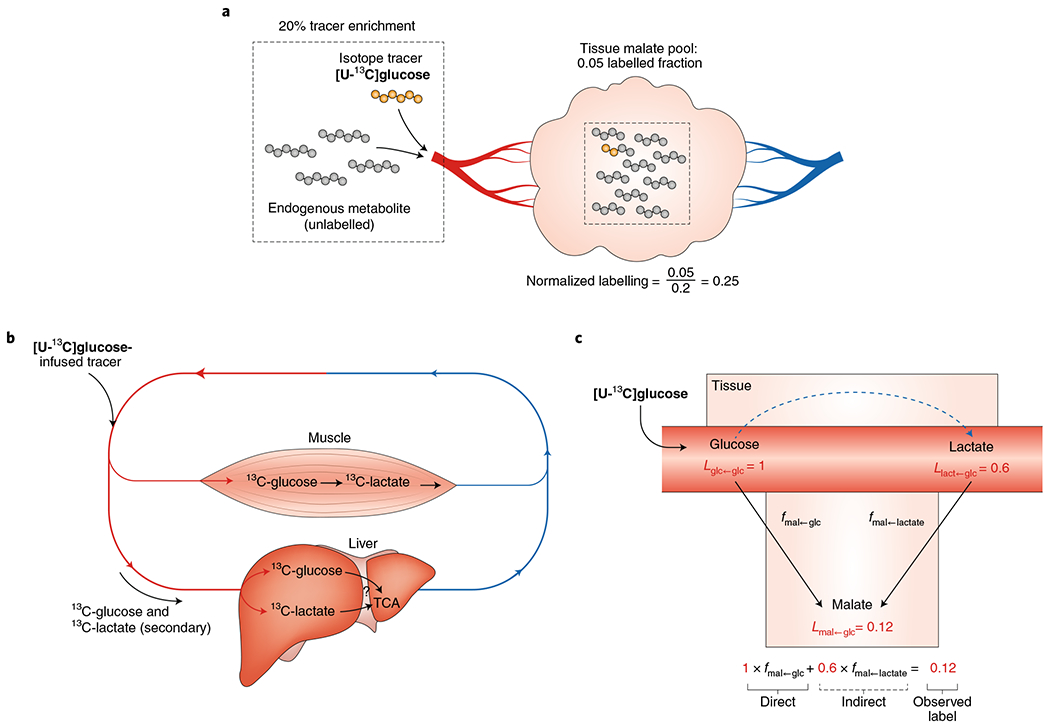
Altered metabolic activity contributes to the pathogenesis of a number of diseases, including diabetes, heart failure, cancer, fibrosis and neurodegeneration. These diseases, and organismal metabolism more generally, are only partially recapitulated by cell culture models. Accordingly, it is important to measure metabolism in vivo. Over the past century, researchers studying glucose homeostasis have developed strategies for the measurement of tissue-specific and whole-body metabolic activity (pathway fluxes). The power of these strategies has been augmented by recent advances in metabolomics technologies. Here, we review techniques for measuring metabolic fluxes in intact mammals and discuss how to analyse and interpret the results. In tandem, we describe important findings from these techniques, and suggest promising avenues for their future application. Given the broad importance of metabolism to health and disease, more widespread application of these methods holds the potential to accelerate biomedical progress.


Conflict of interest statement

Competing interests

The authors declare no competing interests.

Figures

Fig. 1 |
Fig. 1 |. Mammalian metabolic fluxes.
a, Organismal-level metabolism. Mammals convert oxygen and dietary nutrients into CO2, urea and other waste products. In healthy adults, these processes precisely balance at the whole-body level. b, Metabolic tasks are divided among tissues. For example, in the Cori cycle, the liver uses circulating lactate, made by muscle, to produce circulating glucose. c, At the tissue level, metabolic inputs and outputs are also subject to mass balance constraints, with net chemical transformations within the tissue measurable by sampling incoming and outgoing blood.
Fig. 2 |
Fig. 2 |. Measuring net tissue fluxes using arteriovenous sampling.
a, The net production or consumption of metabolites by an organ can be measured by sampling arterial (A) and venous (V) blood metabolite concentrations. If the metabolite concentration in the vein is higher than in the artery, the metabolite is net produced in the tissue bed. If the concentration is lower in the vein than the artery, the metabolite is net consumed. b, To quantify fluxes from arteriovenous sampling, the blood supply and flow rate to each vascular bed must be known. For example, blood supplied to the liver comes from both the hepatic artery and portal vein. Several major vascular beds involve multiple organs. For example, the portal vein drains the intestine, colon, spleen and pancreas. The femoral vein drains the muscle, bone, skin and fat in the leg.
Fig. 3 |
Fig. 3 |. Measuring circulatory turnover flux using tracer infusion.
a, The circulatory turnover flux (Fcirc) of a metabolite, also known as its rate of appearance (Ra), is the whole-body rate of release of that metabolite from tissues into the circulation. To calculate Fcirc, an investigator infuses an isotope-labelled metabolite and measures the labelled fraction of that metabolite in the blood. b, Quantitative relationship between Fcirc and observed labelling for a fixed labelled-metabolite infusion rate. c, Quantitative relationship between observed labelling and perturbation of the endogenous metabolic flux. This graph assumes that the body compensates for the labelled-metabolite infusion by increasing Rd. Irrespective of the form of compensation, infusions that produce high circulating metabolite labelling are always perturbative, while those that produce low labelling are not. The degree of metabolic perturbation is modest for labelling of <25% and increases rapidly for labelling of >50%. d, Fcirc is the sum of the gross production fluxes of the metabolite in each tissue. e, Mass spectrometry measurements of labelled forms define two variants of Fcirc. Fcircintact measures all reactions that reduce the number of atoms labelled in the infused nutrient, while Fcircatom discounts reaction pathways that recycle portions of certain tracer atoms.
Fig. 4 |
Fig. 4 |. Pre-steady-state versus steady-state measurements of tissue metabolite labelling.
Pre-steady-state (slow) labelling of a metabolite from tracer infusion (bottom) can directly measure the production flux of the metabolite (for example, in protein synthesis or de novo lipogenesis). Steady-state (fast) metabolite labelling (top) does not measure production flux but rather the fraction of metabolite contributed by the circulating tracer nutrient (for example, in glycolysis). Intermediate labelling (middle) can measure both, depending on the time point at which tissues are sampled (for example, in the TCA cycle).
Fig. 5 |
Fig. 5 |. Measuring sources of tissue metabolites using tracer infusion.
a, Normalized labelling of tissue metabolites is calculated by normalizing the labelled fraction of the tissue metabolite to the labelled fraction of the infused tracer in the blood. b, Infused metabolite tracers are often converted by tissues into other circulating metabolites, generating secondary tracers that indirectly label downstream metabolite pools. For example, when [U-13C] glucose is infused, tissues such as muscle will catabolize it and release 13C-labelled lactate. c, Both the infused tracer ([U-13C]glucose) and the secondary tracer (circulating 13C-lactate) may contribute labelled carbon to downstream tissue metabolite pools such as the TCA cycle. The observed labelled fraction of a TCA cycle metabolite such as malate equals the sum of the direct contribution from the infused tracer and the indirect contribution via the secondary tracer. To solve for the direct contribution of the infused tracer, the secondary tracer metabolite is infused in a separate experiment. An equation can be written for each infused tracer in which the direct fractional contribution of each considered metabolite (two in this example) serves as a variable. This forms a system of linear equations in which the direct contribution of each metabolite can be calculated.

References

    1. Fenn JB, Mann M, Meng CK, Wong SF & Whitehouse CM Electrospray ionization–principles and practice. Mass Spectrom. Rev 9, 37–70 (1990).
    1. Tanaka K et al. Protein and polymer analyses up to m/z 100 000 by laser ionization time-of-flight mass spectrometry. Rapid Commun. Mass Spectrom 2, 151–153 (1988).
    1. Wolfe RR Tracers in Metabolic Research: Radioisotope and Stable Isotope/Mass Spectometry Methods (A.R. Liss, 1984). - PubMed
    1. McCabe BJ & Previs SF Using isotope tracers to study metabolism: application in mouse models. Metab. Eng 6, 25–35 (2004). - PubMed
    1. Fernández-García J, Altea-Manzano P, Pranzini E & Fendt S-M Stable isotopes for tracing mammalian-cell metabolism in vivo. Trends Biochem. Sci 45, 185–201 (2020). - PubMed

Publication types