

A Network Architecture for Bidirectional Neurovascular Coupling in Rat Whisker Barrel Cortex
- PMID: 34211384
- PMCID: PMC8241226
- DOI: 10.3389/fncom.2021.638700
A Network Architecture for Bidirectional Neurovascular Coupling in Rat Whisker Barrel Cortex
Abstract
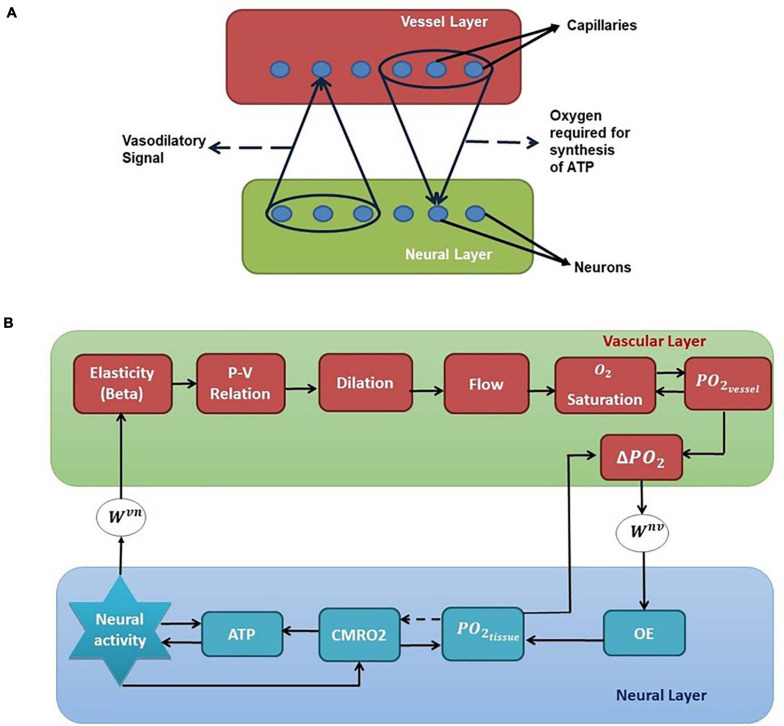
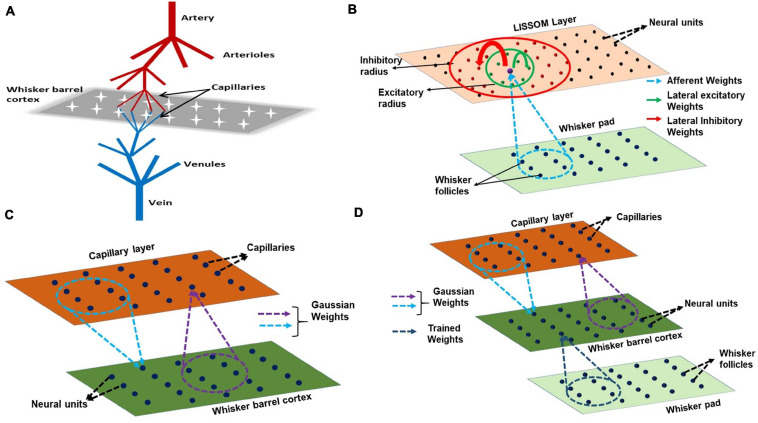
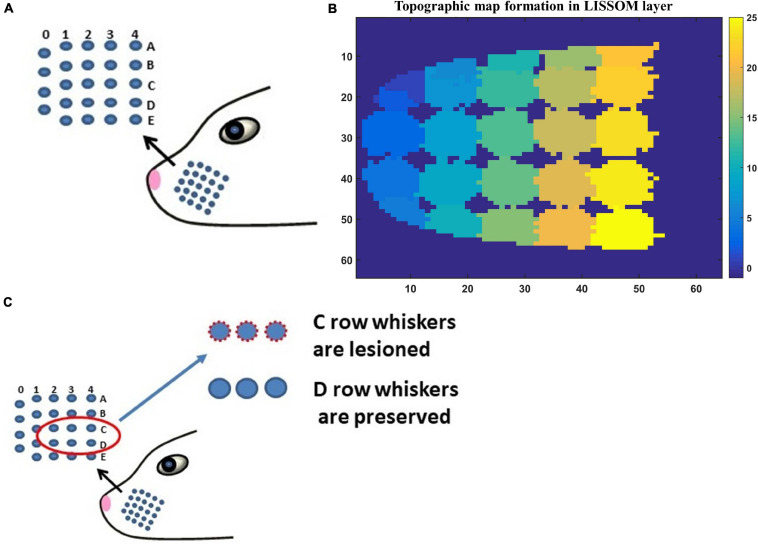
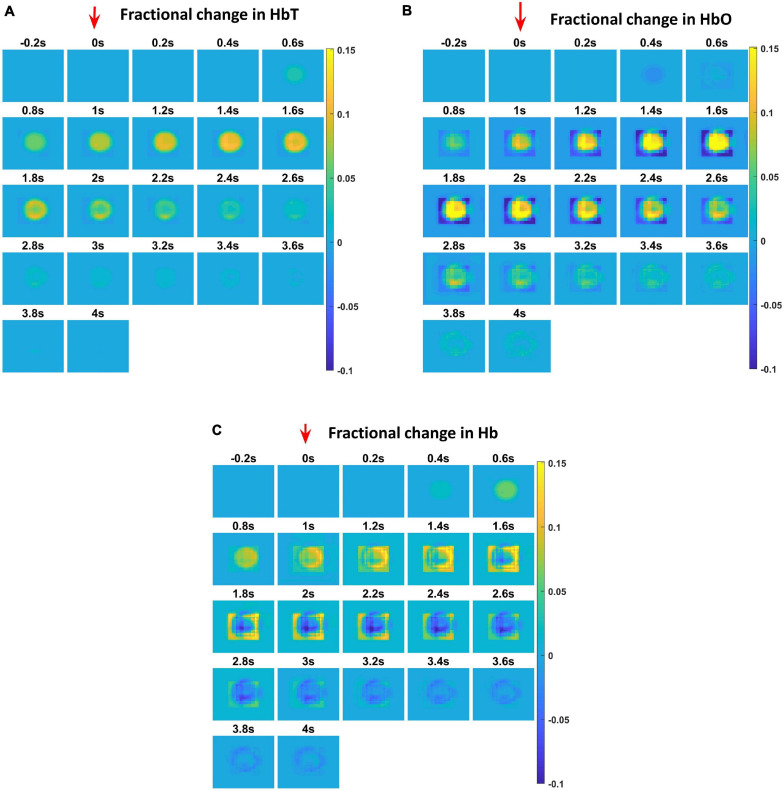
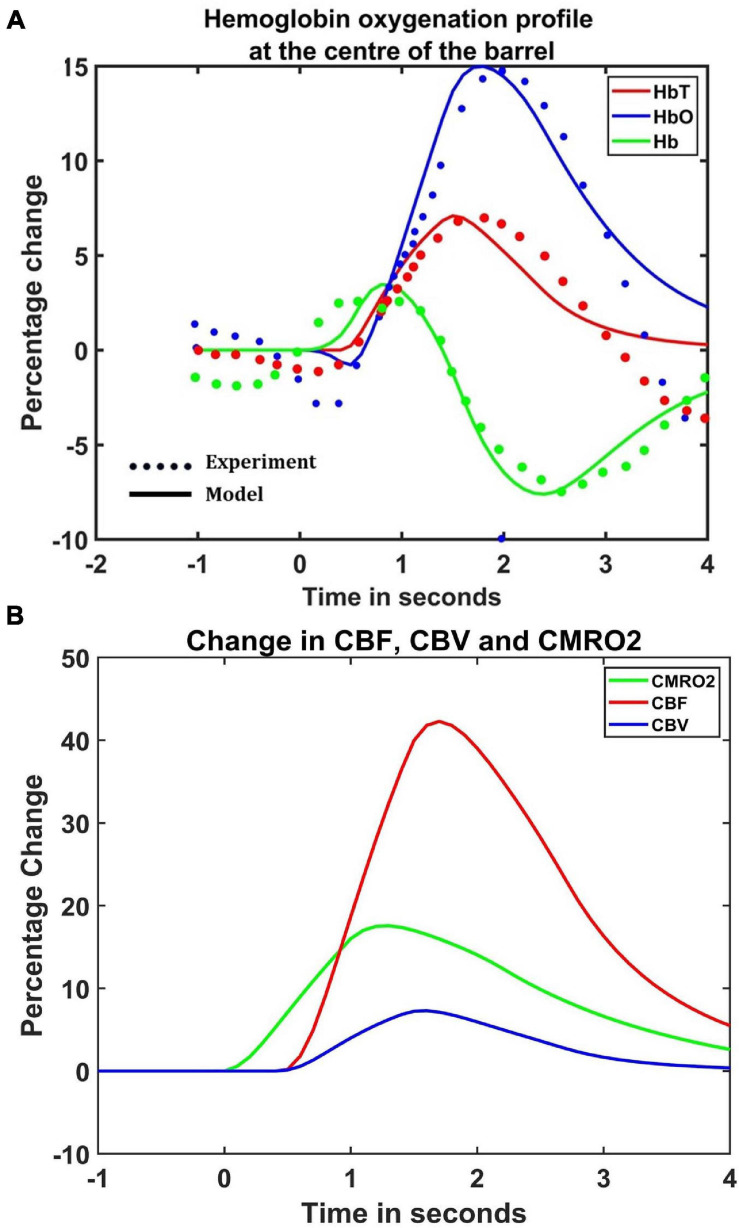
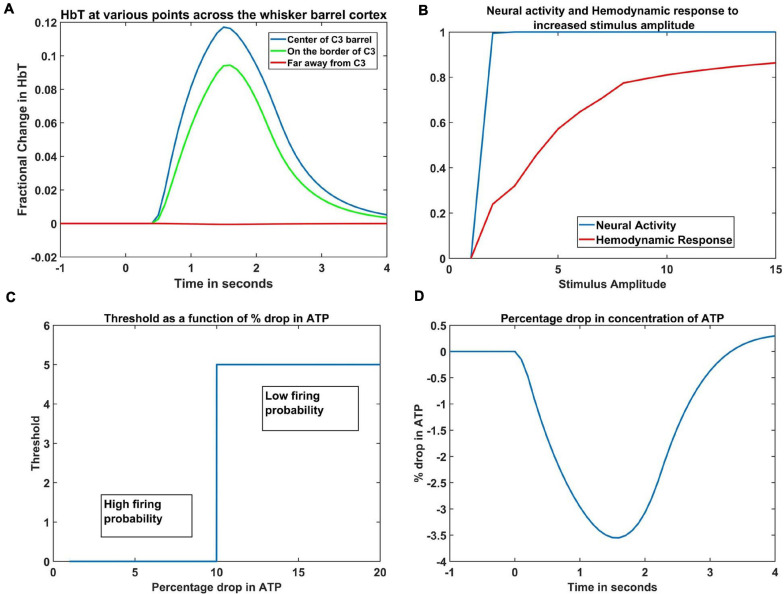
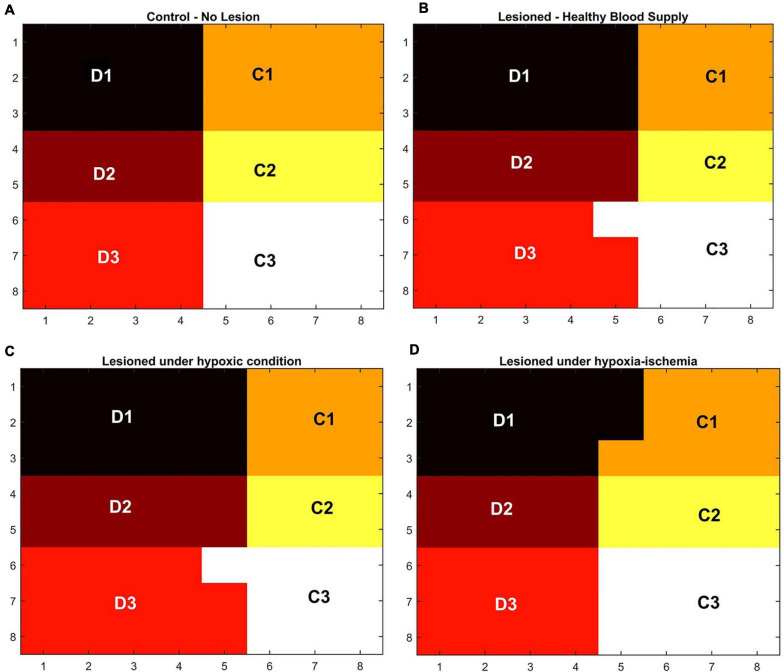
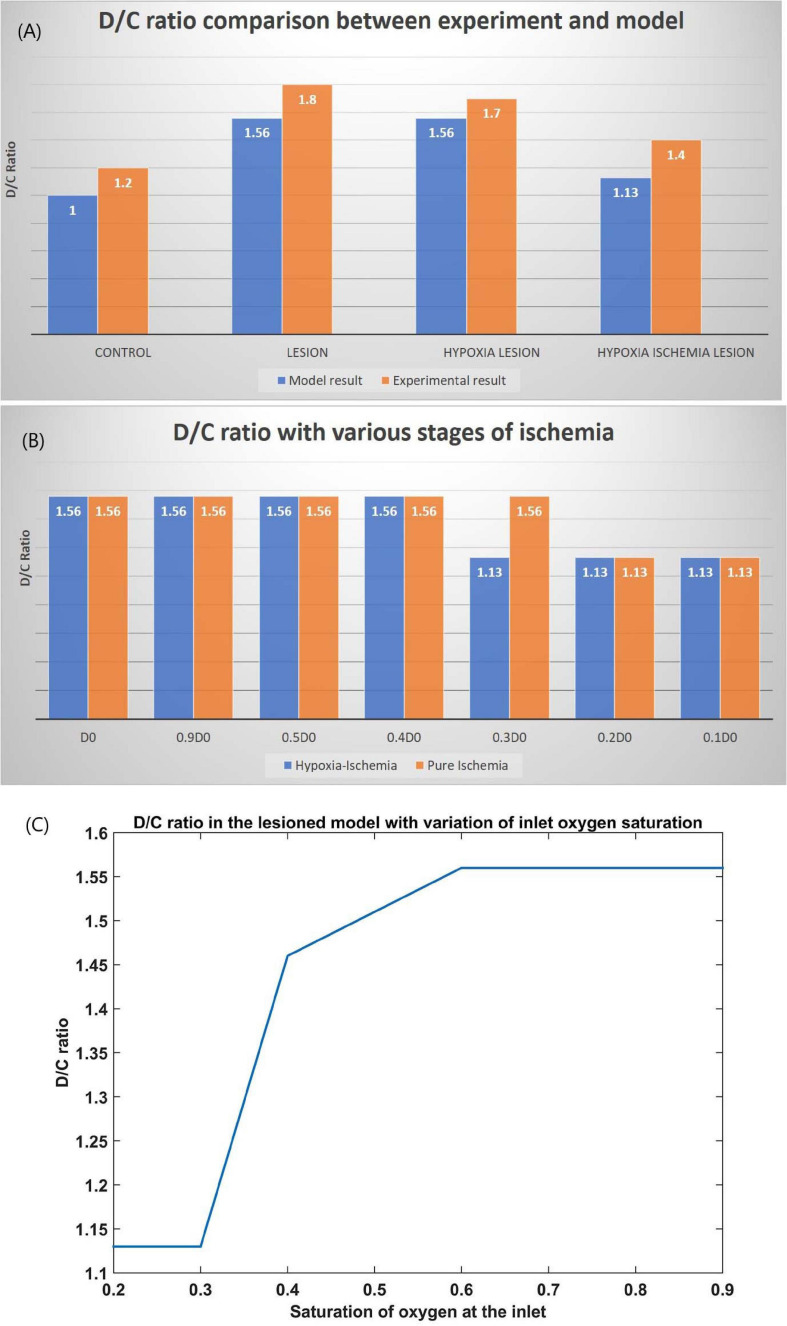
Neurovascular coupling is typically considered as a master-slave relationship between the neurons and the cerebral vessels: the neurons demand energy which the vessels supply in the form of glucose and oxygen. In the recent past, both theoretical and experimental studies have suggested that the neurovascular coupling is a bidirectional system, a loop that includes a feedback signal from the vessels influencing neural firing and plasticity. An integrated model of bidirectionally connected neural network and the vascular network is hence required to understand the relationship between the informational and metabolic aspects of neural dynamics. In this study, we present a computational model of the bidirectional neurovascular system in the whisker barrel cortex and study the effect of such coupling on neural activity and plasticity as manifest in the whisker barrel map formation. In this model, a biologically plausible self-organizing network model of rate coded, dynamic neurons is nourished by a network of vessels modeled using the biophysical properties of blood vessels. The neural layer which is designed to simulate the whisker barrel cortex of rat transmits vasodilatory signals to the vessels. The feedback from the vessels is in the form of available oxygen for oxidative metabolism whose end result is the adenosine triphosphate (ATP) necessary to fuel neural firing. The model captures the effect of the feedback from the vascular network on the neuronal map formation in the whisker barrel model under normal and pathological (Hypoxia and Hypoxia-Ischemia) conditions.
Keywords: bidirectional network model; hypoxia-ischemia; neurovascular coupling; plasticity; whisker barrel cortex.
Copyright © 2021 Kumar, Khot, Chakravarthy and Pushpavanam.
Conflict of interest statement
The authors declare that the research was conducted in the absence of any commercial or financial relationships that could be construed as a potential conflict of interest.
Figures
Similar articles
-
The Influence of Neural Activity and Neural Cytoarchitecture on Cerebrovascular Arborization: A Computational Model.Front Neurosci. 2022 Jul 4;16:917196. doi: 10.3389/fnins.2022.917196. eCollection 2022. Front Neurosci. 2022. PMID: 35860300 Free PMC article.
-
Contribution of supragranular layers to sensory processing and plasticity in adult rat barrel cortex.J Neurophysiol. 1998 Dec;80(6):3261-71. doi: 10.1152/jn.1998.80.6.3261. J Neurophysiol. 1998. PMID: 9862920
-
Vascular Dynamics Aid a Coupled Neurovascular Network Learn Sparse Independent Features: A Computational Model.Front Neural Circuits. 2016 Feb 26;10:7. doi: 10.3389/fncir.2016.00007. eCollection 2016. Front Neural Circuits. 2016. PMID: 26955326 Free PMC article.
-
Representation of tactile scenes in the rodent barrel cortex.Neuroscience. 2018 Jan 1;368:81-94. doi: 10.1016/j.neuroscience.2017.08.039. Epub 2017 Aug 23. Neuroscience. 2018. PMID: 28843997 Review.
-
Neuronal units linked to microvascular modules in cerebral cortex: response elements for imaging the brain.Cereb Cortex. 1996 Sep-Oct;6(5):647-60. doi: 10.1093/cercor/6.5.647. Cereb Cortex. 1996. PMID: 8921201 Review.
Cited by
-
Cognition is entangled with metabolism: relevance for resting-state EEG-fMRI.Front Hum Neurosci. 2023 Apr 11;17:976036. doi: 10.3389/fnhum.2023.976036. eCollection 2023. Front Hum Neurosci. 2023. PMID: 37113322 Free PMC article.
-
Artificial neurovascular network (ANVN) to study the accuracy vs. efficiency trade-off in an energy dependent neural network.Sci Rep. 2021 Jul 5;11(1):13808. doi: 10.1038/s41598-021-92661-7. Sci Rep. 2021. PMID: 34226588 Free PMC article.
-
The Influence of Neural Activity and Neural Cytoarchitecture on Cerebrovascular Arborization: A Computational Model.Front Neurosci. 2022 Jul 4;16:917196. doi: 10.3389/fnins.2022.917196. eCollection 2022. Front Neurosci. 2022. PMID: 35860300 Free PMC article.
-
Toward an integrative neurovascular framework for studying brain networks.Neurophotonics. 2022 Jul;9(3):032211. doi: 10.1117/1.NPh.9.3.032211. Epub 2022 Apr 7. Neurophotonics. 2022. PMID: 35434179 Free PMC article.
-
A New Perspective On Arterioectatic Spinal Angiopathy with a Reversible Pattern: Cause or Consequence?Clin Neuroradiol. 2025 Mar;35(1):67-75. doi: 10.1007/s00062-024-01451-x. Epub 2024 Sep 2. Clin Neuroradiol. 2025. PMID: 39222145
References
-
- Berwick J., Johnston D., Jones M., Martindale J., Martin C., Kennerley A. J., et al. (2008). Fine detail of neurovascular coupling revealed by spatiotemporal analysis of the hemodynamic response to single whisker stimulation in rat barrel cortex. J. Neurophysiol. 99 787–798. 10.1152/jn.00658.2007 - DOI - PMC - PubMed
LinkOut - more resources
Full Text Sources
Miscellaneous