

Time-Resolved Characterization of Indoor Air Quality due to Human Activity and Likely Outdoor Sources during Early Evening Secondary School Wrestling Matches
- PMID: 34211558
- PMCID: PMC8205592
- DOI: 10.1155/2021/5580616
Time-Resolved Characterization of Indoor Air Quality due to Human Activity and Likely Outdoor Sources during Early Evening Secondary School Wrestling Matches
Abstract
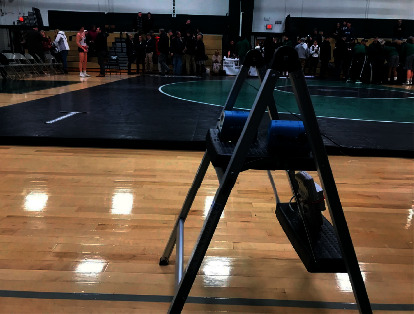
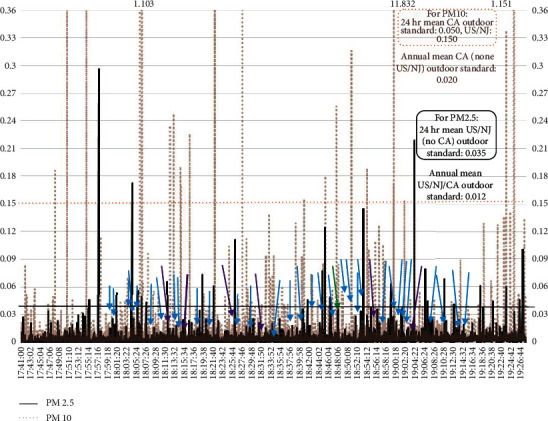
Despite positive health outcomes associated with physical activity as well as individual and team sports, poor indoor air and environmental quality can adversely affect human health, performance, and comfort. We conducted a 14-month field case study incorporating two winter sports regular seasons (12/2017-2/2019) including analyses of particulate matter (PMx) in air and in dust, carbon dioxide (CO2), temperature, and relative humidity (RH%) during secondary or high school wrestling activities in southern New Jersey, USA. After planning and piloting methods during the first winter sports regular season (12/2017-2/2018), during the second winter sports regular season (1-2/2019), we conducted a purposeful simultaneous real-time sampling midgymnasium adjacent to the wrestling mats. Gymnasium occupancy ranged 100-500 people. Data collected included inhalable PM10 resuspended from floor mats, fine respirable PM2.5, and indoor CO2, temperature, and RH%. Short-term real-time elevated PM10 levels were directly compared with simultaneously documented wrestling match bouts, e.g., student-athlete takedowns and pins. PM10 and PM2.5 levels were compared with other known documented activities indoors (e.g., snack bar) and sources outdoors (e.g., adjacent parking lot and major freeway). To understand CO2, temperature, and RH% data, we characterized the HS gym mechanical ventilation system-no doors or windows outdoors-and recorded occupancy during match hours. Indoor CO2 levels ranged ∼700-1000 ppm during match #1 on 1/23/2019 but ranged from ∼900 to 1900 ppm during match #2 on 1/30/2019, with >1000 ppm for the majority of the time (and throughout the entire varsity match when occupancy was at maximum). Future research should further characterize PM10 constituents in mat dust and indoor air with larger samples of schools and matches.
Copyright © 2021 Derek G. Shendell et al.
Conflict of interest statement
The authors declare no conflicts of interest.
Figures


Similar articles
-
Exposure to inhalable aerosols and their chemical characteristics from different potential factors in urban office environments.Environ Sci Pollut Res Int. 2019 Jul;26(21):21750-21759. doi: 10.1007/s11356-019-05375-9. Epub 2019 May 27. Environ Sci Pollut Res Int. 2019. PMID: 31134538
-
Quantifying indoor air quality determinants in urban and rural nursery and primary schools.Environ Res. 2019 Sep;176:108534. doi: 10.1016/j.envres.2019.108534. Epub 2019 Jun 12. Environ Res. 2019. PMID: 31220738
-
Evaluating heterogeneity in indoor and outdoor air pollution using land-use regression and constrained factor analysis.Res Rep Health Eff Inst. 2010 Dec;(152):5-80; discussion 81-91. Res Rep Health Eff Inst. 2010. PMID: 21409949
-
Children environmental exposure to particulate matter and polycyclic aromatic hydrocarbons and biomonitoring in school environments: A review on indoor and outdoor exposure levels, major sources and health impacts.Environ Int. 2019 Mar;124:180-204. doi: 10.1016/j.envint.2018.12.052. Epub 2019 Jan 14. Environ Int. 2019. PMID: 30654326 Review.
-
Indoor Exposure to Selected Air Pollutants in the Home Environment: A Systematic Review.Int J Environ Res Public Health. 2020 Dec 2;17(23):8972. doi: 10.3390/ijerph17238972. Int J Environ Res Public Health. 2020. PMID: 33276576 Free PMC article.
References
Publication types
MeSH terms
Substances
LinkOut - more resources
Full Text Sources
Medical
