

Analysing electrocardiographic traits and predicting cardiac risk in UK biobank
- PMID: 34211707
- PMCID: PMC8202245
- DOI: 10.1177/20480040211023664
Analysing electrocardiographic traits and predicting cardiac risk in UK biobank
Abstract
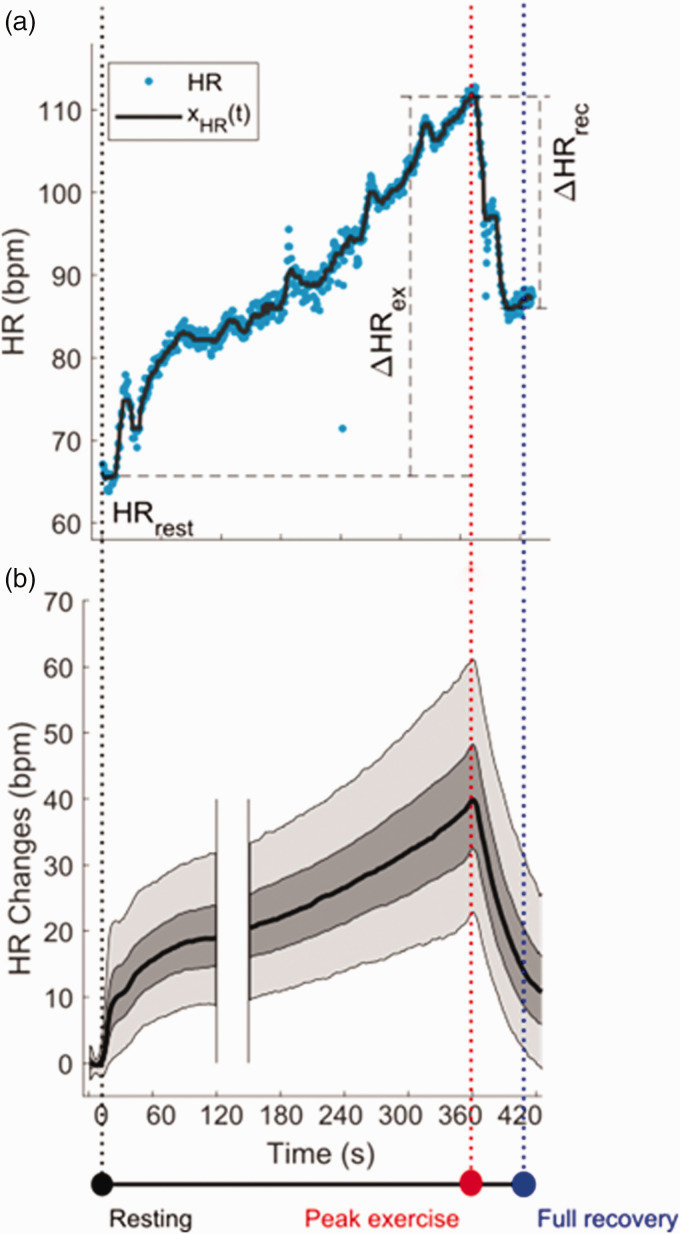
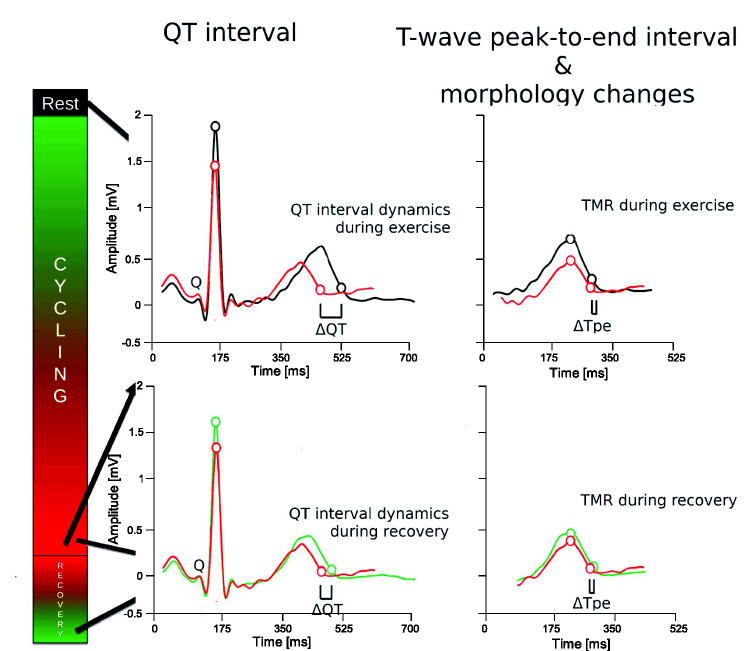
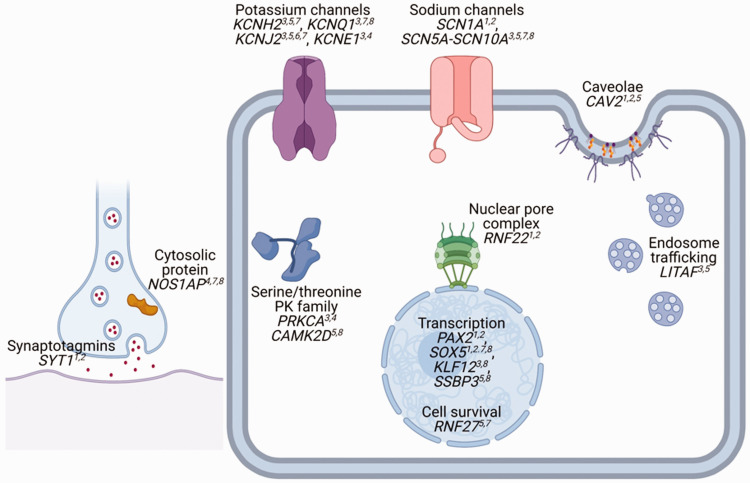
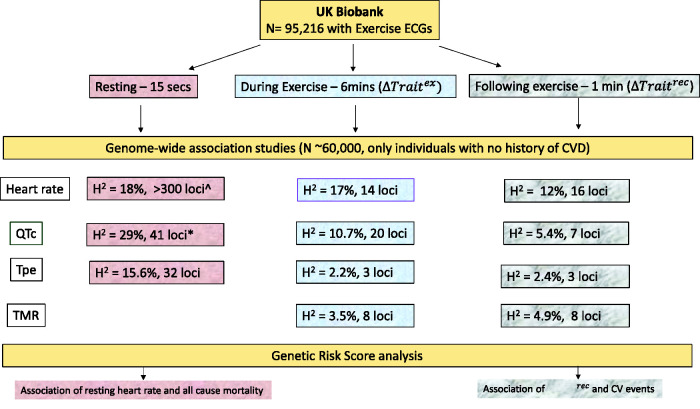
The electrocardiogram (ECG) is a commonly used clinical tool that reflects cardiac excitability and disease. Many parameters are can be measured and with the improvement of methodology can now be quantified in an automated fashion, with accuracy and at scale. Furthermore, these measurements can be heritable and thus genome wide association studies inform the underpinning biological mechanisms. In this review we describe how we have used the resources in UK Biobank to undertake such work. In particular, we focus on a substudy uniquely describing the response to exercise performed at scale with accompanying genetic information.
Keywords: Arrhythmias; clinical electrophysiology; drugs; genomics; ion channels; membrane transport.
© The Author(s) 2021.
Conflict of interest statement
Declaration of conflicting interests: The author(s) declared no potential conflicts of interest with respect to the research, authorship, and/or publication of this article.
Figures
Similar articles
-
Common Genetic Variants Modulate the Electrocardiographic Tpeak-to-Tend Interval.Am J Hum Genet. 2020 Jun 4;106(6):764-778. doi: 10.1016/j.ajhg.2020.04.009. Epub 2020 May 7. Am J Hum Genet. 2020. PMID: 32386560 Free PMC article.
-
The Genetic Makeup of the Electrocardiogram.Cell Syst. 2020 Sep 23;11(3):229-238.e5. doi: 10.1016/j.cels.2020.08.005. Epub 2020 Sep 10. Cell Syst. 2020. PMID: 32916098 Free PMC article.
-
Assessment of the causal relevance of ECG parameters for risk of atrial fibrillation: A mendelian randomisation study.PLoS Med. 2021 May 13;18(5):e1003572. doi: 10.1371/journal.pmed.1003572. eCollection 2021 May. PLoS Med. 2021. PMID: 33983917 Free PMC article.
-
Effects of opioid receptor agonist and antagonist medications on electrocardiogram changes and presentation of cardiac arrhythmia: review article.J Interv Card Electrophysiol. 2022 Mar;63(2):471-500. doi: 10.1007/s10840-021-01072-1. Epub 2021 Oct 21. J Interv Card Electrophysiol. 2022. PMID: 34674120 Review.
-
Cardiac electrophysiology: normal and ischemic ionic currents and the ECG.Adv Physiol Educ. 2017 Mar 1;41(1):29-37. doi: 10.1152/advan.00105.2016. Adv Physiol Educ. 2017. PMID: 28143820 Review.
Cited by
-
Valid inference for machine learning-assisted genome-wide association studies.Nat Genet. 2024 Nov;56(11):2361-2369. doi: 10.1038/s41588-024-01934-0. Epub 2024 Sep 30. Nat Genet. 2024. PMID: 39349818 Free PMC article.
-
Sex-specific cardiovascular risk factors in the UK Biobank.Front Physiol. 2024 Apr 23;15:1339866. doi: 10.3389/fphys.2024.1339866. eCollection 2024. Front Physiol. 2024. PMID: 39165282 Free PMC article.
-
Correlations between Resting Electrocardiogram Findings and Disease Profiles: Insights from the Qatar Biobank Cohort.J Clin Med. 2024 Jan 3;13(1):276. doi: 10.3390/jcm13010276. J Clin Med. 2024. PMID: 38202283 Free PMC article.
-
A sex-specific Mendelian randomization-phenome-wide association study of body mass index.Elife. 2025 Jun 11;13:RP102573. doi: 10.7554/eLife.102573. Elife. 2025. PMID: 40498079 Free PMC article.
-
Automated detection of non-physiological artifacts on ECG signal: UK Biobank and CRIC.Comput Biol Med. 2025 Sep;196(Pt B):110787. doi: 10.1016/j.compbiomed.2025.110787. Epub 2025 Jul 21. Comput Biol Med. 2025. PMID: 40695024 Free PMC article.
References
-
- Finlay M, Harmer SC, Tinker A. The control of cardiac ventricular excitability by autonomic pathways. Pharmacol Ther 2017; 174: 97–111. - PubMed
-
- Moss AJ, Schuger C, Beck CA, et al.. Reduction in inappropriate therapy and mortality through ICD programming. N Engl J Med 2012; 367: 2275–2283. - PubMed
-
- Ramirez J, van Duijvenboden S, Aung N, et al.. Cardiovascular predictive value and genetic basis of ventricular repolarization dynamics. Circul Arrhyth Electrophysiol 2019; 12: e007549. - PubMed
Publication types
Grants and funding
LinkOut - more resources
Full Text Sources
