. 2021 Apr;3(4):264-282.
doi: 10.1038/s42254-021-00289-3. Epub 2021 Mar 19.

Using X-ray free-electron lasers for spectroscopy of molecular catalysts and metalloenzymes

Affiliations

Using X-ray free-electron lasers for spectroscopy of molecular catalysts and metalloenzymes

Uwe Bergmann et al. Nat Rev Phys. 2021 Apr.

Abstract

The metal centres in metalloenzymes and molecular catalysts are responsible for the rearrangement of atoms and electrons during complex chemical reactions, and they enable selective pathways of charge and spin transfer, bond breaking/making and the formation of new molecules. Mapping the electronic structural changes at the metal sites during the reactions gives a unique mechanistic insight that has been difficult to obtain to date. The development of X-ray free-electron lasers (XFELs) enables powerful new probes of electronic structure dynamics to advance our understanding of metalloenzymes. The ultrashort, intense and tunable XFEL pulses enable X-ray spectroscopic studies of metalloenzymes, molecular catalysts and chemical reactions, under functional conditions and in real time. In this Technical Review, we describe the current state of the art of X-ray spectroscopy studies at XFELs and highlight some new techniques currently under development. With more XFEL facilities starting operation and more in the planning or construction phase, new capabilities are expected, including high repetition rate, better XFEL pulse control and advanced instrumentation. For the first time, it will be possible to make real-time molecular movies of metalloenzymes and catalysts in solution, while chemical reactions are taking place.


Conflict of interest statement

Competing interests The authors declare no competing interests.

Figures
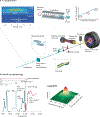
Fig. 1 |
Fig. 1 |. X-ray free-electron laser scheme and experimental design for spectroscopy and diffraction and/or scattering experiments of metalloenzymes and molecular catalysts.
a | Coherent X-rays are generated using relativistic electrons from a linear accelerator propagating through a periodic array of magnets (undulator). The transverse undulating motion of the electrons in the magnetic field gives rise to (spontaneous) X-ray emission. Over a long propagation distance (~100 m), the X-ray field causes microbunching of the electrons at the X-ray wavelength, which, in turn, leads to stronger coherent emission, further microbunching and exponential growth of the coherent X-ray emission. At saturation, the X-ray pulses emitted from this self-amplified spontaneous emission (SASE) process have a relative bandwidth ΔE/E0 ≈ 0.2%, with a pulse duration of a few to several tens of femtoseconds (TABLE 1). Diagnostics and beam manipulation provide ways to characterize and change properties of the X-ray free-electron laser (XFEL) beam, such as intensity or photon flux, beam position or pointing, X-ray spectrum, polarization, repetition rate, pulse duration and arrival time. (Not all these properties can be easily changed at every beamline at all XFELs.) X-rays from the undulator are conditioned by beamline optics, which typically include a monochromator (based on ruled gratings or Bragg crystals) and focusing mirrors. Narrower bandwidth (and higher spectral brightness) is achievable using self-seeding, whereby monochromatization is done upstream (between undulator segments), with further amplification in subsequent undulator segments. Samples are introduced at the focus of the X-ray beam, for instance, by using a liquid injector to replace the sample volume at the repetition rate of the X-ray pulses. Numerous spectroscopy techniques are based on the detection of fluorescent X-rays, including fluorescence-detected X-ray absorption spectroscopy (XAS), X-ray emission spectroscopy (XES) and resonant inelastic X-ray scattering (RIXS). X-rays are collected (in the direction orthogonal to the beam propagation) and analysed by a spectrometer consisting of imaging optics and energy-selective elements (Bragg crystals for hard X-rays or dispersive ruled gratings for soft X-rays). b | Schematic of the XES and XAS spectral region (for a Mn compound) showing the complementarity of the methods (left panel) and schematic of the RIXS spectrum (right panel). VtC, valence to core. Part a adapted with permission from REF.. Part b adapted with permission from REF..
Fig. 2 |
Fig. 2 |. Hard X-ray spectroscopy at X-ray free-electron lasers.
a | Fe Kα X-ray emission spectroscopy (XES) of solutions of Fe/Mn containing ribonucleotide reductase R2c measured at room temperature prior to O2 incubation, and changes observed after 0.5, 2 and 8 s in situ O2 incubation. The change in spectral shape and full width at half maximum (FWHM) indicates, first, formation of a FeIV intermediate (within ~2 s), followed by the catalytically active FeIII state (schematic). b | Transient Fe Kβ XES difference spectra of Fe(CN)4(bpy) (bpy = 2,2′-bipyridine; structure in inset) at 50 fs and 1 ps after photoexcitation and the calculated difference involving either a doublet metal–ligand charge transfer (MLCT) or a quintet metal-centred excited state (top). The contour plot (bottom) shows light-induced changes of the XES up to 1.5 ps after excitation. The spectra indicate that, likely, only one excited state is present and the MLCT state fits the data best. c | Transient Fe valence-to-core (VtC) XES of Fe(CN)4(bpy) (top) and calculated spectra (bottom), showing light-induced changes in the picosecond time range due to photo-oxidation and ligand dissociation. d | Time-resolved X-ray absorption near edge structure (XANES) spectra of cytochrome c before and 600 fs after light excitation. The changes in the edge position and the shape resonances were interpreted as an out-of-plane motion of the haem Fe coupled with a loss of the Fe–S(Met) bond (inset). e | Extended X-ray absorption fine structure (EXAFS) spectra of Fe(terpy)2 (terpy = 2,2′:6′,2˝-terpyridine, structure in right inset, with equatorial (Neq) and axial (Nax) nitrogen atoms indicated) in the ground state and after excitation (“Laser ON”). The k2 weighted difference EXAFS modulation (k2Δχ(k)) as plotted in k-space (bottom inset) indicates light-induced changes in the Fe–ligand distances on the sub-picosecond timescale. k, photoelectron wavevector. Part a adapted with permission from REF.. Part b adapted with permission from REF.. Part c adapted with permission from REF.. Part d adapted with permission from REF.. Part e adapted with permission from REF..
Fig. 3 |
Fig. 3 |. Multimodal detection methods in X-ray free-electron laser studies using hard X-rays.
a | Measurements of femtosecond time-resolved Kα X-ray emission spectroscopy (XES) (left) in parallel with X-ray diffuse scattering (XDS) (right) on a Ru–Co dyad (bottom). The kinetics of the XES show the conversion of the low-spin to the high-spin form of Co within 2 ps. At early times, the XDS data exhibit a strong dip in intensity (ΔS) at momentum transfer Q = 0.5 Å−1, indicating an expansion by 0.2 Å on the 500-fs timescale; a second feature at higher Q indicates thermal equilibration at ~12 ps. The schematic also contains information derived from transient optical absorption spectroscopy (TOAS) measurements, indicating ultrafast electron transfer from Ru to the bridge and transfer from the bridge to Co in under 500 fs. b | X-ray diffraction (XRD) in combination with Mn Kβ and Fe Kα XES of ribonucleotide reductase. The structure of the dinuclear metal centre found in crystals of oxidized ribonucleotide reductase is shown. Electron density is contoured at 1.2 s in blue. Omit density (green) indicates the position of the bridging oxygen atoms. The Mn Kβ spectrum obtained from crystals and solutions is shown, together with a calibration spectrum of MnIICl2 (bottom left); the Fe Kα spectrum of the crystals is shown on the bottom right. c | Combined XRD and XES studies on photosystem II. Left: the overall structure of the protein and the four-step catalytic cycle (Kok cycle), revealed by flashes 1F–4F. For each of the stable states S0, S1, S2 and S3, the XRD structure of the catalytic Mn4Ca cluster obtained from X-ray free-electron laser measurements is also shown, exhibiting a change in the distance between Mn atoms 1 and 4 (given in Å). Right: results from time-resolved XES and XRD measurements, together with kinetic simulations based on previous infrared (IR) or X-ray absorption (XAS) measurements. Bottom: XRD and XES data show concomitant Mn oxidation and insertion of a new oxygen (OX) in the Mn cluster on the 250-μs timescale during the S2 → S3 transition. The S1 state structure is shown in light grey and the different time point structures in various colours (yellow to olive). The electron density is contoured at 3, 4 and 5 σ around the O5 and OX atoms of the Mn cluster and Glu189, a critical mobile amino acid side chain. Part a adapted with permission from REF.. Part b adapted with permission from REF.. Part c adapted with permission from REFS,.
Fig. 4 |
Fig. 4 |. Soft X-ray spectroscopy at transition-metal L-edges with X-ray free-electron lasers.
a | Mn L-edge absorption spectra (L3-edge partial fluorescence yield spectra) and structures of non-cubane reduced MnIIMnIII2CaO(OH) (red), non-cubane oxidized MnIII3CaO(OH) (dark blue), closed-cubane MnIV3CaO4 (green, measured in solution, Mn concentrations 6–15 mM) and of MnIII(acac)3 (light blue, measured in solution, Mn concentration 100 mM). b | Energy-level diagram for metal-specific L-edge partial fluorescence yield absorption spectroscopy. c | Top: calculated electron charge density in MnIII(acac)3 (acac = acetylacetonate) as a function of distance from the Mn centre. Bottom: accumulated electron charge and spin densities upon reduction of MnIII(acac)3 and haem a as a function of distance from the Mn and Fe centre, respectively. d | Resonant inelastic X-ray scattering (RIXS) intensities as a function of incident photon energy at the Fe L3-edge and as a function of energy transfer for Fe(CO)5 (left) and averaged for pump-probe delay times of 0–700 fs after optical excitation of Fe(CO)5 (right, measured in solution, Fe concentration 1 M). e | Integrated RIXS intensities as a function of the pump–probe delay time for regions 1 and 2 as marked in part d, with a kinetic model (solid lines) relating measured RIXS intensities and populations of fitted species. f | Energy-level diagram for RIXS at the Fe L3-edge of Fe(CO)5 with optical excitation (metal–ligand charge-transfer (MLCT) excitation initiating dissociation to Fe(CO)4) and frontier–orbital energies and populations in excited-state and triplet-state Fe(CO)4 and Fe(CO)4-ethanol (EtOH) solvent complexes (dπ and dσ denote Fe-centred 3d-derived orbitals of π and σ symmetry, respectively). g | RIXS intensities at the Fe L3-edge of ferric (FeIII) and ferrous (FeII) iron hexacyanide Fe(CN)6 (as measured in solution, Fe concentrations 0.5 and 0.33 M, respectively). h | RIXS intensity differences (pumped minus unpumped) averaged for pump–probe delay times of −70 to 110 fs after optical excitation of FeIII-cyanide, representative of the ligand–metal charge-transfer (LMCT) state, measured in solution with Fe concentration 0.3 M. Integration is for −70 to 110 fs because the temporal resolution in the experiment was 180 fs; saturated intensities are shown for better visualization. i | Energy-level diagram in octahedral (Oh) symmetry for FeIII-cyanide and FeII-cyanide and the LMCT state of ferric hexacyanide (*FeIII) with main RIXS transitions (*, 1 and 2 as indicated in parts g and h and calculated electron charge density difference between LMCT *FeIII-cyanide and FeIII-cyanide (LMCT minus ground state)). HOMO, highest occupied molecular orbital; LUMO, lowest occupied molecular orbital. Part a adapted with permission from REFS,. Part c adapted with permission from REFS,. Part d adapted with permission from REF.. Part e adapted with permission from REF.. Part g adapted with permission from REF.. Parts h and i adapted with permission from REF..
Fig. 5 |
Fig. 5 |. Examples of future X-ray free-electron laser-based nonlinear spectroscopy methods.
a | Level diagram of various transition-metal K emission lines (top left) and schematics of amplified spontaneous emission (top right) and seeded stimulated emission (bottom right). The pump pulse is tuned above the K-edge to create 1s core-hole excited states in the sample (red dots). In amplified spontaneous emission, a randomly forward emitted photon stimulates emission when encountering an excited atom, leading to amplification along the path of atoms in the excited state, as created by the pump pulse. In seeded stimulated emission, the seed pulse energy is tuned to that of the emission line that one wants to enhance along the pump or seed pulse direction. Bottom left: single-shot seeded Kβ stimulated X-ray emission spectroscopy (S-XES) spectrum (red line) of NaMnO4 compared with conventional X-ray emission spectroscopy (XES) spectrum (blue line), showing the potential for spectral narrowing in S-XES. b | Level diagram and calculated valence-to-core (VtC) spectra in metal–ligand double-core-hole XES. Two photons from the X-ray free-electron laser pulse simultaneously create a double-core-hole (DCH) state, with one core-hole in the metal and one in the ligand. c | Calculated DCH spectra with N and Cl are compared with the conventional single-core-hole (SCH) VtC spectrum of MnII(terpy)Cl2 (terpy=2,2′:6′,2˝-terpyridine). d,e | Level diagram (part d) and representative calculated 2D X-ray core-hole correlation spectroscopy maps (part e) for the para and ortho isomers of aminophenol. The degree of orbital mixing of the N–2p and O–2p valence states gives rise to a nonlinear mixing of the polarizations associated with resonant excitation from the O–1s and N–1s core levels. The off-diagonal cross peaks (right map) indicate the enhanced mixing in the ortho conformation (effectively, mixing of the N–1s and O–1s X-ray absorption near edge structure (XANES) spectra). Such quantum effects are absent in the para isomer due to the separation of the O and N atoms. f | Generalized schematic of X-ray core-hole correlation spectroscopy using a four-wave mixing geometry with a three-pulse sequence (k1, k2, k3). The signal of interest is the nonlinear polarization, kS, shown here resolved in frequency (energy) using a spectrometer. The other energy axis (ω12) is determined by the Fourier transform of the signal with respect to the time delays of the first two phase-locked pulses. Part a adapted with permission from REF.. Parts b and c adapted with permission from REF.. Parts d and e adapted with permission from REF..

References

    1. Röntgen WC On a new kind of rays. Science 3, 227–231 (1896). - PubMed
    1. Dam HJW in McClure’s Magazine Vol. 6 (McClure SS, 1896).
    1. Watson JD & Crick FHC Molecular structure of nucleic acids - a structure for deoxyribose nucleic acid. Nature 171, 737–738 (1953). - PubMed
    1. Rossbach J, Schneider JR & Wurth W 10 years of pioneering X-ray science at the free-electron laser FLASH at DESY. Phys. Rep 808, 1–74 (2019).
    1. Garman EF Radiation damage in macromolecular crystallography: what is it and why should we care? Acta Cryst. D Biol. Crystallogr 66, 339–351 (2010). - PMC - PubMed