

The influence of strain on image reconstruction in Bragg coherent X-ray diffraction imaging and ptychography
- PMID: 34212879
- PMCID: PMC8284403
- DOI: 10.1107/S160057752100477X
The influence of strain on image reconstruction in Bragg coherent X-ray diffraction imaging and ptychography
Abstract
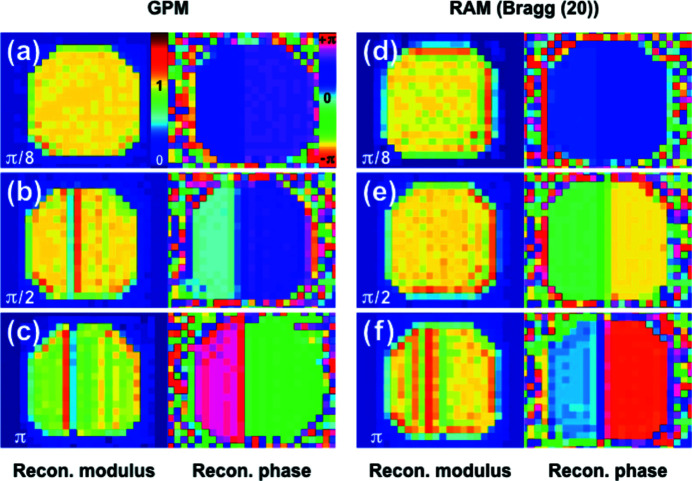
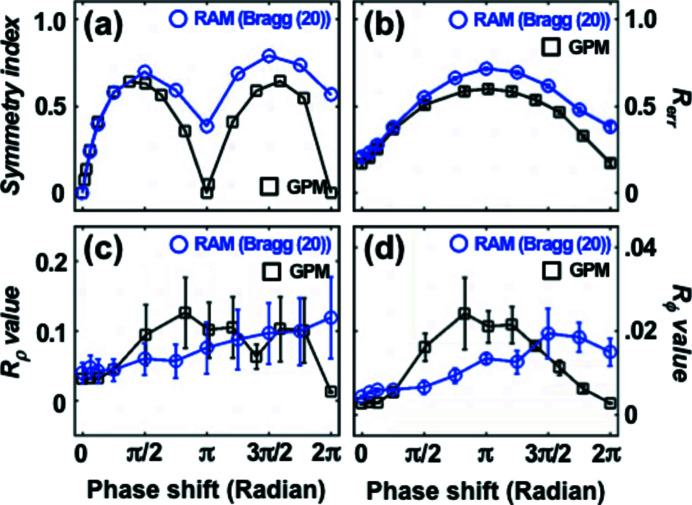
A quantitative analysis of the effect of strain on phase retrieval in Bragg coherent X-ray diffraction imaging is reported. It is shown in reconstruction simulations that the phase maps of objects with strong step-like phase changes are more precisely retrieved than the corresponding modulus values. The simulations suggest that the reconstruction precision for both phase and modulus can be improved by employing a modulus homogenization (MH) constraint. This approach was tested on experimental data from a highly strained Fe-Al crystal which also features antiphase domain boundaries yielding characteristic π phase shifts of the (001) superlattice reflection. The impact of MH is significant and this study outlines a successful method towards imaging of strong phase objects using the next generation of coherent X-ray sources, including X-ray free-electron lasers.
Keywords: Bragg ptychography; anti-phase domain boundary; coherent X-ray diffraction imaging; modulus homogenization; strong phase object.
open access.
Figures


Similar articles
-
Three-Dimensional Imaging of Phase Ordering in an Fe-Al Alloy by Bragg Ptychography.Phys Rev Lett. 2018 Dec 21;121(25):256101. doi: 10.1103/PhysRevLett.121.256101. Phys Rev Lett. 2018. PMID: 30608794
-
Framework for three-dimensional coherent diffraction imaging by focused beam x-ray Bragg ptychography.Opt Lett. 2011 Jun 15;36(12):2227-9. doi: 10.1364/OL.36.002227. Opt Lett. 2011. PMID: 21685975
-
Measuring Three-Dimensional Strain and Structural Defects in a Single InGaAs Nanowire Using Coherent X-ray Multiangle Bragg Projection Ptychography.Nano Lett. 2018 Feb 14;18(2):811-819. doi: 10.1021/acs.nanolett.7b04024. Epub 2018 Jan 24. Nano Lett. 2018. PMID: 29345956
-
Towards a quantitative determination of strain in Bragg Coherent X-ray Diffraction Imaging: artefacts and sign convention in reconstructions.Sci Rep. 2019 Nov 22;9(1):17357. doi: 10.1038/s41598-019-53774-2. Sci Rep. 2019. PMID: 31758040 Free PMC article.
-
X-Ray Scattering and Imaging Studies of Electrode Structure and Dynamics.Chem Rec. 2019 Jul;19(7):1220-1232. doi: 10.1002/tcr.201800083. Epub 2018 Sep 24. Chem Rec. 2019. PMID: 30251465 Review.
References
-
- Błażkiewicz, M., Wiszomirska, I. & Wit, A. (2014). Acta Bioeng. Biomech. 16, 29–35. - PubMed
-
- Cha, W., Song, S., Jeong, N. C., Harder, R., Yoon, K. B., Robinson, I. K. & Kim, H. (2010). New J. Phys. 12, 035022.
-
- Chahine, G. A., Richard, M.-I., Homs-Regojo, R. A., Tran-Caliste, T. N., Carbone, D., Jacques, V. L. R., Grifone, R., Boesecke, P., Katzer, J., Costina, I., Djazouli, H., Schroeder, T. & Schülli, T. U. (2014). J. Appl. Cryst. 47, 762–769.
-
- Chapman, H. N. & Nugent, K. A. (2010). Nat. Photon. 4, 833–839.
LinkOut - more resources
Full Text Sources
Research Materials
Miscellaneous
