. 2021 Sep 6;220(9):e202011144.
doi: 10.1083/jcb.202011144. Epub 2021 Jul 2.

The HSPG syndecan is a core organizer of cholinergic synapses

Affiliations

The HSPG syndecan is a core organizer of cholinergic synapses

Xin Zhou et al. J Cell Biol. .

Abstract

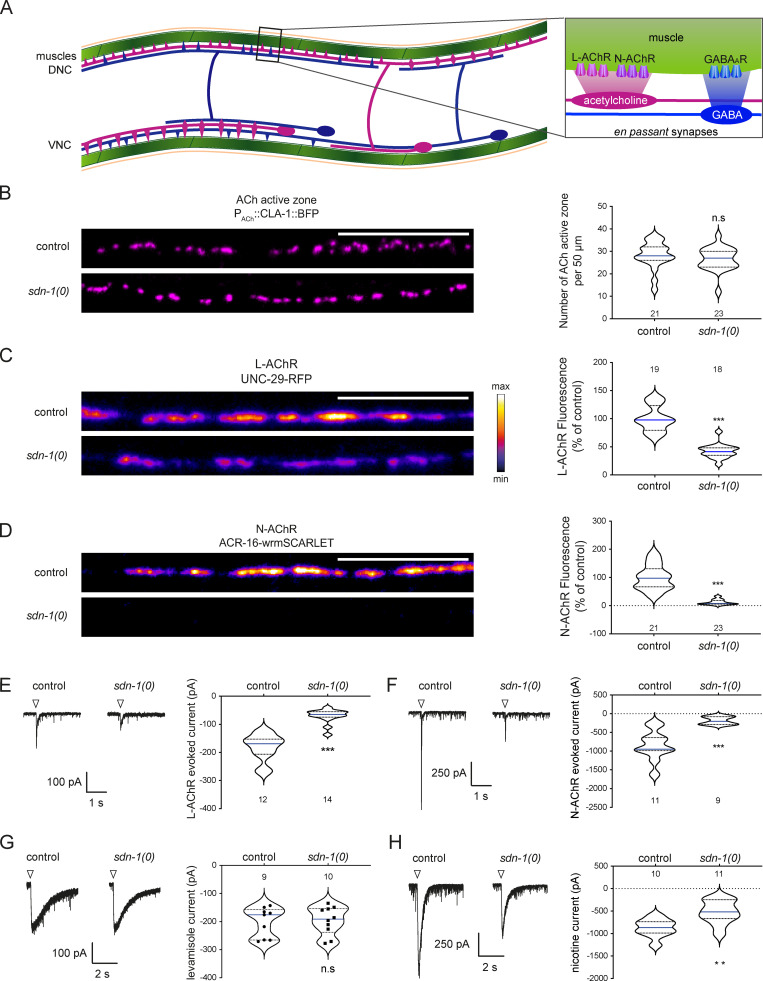
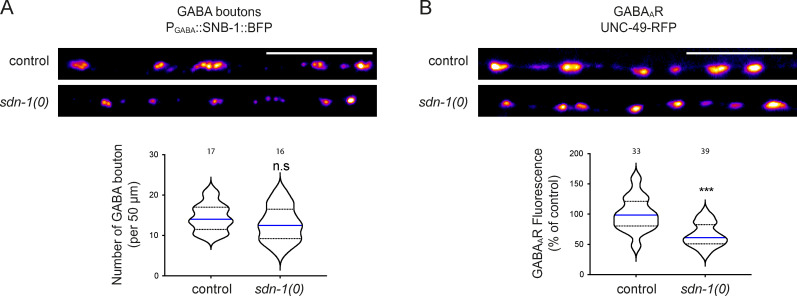
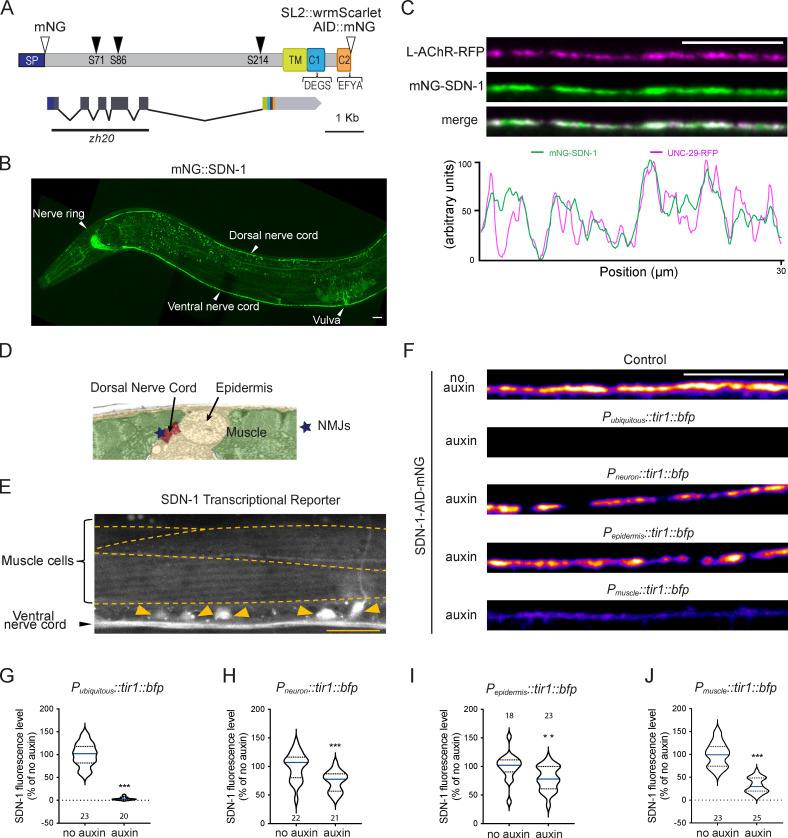
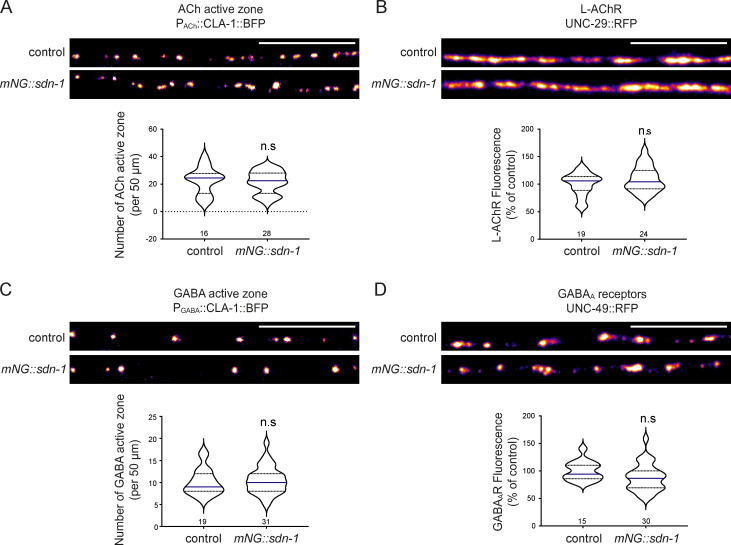
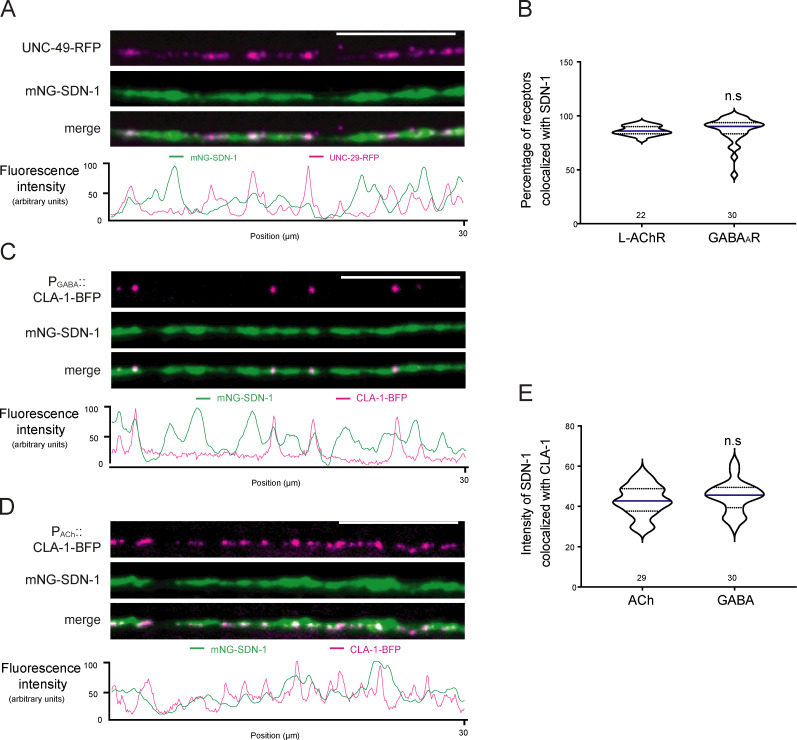
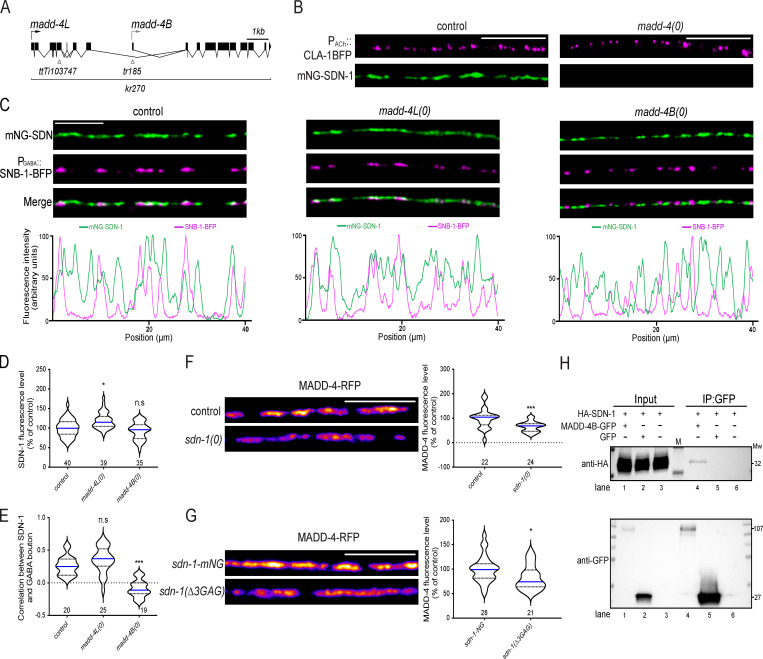
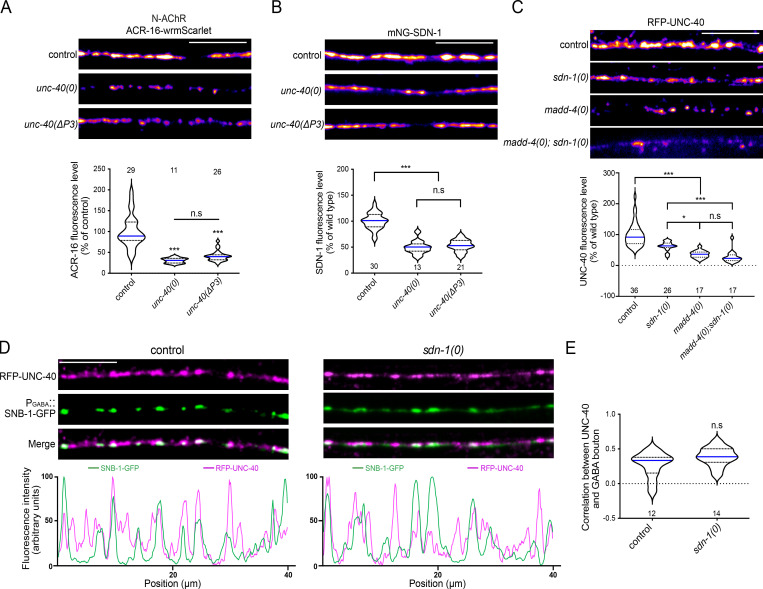
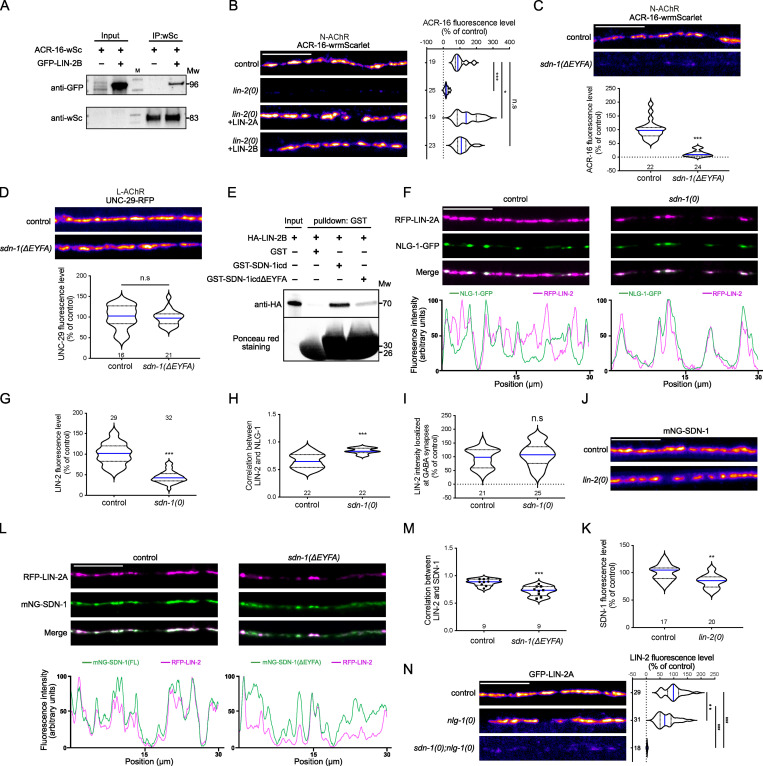
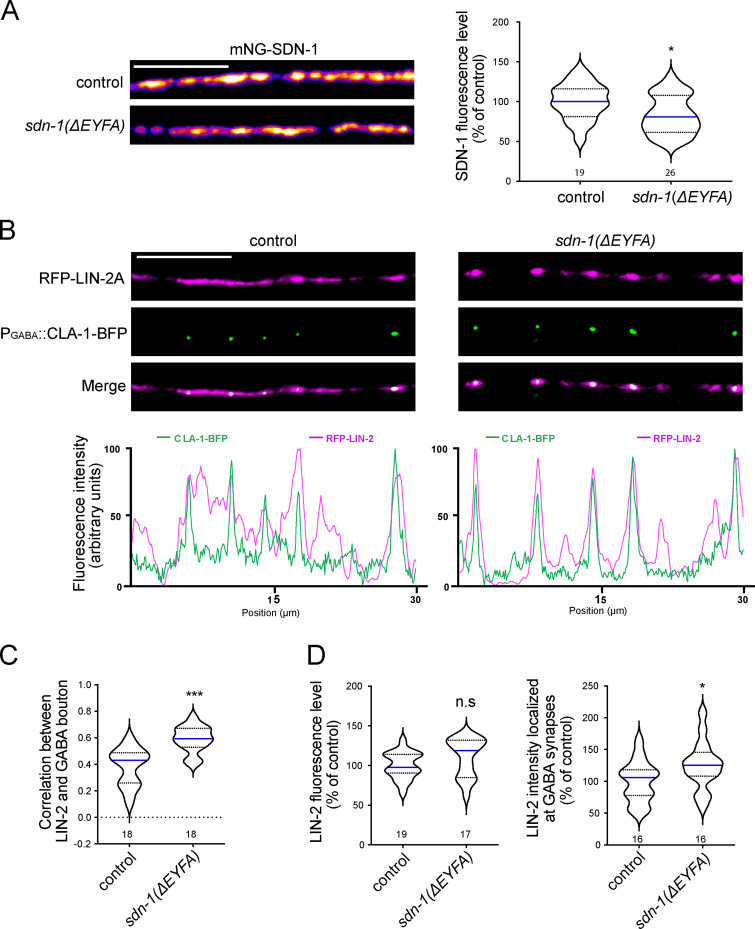
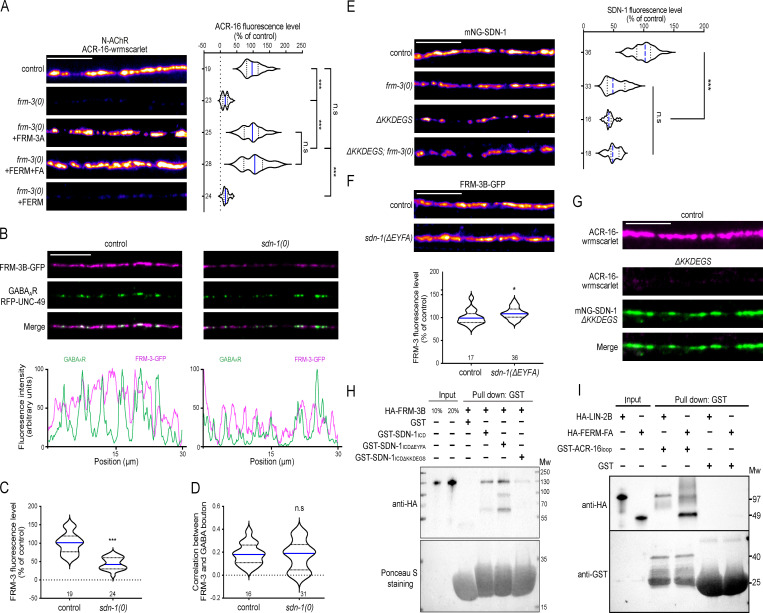
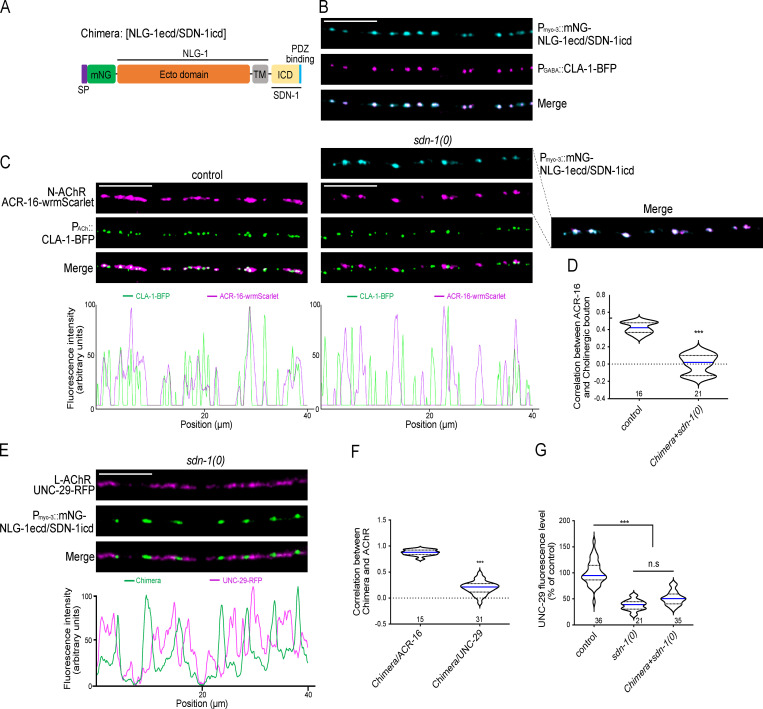
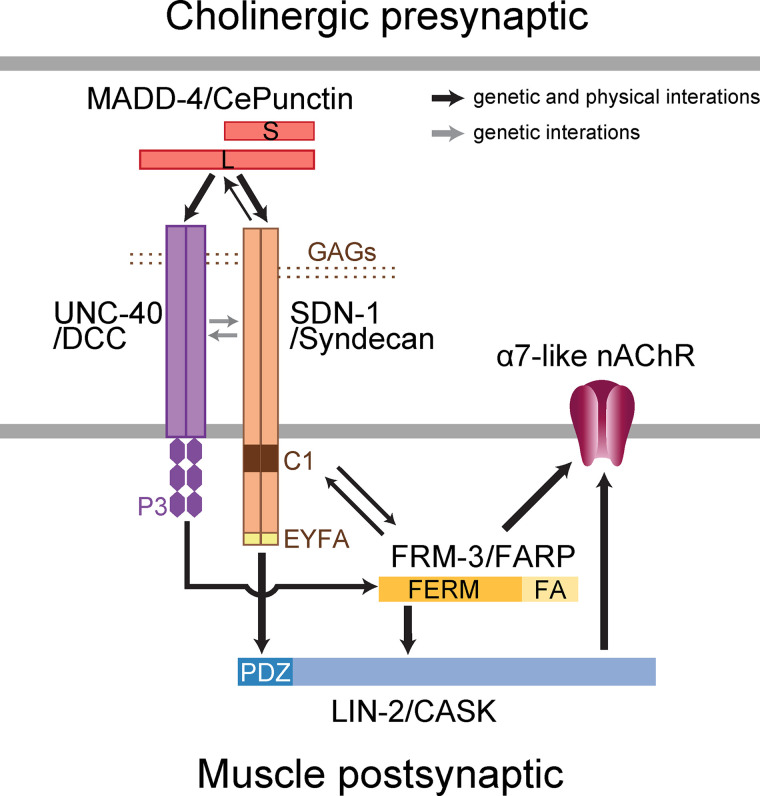
The extracellular matrix has emerged as an active component of chemical synapses regulating synaptic formation, maintenance, and homeostasis. The heparan sulfate proteoglycan (HSPG) syndecans are known to regulate cellular and axonal migration in the brain. They are also enriched at synapses, but their synaptic functions remain more elusive. Here, we show that SDN-1, the sole orthologue of syndecan in C. elegans, is absolutely required for the synaptic clustering of homomeric α7-like acetylcholine receptors (AChRs) and regulates the synaptic content of heteromeric AChRs. SDN-1 is concentrated at neuromuscular junctions (NMJs) by the neurally secreted synaptic organizer Ce-Punctin/MADD-4, which also activates the transmembrane netrin receptor DCC. Those cooperatively recruit the FARP and CASK orthologues that localize α7-like-AChRs at cholinergic NMJs through physical interactions. Therefore, SDN-1 stands at the core of the cholinergic synapse organization by bridging the extracellular synaptic determinants to the intracellular synaptic scaffold that controls the postsynaptic receptor content.


Figures

Figure 1.
Figure 1.
SDN-1 controls AChR synaptic content.(A) Schematics of neuromuscular innervations in C. elegans. Inset: Excitatory (cholinergic) and inhibitory (GABAergic) synapses innervating a muscle cell. DNC, dorsal nerve cord; VNC, ventral nerve cord. (B) Confocal detection and quantification of cholinergic active zones using the CLA-1-BFP marker under control of the Punc-17 promoter. (C and D) Confocal detection and quantification of L-AChR (UNC-29-RFP knock-in; C) and N-AChR (ACR-16-wrmScarlet knock-in; D) fluorescence. (E and F) Representative traces of isolated L-AChR (E) or total AChR (F) synaptic currents evoked by a 10-ms optogenetic stimulation (arrowheads) of cholinergic motoneurons. Isolation of L-AChR currents was achieved by blocking N-AChR with DHβE. (G and H) Representative traces and quantification of peak currents evoked by pressure application of 0.1 mM levamisole (G) or nicotine (H) on muscle cells. Arrowheads mark the 100-ms application onsets. Individual values are shown as dots in E and F. In this figure and all other figures, confocal images are sums of Z-stacks acquired along the dorsal nerve cord by a spinning disk confocal microscope; anterior is to the left. Scale bars, 10 µm (B–D). For the quantification of fluorescence levels, data were normalized to the mean value of the control group. In this figure and all other figures, data distribution in each group is presented as violin plots showing lower and upper quartiles (dotted lines) and median value (blue line). The number of animals analyzed is indicated on the violin plot. See also Fig. S1.
Figure S1.
Figure S1.
SDN-1 has a moderate effect on GABAAR synaptic content.(A) Confocal detection and quantification of the number of GABAergic presynaptic active zones, using the CLA-1-BFP marker under the control of Punc-47 promoter, in control and sdn-1(0) mutant animals. (B) Confocal detection and quantification of GABAARs (UNC-49-RFP knock-in) in control and sdn-1(0) animals. Scale bars, 10 µm.
Figure 2.
Figure 2.
SDN-1 is enriched at NMJs and is mainly provided by postsynaptic muscle cells.(A) Predicted structure of the SDN-1 protein (288 aa) and the sdn-1 locus (2,921 bp). SP, signal peptide; TM, transmembrane; C1, domain containing the ezrin-binding motif DEGS; C2, domain containing the PDZ-binding motif EFYA. Three putative GAG anchoring sites (black arrowheads) have been predicted on serine 71, 86, and 214. Open arrowheads indicate the insertion sites of fluorescent tags in knock-in strains: mNG, AID-mNG, and SL2::wormScarlet (transcriptional reporter SL2-wrmScarlet). The black line shows the location of the 1,258-bp deletion in sdn-1(zh20) mutant allele, referred to as sdn-1(0). Boxes represent exons. (B) Confocal detection of mNG-SDN-1 in an adult worm. (C) Confocal detection and fluorescence profiles of mNG-SDN-1 and L-AChRs (UNC-29-RFP) along the dorsal cord. (D) Electronic microscopy image of the dorsal part of a C. elegans coronal section. Modified from SW-Worm Viewer, slice 273 (Altun et al., 2021; http://www.wormatlas.org/SW/SW.php). (E) Confocal detection of the transcriptional reporter SDN-1::SL2::wrmScarlet. Arrowheads indicate cell bodies of motor neurons. Dotted lines delineate borders of body-wall muscle cells. (F) Confocal detection of SDN-1-AID-mNG from dorsal nerve cord in animals grown in the absence (control) or presence of auxin to induce SDN-1 depletion in all tissues (Peft-3::tir-1-bfp), neurons (Prab-3::tir-1-bfp), epidermis (Pdpy-7::tir-1-bfp), or body-wall muscles (Pmyo-3::tir-1-bfp). (G–J) Quantification of SDN-1-AID-mNG fluorescence levels when SDN-1 was depleted in all tissues (G), epidermis (H), neurons (I), or body-wall muscles (J). Scale bars, 10 µm. See also Figs. S2, S3, and S4.
Figure S2.
Figure S2.
mNG insertion in the sdn-1 locus has no effect on NMJ organization.(A) Confocal detection and quantification of the number of cholinergic presynaptic active zones, using the CLA-1-BFP marker under the control of Punc-17 promoter, in control and mNG-sdn-1 knock-in animals. (B) Confocal detection and quantification of L-AChRs (UNC-29-RFP) in control and mNG-sdn-1 animals. (C) Confocal detection and quantification of the number of GABAergic active zones, using the CLA-1-BFP marker under Punc-47 promoter, in control and mNG-sdn-1 animals. (D) Confocal detection and quantification of GABAARs (UNC-49-RFP) in control and mNG-sdn-1 animals. Scale bars, 10 µm.
Figure S3.
Figure S3.
SDN-1 is equally abundant at excitatory and inhibitory synapses.(A) Confocal detection and fluorescence profiles of mNG-SDN-1 and GABAARs (UNC-49-RFP) along the dorsal cord. (B) Percentage of L-AChRs and GABAARs colocalized with mNG-SDN-1, calculated using Manders’ coefficient on processed images. (C and D) Confocal detection and fluorescence profiles of mNG-SDN-1 and the presynaptic active zone marker CLA-1-BFP under the control of either the GABAergic neuron-specific promoter Punc-47 (C) or the cholinergic neuron-specific promoter Punc-17 (D). (E) Mean intensity of the mNG-SDN-1 signal at cholinergic and GABAergic synapses. Scale bars, 10 µm.
Figure S4.
Figure S4.
The AID leads to tissue-specific degradation. Confocal detection of AID-GFP expressed in all tissues by the ubiquitous promoter Peft-3 from animals grown on regular NGM plates (control; left panels) or auxin plates (right panels). Tissue-specific degradation was achieved by coexpressing Peft-3::AID-GFP and Peft-3::tir-1-bfp (ubiquitous), Pdpy-7::tir-1-bfp (epidermis), Pmyo-3::tir-1-bfp (body-wall muscles), or Prab-3::tir-1-bfp (neurons). Arrowheads indicate the position of the nerve ring. Scale bars, 10 µm.
Figure 3.
Figure 3.
HS chains modulate SDN-1 synaptic content.(A) Black arrowheads indicate the position of putative GAG chain anchoring serines in SDN-1. Serines were mutated to alanines to generate ΔGAG mutants. Open arrowhead indicates the insertion site of AID::mNG fluorescence tag. (B) Western blot analysis (anti-mNG) of nonmutated SDN-1-mNG (lane 2), SDN-1(Δ3GAG)-mNG (lane 3), SDN-1(Δ2GAG)-mNG (lane 4), or SDN-1(Δ1GAG)-mNG (lane 5) proteins precipitated from worm lysate using mNG beads. Expected SDN-1-mNG molecular weight is 58 kD. Bracket likely indicates the SDS-resistant dimerization form of SDN-1. Arrowhead indicates potential cleaved C terminus–mNG band. Protein samples from lane 6 (shown in red) were digested by heparinase I and III. Protein lysate from N2 wild-type animals was used as control in lane 1. (C) Confocal detection and quantification of SDN-1 levels from SDN-1-mNG and ΔGAG mutants. Scale bar, 10 µm.
Figure 4.
Figure 4.
Ce-Punctin/MADD-4 localizes SDN-1 at synapses.(A) Structure of the madd-4 locus. Boxes represent exons. Arrows indicate the beginning of the ORF of madd-4L and madd-4B. Localization of isoform specific mutations (ttTi103747 and tr185) and full knockout (kr270), referred to as madd-4(0), are indicated. (B) Confocal detection of mNG-SDN-1 and cholinergic active zones (CLA-1-BFP). (C) Confocal detection and fluorescence profiles of mNG-SDN-1 and GABAergic boutons using the SNB-1-BFP marker driven by the Punc-47 promoter. (D) Quantification of mNG-SDN-1 fluorescence levels. (E) Pearson’s correlation coefficient between mNG-SDN-1 and GABA boutons. (F and G) Confocal detection and quantification of MADD-4-RFP fluorescence. (H) Coimmunoprecipitation of SDN-1 and MADD-4B expressed in HEK293 cells. Cells were transfected with HA-SDN-1 alone (lanes 3 and 6), MADD-4B-GFP (lanes 1 and 4), or GFP (lanes 2 and 5). Cell lysates were precipitated by GFP nanobody beads and probed with anti-HA antibody (upper). The expression of GFP was detected using anti-GFP antibody (lower). M, protein ladder. Molecular weight (Mw) is shown on the right. Scale bars, 10 µm.
Figure 5.
Figure 5.
UNC-40 promotes the synaptic localization of ACR-16 and SDN-1.(A and B) Confocal detection and quantification of ACR-16-wrmScarlet (A) and mNG-SDN-1 (B) fluorescence. (C) Confocal detection and quantification of RFP-UNC-40 driven by the muscle-specific Pmyo-3 promoter. (D) Confocal detection and fluorescent profiles of RFP-UNC-40 and GABA boutons using the SNB-1-GFP marker driven by the Punc-25 promoter. (E) Pearson’s correlation coefficient between RFP-UNC-40 and GABA boutons. Scale bars, 10 µm.
Figure 6.
Figure 6.
SDN-1 recruits LIN-2/CASK at cholinergic synapses to cluster α7-like N-AChRs.(A) Coimmunoprecipitation analysis of the interaction between LIN-2B and ACR-16. The worm lysates of animals expressing ACR-16-wrmScarlet with or without coexpression of GFP-LIN-2B in muscle were precipitated by wrmScarlet nanobody beads and detected by anti-GFP or anti-wrmScarlet antibodies. (B) Confocal detection and quantification of ACR-16-wrmScarlet in control, lin-2(0), and lin-2(0) animals expressing GFP-LIN-2A or GFP-LIN-2B driven by the muscle-specific Pmyo-3 promoter. (C and D) Confocal detection and quantification of ACR-16-wrmScarlet (A) or UNC-29-RFP (B) fluorescence levels in control and sdn-1(ΔEYFA) animals that carry a mutation deleting the SDN-1 C-terminal PDZ-binding motif. (E) GST pull-down analysis of LIN-2B interaction with the entire intracellular part of SDN-1 (SDN-1ICD) or after deleting the PDZ-binding motif (SDN-1ICD ΔEFYA). Samples were analyzed using an anti-HA antibody. The same membrane was stained with Ponceau S red to show GST expression. Molecular weights (Mw) are shown on the right. (F) Confocal detection and fluorescence profiles of RFP-LIN-2A and NLG-1-GFP in control and sdn-1(0) animals expressing rfp-lin-2a and nlg-1-gfp driven by the muscle-specific promoter Pmyo-3. (G) Quantification of the fluorescence levels of RFP-LIN-2A at the dorsal nerve cord. (H) Pearson’s correlation coefficient between RFP-LIN-2A and NLG-1-GFP fluorescence. (I) Fluorescence levels of RFP-LIN-2A at GABA synapses. RFP-LIN-2A fluorescence level was quantified in GABA synaptic regions as defined by the presence of the NLG-1-GFP marker (see Material and methods for details). (J and K) Confocal detection (J) and quantification (K) of mNG-SDN-1. (L) Confocal detection and fluorescence profiles of RFP-LIN-2A and mNG-SDN-1 full length (control) or lacking the PDZ-binding motif (sdn-1(ΔEYFA)) in animals expressing rfp-lin-2a driven by the muscle-specific promoter Pmyo-3. (M) Pearson’s correlation coefficient between RFP-LIN-2A and mNG-SDN-1 full length or mNG-SDN-1 (ΔEYFA). Individual values are shown as dots. (N) Confocal detection and quantification of LIN-2A-GFP. Scale bars, 10 µm.
Figure S5.
Figure S5.
LIN-2 is concentrated at GABA synapses in animals lacking SDN-1 PDZ-binding motif.(A) Confocal detection and quantification of mNG-SDN-1 fluorescence levels in control (mNG-sdn-1) and mNG-sdn-1(ΔEYFA) animals. (B) Confocal detection and fluorescence profiles of RFP-LIN-2A, expressed under the muscle-specific Pmyo-3 promoter, and GABAergic presynaptic active zones, using the CLA-1-BFP marker under Punc-47 promoter, in control and sdn-1(ΔEYFA) animals. (C) Pearson’s correlation coefficient between RFP-LIN-2A and GABAergic active zones in control and sdn-1(ΔEYFA) animals. (D) Fluorescence levels of RFP-LIN-2A along the dorsal nerve cord (left) or at GABA synapses (right) in control and sdn-1(ΔEYFA) animals. Total fluorescence (left panel) was measured as for other figures. To measure fluorescence specifically at GABA synapses, RFP-LIN-2A fluorescence was measured within GABA regions, which were defined by the presence of the Punc-47::cla-1-bfp marker. Scale bars, 10 µm.
Figure 7.
Figure 7.
FRM-3/FARP bridges α7-like N-AChRs with LIN-2/CASK and SDN-1.(A) Confocal detection and quantification of ACR-16-wrmScarlet in control, frm-3(0) and frm-3(0) animals expressing full length FRM-3A-GFP, FERM-FA-GFP or FERM-GFP truncations driven by the muscle-specific Pmyo-3 promoter. (B) Confocal detection and fluorescent profiles of GABAARs (RFP-UNC-49) and FRM-3B-GFP in control and sdn-1(0) animals expressing frm-3b-gfp driven by the muscle-specific promoter Pmyo-3. (C) Quantification of FRM-3B-GFP fluorescence level. (D) Pearson’s correlation coefficient between FRM-3B-GFP and GABA bouton. (E) Confocal detection and quantification of mNG-SDN-1 full length or lacking the KKDEGS motif (ΔKKDEGS). (F) Confocal detection and quantification of FRM-3B-GFP in control and sdn-1(ΔEYFA) animals expressing frm-3b-gfp under the control of the muscle-specific promoter Pmyo-3. (G) Confocal detection of ACR-16-wrmScarlet in control or in mNG-SDN-1 knock-in animals lacking the KKDEGS motif. (H) GST pull-down analysis of the binding between HA-tagged FRM-3B and SDN-1ICD, PDZ-binding motif deletion (SDN-1ICDΔEYFA), C1 motif deletion (SDN-1ICDΔKKDEGS) by immunoblotting using anti-HA antibody. The same membrane was stained by Ponceau red to show GST expression. Molecular weights (Mw) are shown on the right. (I) GST pull-down analysis of ACR-16 TM3-TM4 cytosolic loop binding with HA tagged LIN-2B or FERM-FA domain of FRM-3 by immunoblotting using anti-HA antibody. The same membrane was probed by anti-GST antibody to show GST expression. Molecular weight (Mw) is shown on the right. Scale bars, 10 µm.
Figure 8.
Figure 8.
SDN-1ICD recruits N-AChR to GABA synapses.(A) Structure of the chimeric protein containing the NLG-1 ecto- and transmembrane (TM) domains and the SDN-1ICD. mNG tag was inserted immediately after the signal peptide (SP). The PDZ-binding motif of SDN-1 is shown in blue. (B) Confocal detection of mNG-NLG-1ECD/SDN-1ICD expression driven by the muscle-specific promoter Pmyo-3 and of the presynaptic marker CLA-1-BFP driven by the GABAergic neuron-specific promoter Punc-47. (C) Confocal detection and fluorescent profiles of ACR-16-wrmScarlet and cholinergic active zone marker CLA-1-BFP. NLG-1ECD/SDN-1ICD was expressed under the muscle-specific promoter Pmyo-3 in sdn-1(0) mutant animals. (D) Pearson’s correlation coefficient between N-AChRs (ACR-16-wrmScarlet) and cholinergic boutons. (E) Confocal detection and fluorescent profiles of L-AChRs (UNC-29-RFP) and mNG-NLG-1ECD/SDN-1ICD driven by the muscle-specific promoter Pmyo-3 in sdn-1(0) mutants. (F) Pearson’s correlation coefficient between the chimera and N-AChRs (ACR-16-wrmScarlet) or L-AChRs (UNC-29-RFP) in sdn-1(0) mutants. (G) Quantification of UNC-29-RFP in control, sdn-1(0), and sdn-1(0) animals expressing the chimera specifically in muscle. Scale bars, 10 µm.
Figure 9.
Figure 9.
Working model for N-AChR clustering at NMJs. See Discussion for details.

Similar articles

Cited by

References

    1. Alexander, M., Chan K.K.M., Byrne A.B., Selman G., Lee T., Ono J., Wong E., Puckrin R., Dixon S.J., and Roy P.J.. 2009. An UNC-40 pathway directs postsynaptic membrane extension in Caenorhabditis elegans. Development. 136:911–922. 10.1242/dev.030759 - DOI - PubMed
    1. Alkondon, M., Pereira E.F., Barbosa C.T., and Albuquerque E.X.. 1997. Neuronal nicotinic acetylcholine receptor activation modulates gamma-aminobutyric acid release from CA1 neurons of rat hippocampal slices. J. Pharmacol. Exp. Ther. 283:1396–1411. - PubMed
    1. Allen, N.J., Bennett M.L., Foo L.C., Wang G.X., Chakraborty C., Smith S.J., and Barres B.A.. 2012. Astrocyte glypicans 4 and 6 promote formation of excitatory synapses via GluA1 AMPA receptors. Nature. 486:410–414. 10.1038/nature11059 - DOI - PMC - PubMed
    1. Altun, Z.F., Crocker C., and Hall D.H. 2021. Handbook of C. Elegans Anatomy. In WormAtlas.
    1. Apte, S.S.2009. A disintegrin-like and metalloprotease (reprolysin-type) with thrombospondin type 1 motif (ADAMTS) superfamily: functions and mechanisms. J. Biol. Chem. 284:31493–31497. 10.1074/jbc.R109.052340 - DOI - PMC - PubMed

Publication types

MeSH terms