. 2021 Jul 21;12(14):2661-2678.
doi: 10.1021/acschemneuro.1c00149. Epub 2021 Jul 2.

Kratom Alkaloids as Probes for Opioid Receptor Function: Pharmacological Characterization of Minor Indole and Oxindole Alkaloids from Kratom

Affiliations

Kratom Alkaloids as Probes for Opioid Receptor Function: Pharmacological Characterization of Minor Indole and Oxindole Alkaloids from Kratom

Soumen Chakraborty et al. ACS Chem Neurosci. .

Abstract

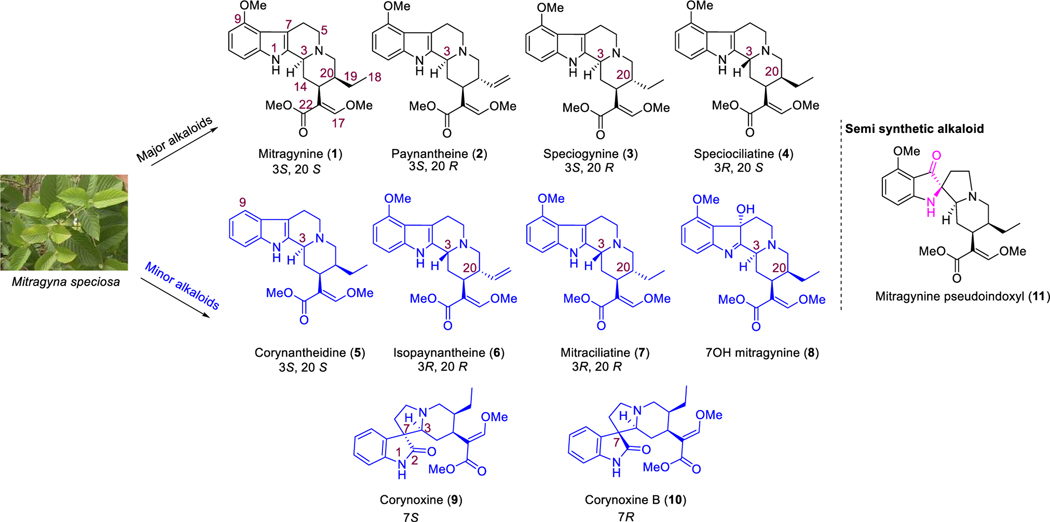
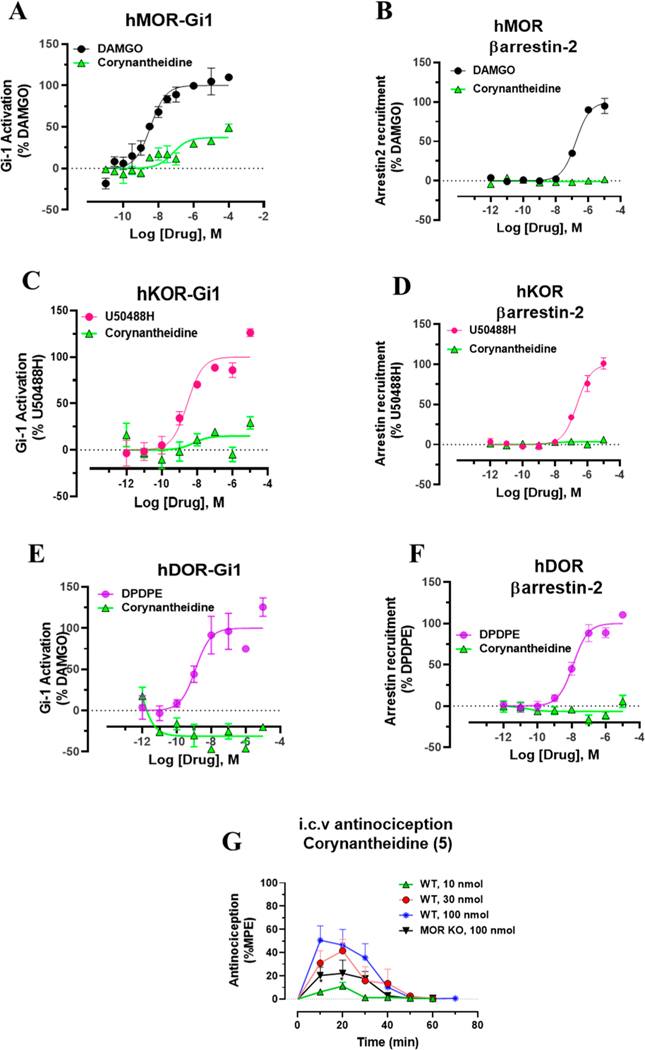
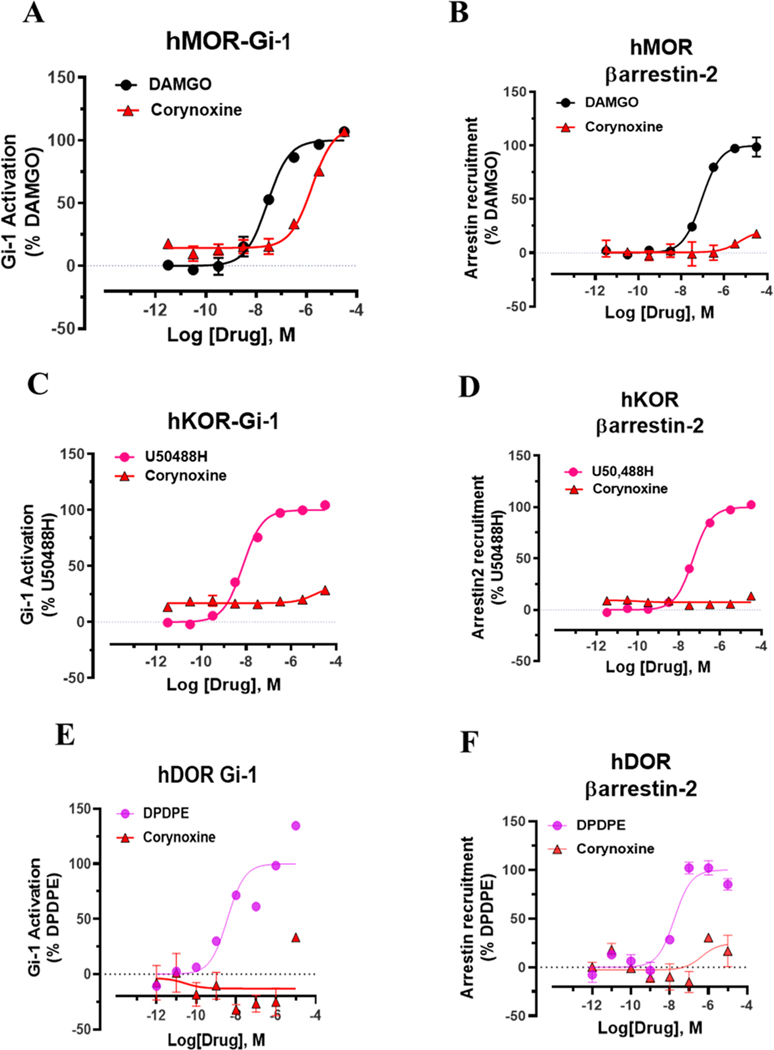
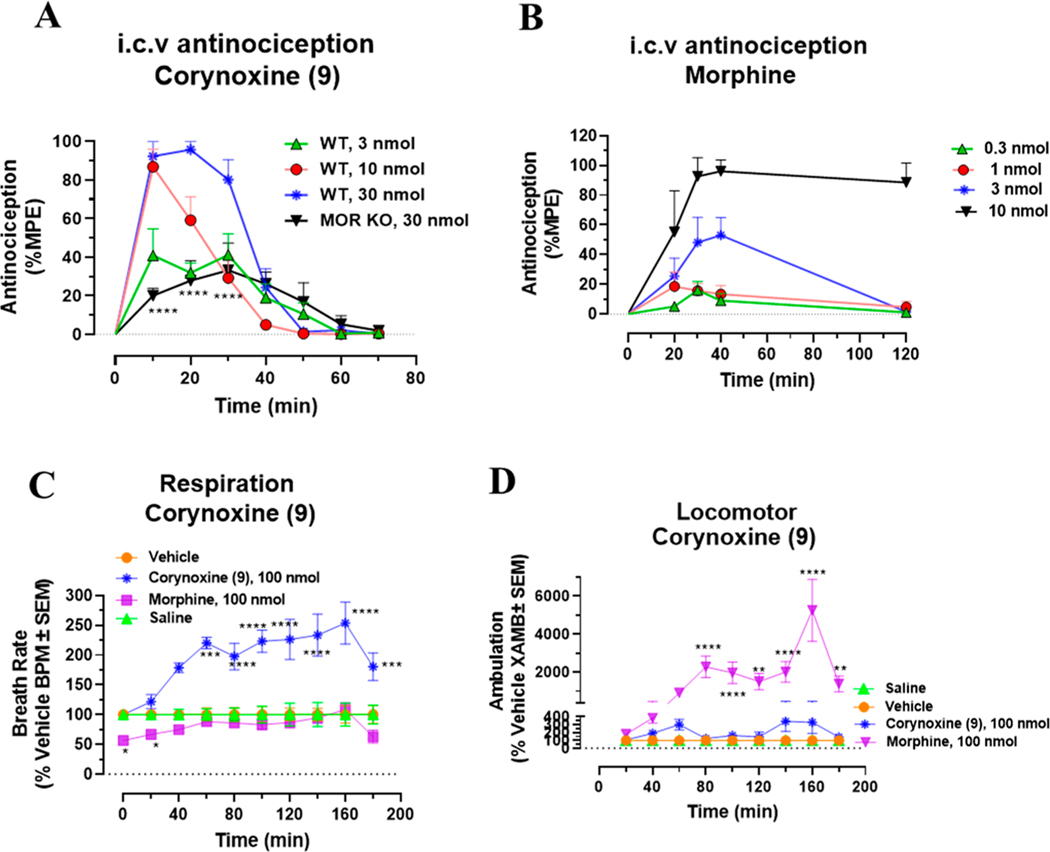
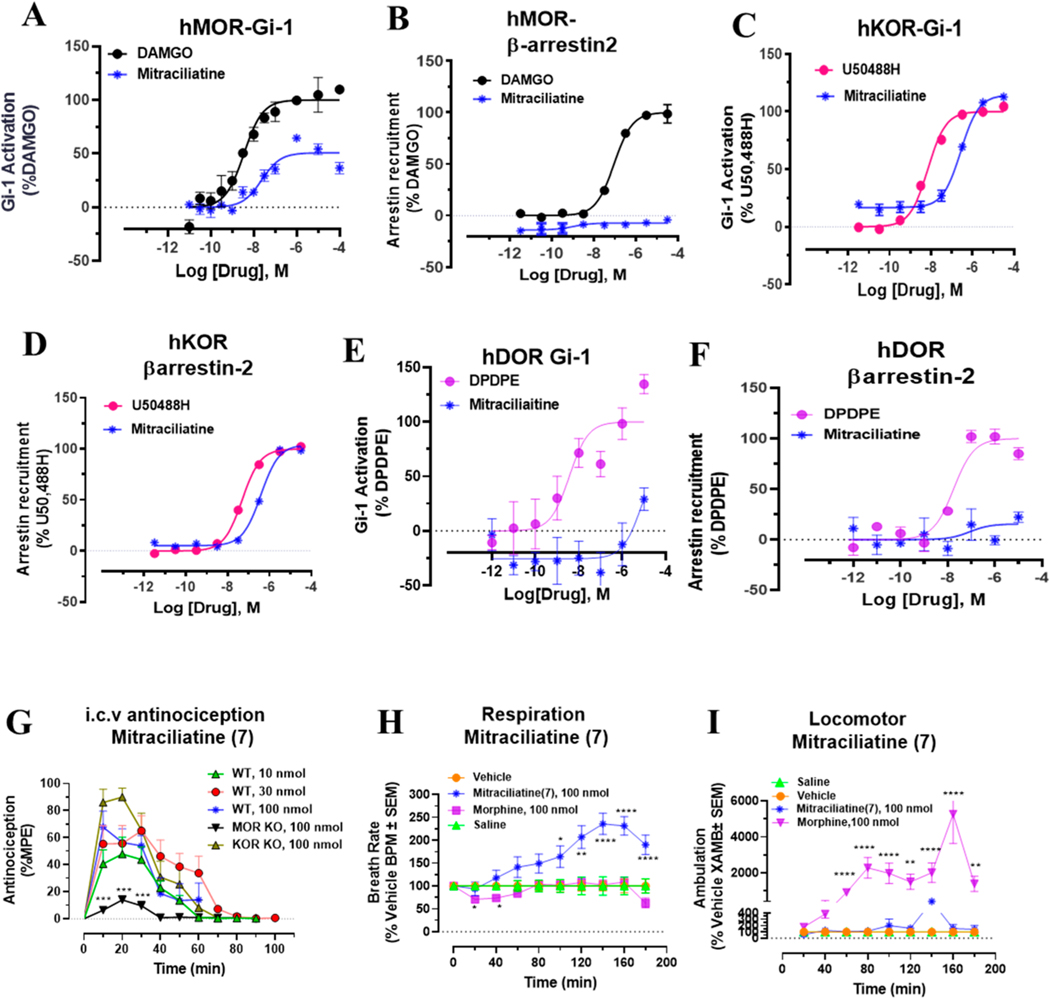
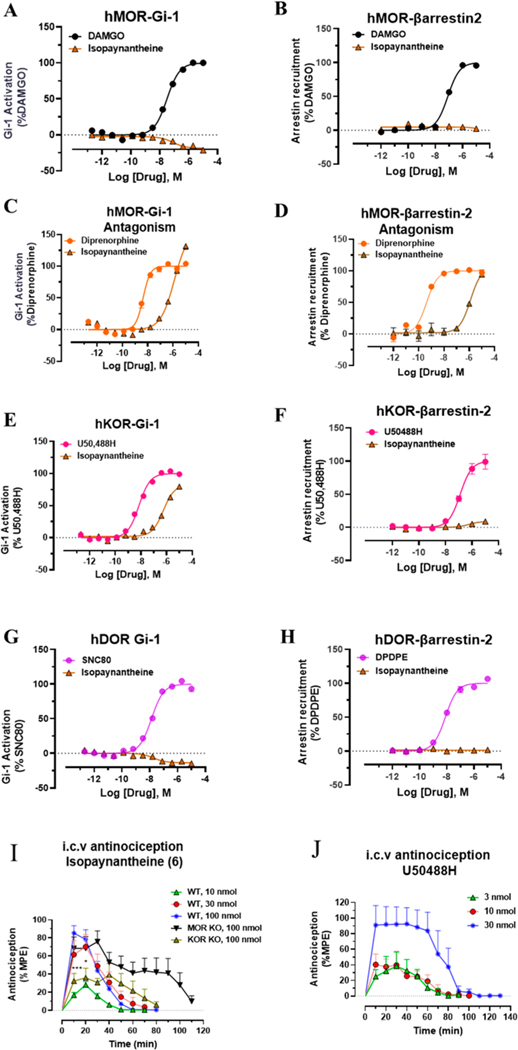
Dry leaves of kratom (mitragyna speciosa) are anecdotally consumed as pain relievers and antidotes against opioid withdrawal and alcohol use disorders. There are at least 54 alkaloids in kratom; however, investigations to date have focused around mitragynine, 7-hydroxy mitragynine (7OH), and mitragynine pseudoindoxyl (MP). Herein, we probe a few minor indole and oxindole based alkaloids, reporting the receptor affinity, G-protein activity, and βarrestin-2 signaling of corynantheidine, corynoxine, corynoxine B, mitraciliatine, and isopaynantheine at mouse and human opioid receptors. We identify corynantheidine as a mu opioid receptor (MOR) partial agonist, whereas its oxindole derivative corynoxine was an MOR full agonist. Similarly, another alkaloid mitraciliatine was found to be an MOR partial agonist, while isopaynantheine was a KOR agonist which showed reduced βarrestin-2 recruitment. Corynantheidine, corynoxine, and mitraciliatine showed MOR dependent antinociception in mice, but mitraciliatine and corynoxine displayed attenuated respiratory depression and hyperlocomotion compared to the prototypic MOR agonist morphine in vivo when administered supraspinally. Isopaynantheine on the other hand was identified as the first kratom derived KOR agonist in vivo. While these minor alkaloids are unlikely to play the majority role in the biological actions of kratom, they represent excellent starting points for further diversification as well as distinct efficacy and signaling profiles with which to probe opioid actions in vivo.

Keywords: Respiration; corynoxine; kratom; mitraciliatine; oxindoles; partial agonism.


Conflict of interest statement

The authors declare the following competing financial interest(s): S.M. is a co-founder of Sparian Inc. S.M. is an inventor on patent applications related to mitragynine analogues, which may lead to royalties or other licensing revenues from future commercial products.

Figures

Figure 1.
Figure 1.
Chemical structures and configurations at C3 and C20 of select indole and oxindole moiety based kratom alkaloids.
Figure 2.
Figure 2.
G-protein and βarrestin-2 signaling of Corynantheidine at opioid receptors and dose dependent antinociception time course of Corynantheidine. Corynantheidine shows MOR selective G-protein signaling while lacking measurable βarrestin-2 recruitment. (A) Gi-1 activation measured using BRET assays at hMOR. Corynantheidine is a hMOR partial agonist. DAMGO EC50 (nM) (pEC50 ± SEM) = 3.56 (8.45 ± 0.13) nM, Emax% ± SEM = 100 ± 4.17. Corynantheidine EC50 (nM) (pEC50 ± SEM) = 67.2 (7.17 ± 0.29) nM, Emax% ± SEM = 37.2 ± 4.30. (B) No measurable βarrestin-2 recruitment was observed in BRET assays of corynantheidine at hMOR. DAMGO EC50 (nM) (pEC50 ± SEM) = 172.89 (6.76 ± 0.08) nM, Emax% ± SEM = 100 ± 3.48. Corynantheidine EC50 (nM) (pEC50 ± SEM) = not determined (n.d.), Emax% ± SEM = <20. (C) Gi-1 activation in BRET assay of corynantheidine at hKOR. U50488H EC50 (nM) (pEC50 ± SEM) = 2.8 (8.55 ± 0.21) nM, Emax% ± SEM = 100 ± 5.89. Corynantheidine EC50 (nM) (pEC50 ± SEM) = n.d., Emax% ± SEM = <20. (D) No measurable βarrestin-2 recruitment was observed in BRET assays of corynantheidine at hKOR. U50488H EC50 (nM) (pEC50 ± SEM) = 229.54 (6.64 ± 0.11) nM, Emax% ± SEM = 100 ± 4.63. Corynantheidine EC50 (nM) (pEC50 ± SEM) = n.d., Emax% ± SEM = <20. (E) Gi-1 activation in BRET assay of corynantheidine at hDOR. DPDPE EC50 (nM) (pEC50 ± SEM) = 1.23 (8.91 ± 0.28) nM, Emax% ± SEM = 100 ± 11.69. Corynantheidine EC50 (nM) (pEC50 ± SEM) = n.d., Emax% ± SEM = <20%. (F) No measurable βarrestin-2 recruitment was observed in BRET assays of corynantheidine at hDOR. DPDPE EC50 (nM) (pEC50 ± SEM) = 12.28 (7.91 ± 0.12) nM, Emax% ± SEM = 100 ± 4.08. Corynantheidine EC50 (nM) (pEC50 ± SEM) = n.d., Emax% ± SEM = <20. n.d. = not determined. Data from both Gi-1 activation and βarrestin-2 assays using human opioid receptors were normalized to Emax of the corresponding controls, DAMGO, U50,488H, and DPDPE. The data were processed in GraphPad Prism using a three-parameter logistic equation to fit the dose response curves. Mean EC50 (pEC50 ± SEM) represents the data for assays run in triplicate (n = 3). See Table S1 for values. (G) Time course of tail withdrawal antinociception of corynantheidine: Groups of C57BL/6J mice (n = 8 each group) received (i.c.v) corynantheidine, and antinociceptive response was measured at doses of 10, 30, and 100 nmol in WT mice at the indicated time points using the 55 °C tail withdrawal assay. Each point represents mean% antinociception ± SEM corynantheidine displayed potent dose dependent antinociceptive response. Attenuated effect of antinociception of corynantheidine (100 nmol, i.c.v.) was observed in MOR KO mice at 10–20 min (*p = 0.05, unpaired t test per row corrected for multiple comparisons using Holm-Sidak method).
Figure 3.
Figure 3.
G-protein and βarrestin-2 signaling of corynoxine at opioid receptors. Corynoxine shows MOR selective G-protein signaling while not recruiting βarrestin-2. (A) Gi-1 activation measured using BRET assays at hMOR. Corynoxine is a full agonist at hMOR compared to DAMGO. DAMGO EC50 (nM) (pEC50 ± SEM) = 28.12 (7.55 ± 0.08) nM, Emax% ± SEM = 100 ± 2.78. Corynoxine EC50 (nM) (pEC50 ± SEM) = 1630 (5.79 ± 0.09) nM, Emax% ± SEM = 96.54 ± 4.69. (B) No measurable βarrestin-2 recruitment was observed in BRET assays of corynoxine at hMOR. DAMGO EC50 (nM) (pEC50 ± SEM) = 90.6 (7.04 ± 0.07) nM, Emax% ± SEM = 100 ± 2.29. Corynoxine EC50 (nM) (pEC50 ± SEM) = n.d. Emax% ± SEM < 20%. (C) Gi-1 activation measured using BRET assays at hKOR. U50488H EC50 (nM) (pEC50 ± SEM) = 6.93 (8.16 ± 0.06) nM, Emax% ± SEM = 100 ± 1.61. Corynoxine EC50 (nM) (pEC50 ± SEM) = n.d. Emax% ± SEM < 20%. (D) No measurable βarrestin-2 recruitment was observed in BRET assays of corynoxine at hKOR. U50488H EC50 (nM) (pEC50 ± SEM) = 48.95 (7.31 ± 0.04) nM, Emax% ± SEM = 100 ± 1.47. Corynoxine EC50 (nM) (pEC50 ± SEM) = n.d., Emax% ± SEM < 20. (E) Gi-1 activation measured using BRET assays at hDOR. DPDPE EC50 (nM) (pEC50 ± SEM) = 3.65 (8.43 ± 0.37) nM, Emax% ± SEM = 100 ± 14.51. Corynoxine EC50 (nM) (pEC50 ± SEM) = n.d. Emax% ± SEM < 20%. (F) No measurable βarrestin-2 recruitment was observed in BRET assays of corynoxine at hDOR. DPDPE EC50 (nM) (pEC50 ± SEM) = 17.69 (7.75 ± 0.17) nM, Emax% ± SEM = 100 ± 5.8. Corynoxine EC50 (nM) (pEC50 ± SEM) = n.d., Emax% ± SEM < 20. n.d. = not determined. Data from both Gi-1 activation and βarrestin-2 assays using human opioid receptors were normalized to Emax of the corresponding controls, DAMGO, U50,488H, and DPDPE. The data were processed in GraphPad Prism using a three-parameter logistic equation to fit the dose response curves. Mean EC50 (pEC50 ± SEM) represents the data for assays run in triplicate (n = 3). See Table S1 for values.
Figure 4.
Figure 4.
Dose dependent antinociception time course, respiratory depression, and locomotor effects of corynoxine. Corynoxine shows MOR dependent antinociception. Attenuated respiratory depression and locomotor effects were observed for corynoxine at equianalgesic morphine doses. (A) Time course of tail withdrawal antinociception of corynoxine: Groups of C57BL/6J mice (n = 8 each group) received (i.c.v.) corynoxine, and antinociceptive response was evaluated at doses of 3, 10, and 30 nmol in WT mice at the indicated time points using the 55 °C tail withdrawal assay. Each point represents mean% antinociception ± SEM. Corynoxine exhibited potent potent dose dependent antinociceptive response. Reduced effect of antinociception of corynoxine (30 nmol, i.c.v.) was observed in MOR KO mice at 10–30 min (****p < 0.0001, unpaired t test per row corrected for multiple comparisons using Holm-Sidak method). (B) Antinociception time course of Morphine: Groups of C57BL/6J mice (n = 8 each group) received (i.c.v.) morphine, and antinociceptive response was evaluated at doses of 0.3, 1, 3, and 10 nmol in WT mice at the indicated time points using the 55 °C tail withdrawal assay. Each point represents mean% antinociception ± SEM. (C) Respiratory rate corynoxine: Groups of mice received either vehicle (n = 12), saline (n = 12), morphine (100 nmol, i.c.v.; n = 12), or corynoxine (100 nmol, i.c.v.; n = 12), and the measurement of breath rates was done every 20 min for 180 min. Corynoxine showed an increase in breath rates at 60 min (***p = 0.0002), 80–160 min (****p < 0.0001), and 180 min (***p = 0.001) compared to those of the vehicle, while morphine decreased breadth rates at 20–40 min (*p = 0.0387). The p values were calculated by 2-way ANOVA followed by Dunnett’s multiple-comparison test. (D) Locomotor effect of corynoxine: Groups of mice received either vehicle (n = 24), saline (n = 12), morphine (100 nmol, i.c.v.; n = 12), or corynoxine (100 nmol, i.c.v.; n = 12), and the distance traveled by charcoal for each group of mice was measured. Corynoxine showed no significant hyperlocomotion compared to that of the vehicle as determined by 2-way ANOVA followed by Dunnett’s multiple-comparison test. However, significant locomotor effect was observed for morphine at 80–100 min (****p < 0.0001), 120 min (**p = 0.0038), 140–160 min (****p < 0.0001), and 180 min (**p = 0.0093) compared to that of the vehicle. The p values were calculated by 2-way ANOVA followed by Dunnett’s multiple-comparison test.
Figure 5.
Figure 5.
G-protein and βarrestin-2 signaling, antinociception time course, respiratory depression, and locomotor effects of mitraciliatine. Mitraciliatine shows agonism at hMOR and hKOR while showing differential βarrestin-2 signaling at the same subtypes. Mitraciliatine shows MOR dependent antinociception. Attenuated respiratory depression and locomotor effects were observed for mitraciliatine at equianalgesic morphine doses. (A) Gi-1 activation measured using BRET assays at hMOR. Mitracilliatine shows G-protein signaling at hMOR while showing no βarrestin-2 signaling, compared to DAMGO. DAMGO EC50 (nM) (pEC50 ± SEM) = 3.56 (8.45 ± 0.13) nM, Emax% ± SEM = 100 ± 4.17. Mitraciliatine EC50 (nM) (pEC50 ± SEM) = 23.69 (7.62 ± 0.16) nM, Emax% ± SEM = 50.7 ± 3.22. (B) No measurable βarrestin-2 recruitment was observed in BRET assays of mitracilatine at hMOR. DAMGO EC50 (nM) (pEC50 ± SEM) = 90.6 (7.04 ± 0.07) nM, Emax% ± SEM = 100 ± 2.29. Mitraciliatine EC50 (nM) (pEC50 ± SEM) = n.d., Emax% ± SEM < 20. (C) Gi-1 activation measured using BRET assays at hKOR. Mitracilliatine shows G-protein signaling at hKOR as well as robust βarrestin-2 signaling at hKOR. U50488H EC50 (nM) (pEC50 ± SEM) = 6.93 (8.16 ± 0.06) nM, Emax% ± SEM = 100 ± 1.61. Mitraciliatine EC50 (nM) (pEC50 ± SEM) = 269.19 (6.57 ± 0.06) nM, Emax% ± SEM = 114.32 ± 2.42. (D) Significant βarrestin-2 recruitment was observed in BRET assays of mitracilatine at hKOR. U50488H EC50 (nM) (pEC50 ± SEM) = 48.95 (7.31 ± 0.04) nM, Emax% ± SEM = 100 ± 1.47. Mitraciliatine EC50 (nM) (pEC50 ± SEM) = 383.12 (6.42 ± 0.06) nM, Emax% ± SEM = 104.13 ± 2.57. (E) Gi-1 activation measured using BRET assays at hDOR. Mitraciliatine did not show G-protein or βarrestin-2 signaling at hDOR. DPDPE EC50 (nM) (pEC50 ± SEM) = 3.65 (8.43 ± 0.37) nM, Emax% ± SEM = 100 ± 14.54. Mitraciliatine EC50 (nM) (pEC50 ± SEM) = n.d., Emax% ± SEM = n.d. (F) No measurable βarrestin-2 recruitment was observed in BRET assays of mitracilatine at hDOR. DPDPE EC50 (nM) (pEC50 ± SEM) = 17.69 (7.75 ± 0.17) nM, Emax% ± SEM = 100 ± 5.8. Mitraciliatine EC50 (nM) (pEC50 ± SEM) = n.d., Emax% ± SEM < 20. n.d. = not determined. Data from both Gi-1 activation and βarrestin-2 assays using human opioid receptors were normalized to Emax of the corresponding controls, DAMGO, U50,488H, and DPDPE. The data were processed in GraphPad Prism using a three-parameter logistic equation to fit the dose response curves. Mean EC50 (pEC50 ± SEM) represents the data for assays run in triplicate (n = 3). See Table S1 for values. (G) Antinociception time course of mitraciliatine: Groups of C57BL/6J mice (n = 8 each group) received (i.c.v.) mitraciliatine, and antinociceptive response was evaluated at doses of 10, 30, and 100 nmol in WT mice at the indicated time points using the 55 °C tail withdrawal assay. Each point represents mean% antinociception ± SEM. We observed potent dose dependent antinociceptive response of mitraciliatine. Antinociception effect of mitraciliatine (100 nmol, i.c.v.) remained intact in KOR KO mice, although a statistically not significant increase in %MPE was seen. Antinociception was found attenuated in MOR KO mice at 10–30 min (***p = 0.0001, 0.001, and 0.0001 at 10, 20, and 30 min, respectively, unpaired t test per row corrected for multiple comparisons using Holm-Sidak method). (H) Respiratory rate mitraciliatine: Groups of mice received either vehicle (n = 12), saline (n = 12), morphine (100 nmol, i.c.v.; n = 12), or mitraciliatine (100 nmol, i.c.v.; n = 12), and the measurement of breath rates was done every 20 min for 180 min. Mitraciliatine showed increase in breath rates at 100 min (*p = 0.0233), 120 min (**p = 0.0017), and 140–180 min (****p < 0.0001) compared to vehicle, while morphine decreased breadth rates at 20–40 min (*p = 0.0387). The p values were calculated by 2-way ANOVA followed by Dunnett’s multiple-comparison test. (I) Locomotor effect mitraciliatine: Groups of mice received either vehicle (n = 24), saline (n = 12), morphine (100 nmol, i.c.v.; n = 12), or mitraciliatine (100 nmol, i.c.v.; n = 12), and the distance traveled by charcoal for each group of mice was measured. Mitraciliatine showed no significant hyperlocomotion compared to that of the vehicle as determined by 2-way ANOVA followed by Dunnett’s multiple-comparison test. However, significant locomotor effect was observed for morphine at 80–100 min (****p < 0.0001), 120 min (**p = 0.0038), 140–160 min (****p < 0.0001), and 180 min (**p = 0.0093) compared to that of the vehicle. The p values were calculated by 2-way ANOVA followed by Dunnett’s multiple-comparison test.
Figure 6.
Figure 6.
G-protein, βarrestin-2 signaling, and dose dependent antinociception time course of isopaynantheine. Isopaynantheine was an MOR antagonist–KOR biased agonist. Antinociception of Isopaynantheine is KOR dependent. (A) Gi-1 activation measured using BRET assays at MOR. Isopaynantheine did not show G-protein signaling at MOR compared to DAMGO. DAMGO EC50 (nM) (pEC50 ± SEM) = 31.27 (7.50 ± 0.03) nM, Emax% ± SEM = 100 ± 1.51. Isopaynantheine EC50 (nM) (pEC50 ± SEM) = n.d., Emax% ± SEM < 20. (B) No measurable βarrestin-2 recruitment was observed in BRET assays of isopaynantheine at MOR. DAMGO EC50 (nM) (pEC50 ± SEM) = 81.62 (7.09 ± 0.06) nM, Emax% ± SEM = 100 ± 2.55. Isopaynantheine EC50 (nM) (pEC50 ± SEM) = n.d., Emax% ± SEM < 20. (C) Gi-1 antagonism measured using BRET assays at MOR. Diprenorphine EC50 (nM) (pEC50 ± SEM) = 4.28 (8.37 ± 0.05) nM, Emax% ± SEM = 100 ± 2.90. Isopaynantheine EC50 (nM) (pEC50 ± SEM) = 1259 (5.9 ± 0.12) nM, Emax% ± SEM = 156.91 ± 13.49. (D) βarrestin-2 antagonism measured using BRET assays at MOR. Diprenorphine EC50 (nM) (pEC50 ± SEM) = 0.43 (9.37 ± 0.10) nM, Emax% ± SEM = 100 ± 2.47. Isopaynantheine EC50 (nM) (pEC50 ± SEM) = 1276.4 (5.89 ± 0.14), Emax% ± SEM = 106 ± 8.67. n.d. = not determined. (E) Gi-1 activation measured using BRET assays at KOR. Isopaynantheine shows G-protein signaling at KOR while showing no βarrestin-2 signaling. U50488H EC50 (nM) (pEC50 ± SEM) = 7.03 (8.15 ± 0.04) nM, Emax% ± SEM = 100 ± 1.58. Isopaynantheine EC50 (nM) (pEC50 ± SEM) = 560.4 (6.25 ± 0.066) nM, Emax% ± SEM = 80.5 ± 2.9. (F) No βarrestin-2 recruitment was observed in BRET assays of isopaynantheine at KOR. U50488H EC50 nM (pEC50 ± SEM) = 128.31 (6.89 ± 0.10) nM, Emax% ± SEM = 100 ± 4.12. Isopaynantheine EC50 (nM) (pEC50 ± SEM) = 599.29 (6.22 ± 0.43) nM, Emax% ± SEM < 20. (G) Gi-1 activation measured using BRET assays at DOR. Isopaynantheine did not show G-protein or βarrestin-2 signaling at DOR. SNC80 EC50 (nM) (pEC50 ± SEM) = 13.37 (7.87 ± 0.05) nM, Emax% ± SEM = 100 ± 1.89. Isopaynantheine EC50 (nM) (pEC50 ± SEM) = n.d., Emax% ± SEM < 20. (H) No measurable βarrestin-2 recruitment was observed in BRET assays of isopaynantheine at DOR. DPDPE EC50 (nM) (pEC50 ± SEM) = 7.76 (8.11 ± 0.05) nM, Emax% ± SEM = 100 ± 1.81. Isopaynantheine EC50 (nM) (pEC50 ± SEM) = n.d., Emax% ± SEM < 20. n.d. = not determined. Data from both Gi-1 activation and βarrestin-2 assays using human opioid receptors were normalized to Emax of the corresponding controls, DAMGO, U50,488H, DPDPE, and diprenorphine (for anatogonism). The data were processed in GraphPad Prism using a three-parameter logistic equation to fit the dose response curves. Mean EC50 (pEC50 ± SEM) represents the data for assays run in triplicate (n = 3). See Table S1 for values. (I) Antinociception time course of isopaynantheine: Groups of C57BL/ 6J mice (n = 8 each group) received (i.c.v.) isopaynantheine, and antinociceptive response was evaluated at doses of 10, 30, and 100 nmol in WT mice at the indicated time points using the 55 °C tail withdrawal assay. Each point represents mean% antinociception ± SEM. Isopaynantheine exhibited strong dose dependent antinociceptive response. Isopaynantheine (100 nmol, i.c.v.) retained the antinociceptive response in MOR KO mice. Antinociception was found reduced in KOR KO mice at 10–20 min (***p = 0.0001, *0.013 at 10 and 20 min, respectively, unpaired t test per row corrected for multiple comparisons using Holm-Sidak method). (J) Antinociception time course of U50488H: Groups of C57BL/6J mice (n = 8 each group) received (i.c.v.) U50488H, and antinociceptive response was evaluated at doses of 3, 10, and 30 nmol in WT mice at the indicated time points using the 55 °C tail withdrawal assay. Each point represents mean% antinociception ± SEM.
Scheme 1.
Scheme 1.
Chemical Synthesis of Corynantheidine.

References

    1. Pasternak GW, and Pan Y-X (2013) Mu Opioids and Their Receptors: Evolution of a Concept. Pharmacol. Rev 65 (4), 1257–317. - PMC - PubMed
    1. Corbett AD, Henderson G, Mcknight AT, and Paterson SJ (2006) 75 Years of Opioid Research: The Exciting but Vain Quest for the Holy Grail. Br. J. Pharmacol 147 (Suppl 1), S153–162. - PMC - PubMed
    1. Compton WM, Jones CM, and Baldwin GT (2016) The Authors Reply. New England Journal of Medicine, 1296. - PubMed
    1. Overdose Death Rates, National Institute on Drug Abuse (NIDA), https://www.drugabuse.gov/related-topics/trendsstatistics/overdose-death... (accessed 2019-09-23).
    1. Baumann MH, Majumdar S, Le Rouzic V, Hunkele A, Uprety R, Huang XP, Xu J, Roth BL, Pan Y-X, and Pasternak GW (2018) Pharmacological Characterization of Novel Synthetic Opioids (NSO) Found in the Recreational Drug Marketplace. Neuropharmacology 134 (Pt A), 101–107. - PMC - PubMed

Publication types