

A machine learning based exploration of COVID-19 mortality risk
- PMID: 34214101
- PMCID: PMC8253432
- DOI: 10.1371/journal.pone.0252384
A machine learning based exploration of COVID-19 mortality risk
Abstract
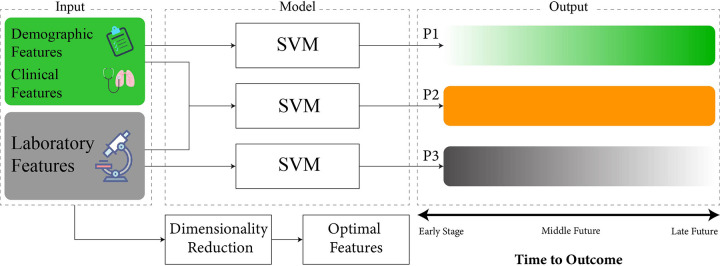
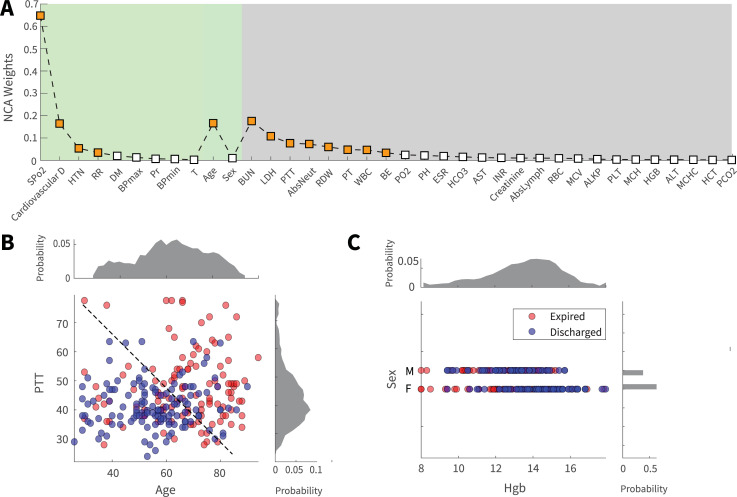
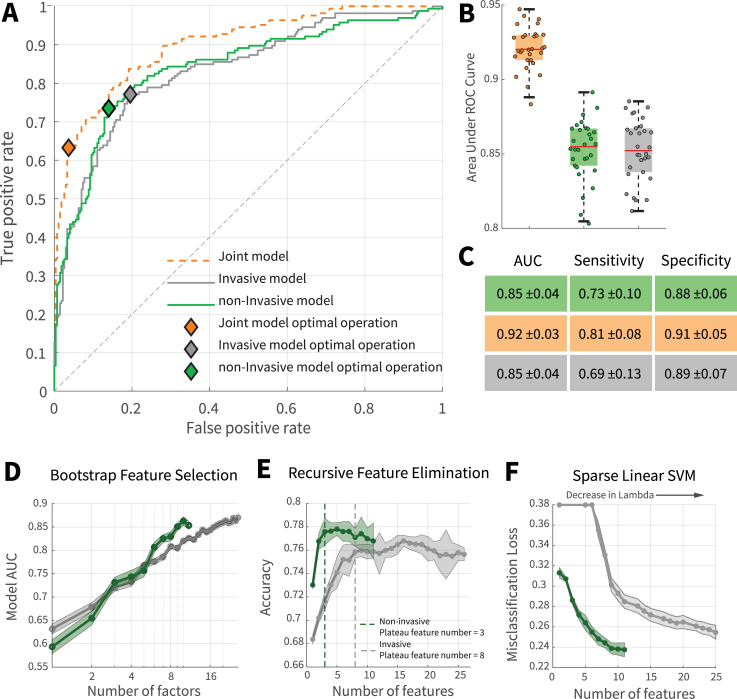
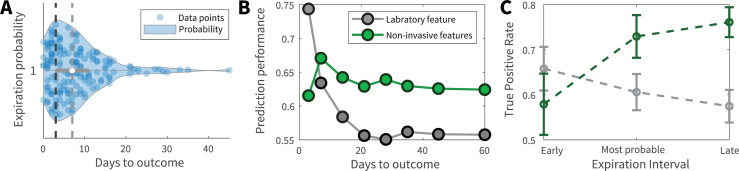
Early prediction of patient mortality risks during a pandemic can decrease mortality by assuring efficient resource allocation and treatment planning. This study aimed to develop and compare prognosis prediction machine learning models based on invasive laboratory and noninvasive clinical and demographic data from patients' day of admission. Three Support Vector Machine (SVM) models were developed and compared using invasive, non-invasive, and both groups. The results suggested that non-invasive features could provide mortality predictions that are similar to the invasive and roughly on par with the joint model. Feature inspection results from SVM-RFE and sparsity analysis displayed that, compared with the invasive model, the non-invasive model can provide better performances with a fewer number of features, pointing to the presence of high predictive information contents in several non-invasive features, including SPO2, age, and cardiovascular disorders. Furthermore, while the invasive model was able to provide better mortality predictions for the imminent future, non-invasive features displayed better performance for more distant expiration intervals. Early mortality prediction using non-invasive models can give us insights as to where and with whom to intervene. Combined with novel technologies, such as wireless wearable devices, these models can create powerful frameworks for various medical assignments and patient triage.
Conflict of interest statement
The authors have declared that no competing interests exist.
Figures
Similar articles
-
A Multimodality Machine Learning Approach to Differentiate Severe and Nonsevere COVID-19: Model Development and Validation.J Med Internet Res. 2021 Apr 7;23(4):e23948. doi: 10.2196/23948. J Med Internet Res. 2021. PMID: 33714935 Free PMC article.
-
Using Automated Machine Learning to Predict the Mortality of Patients With COVID-19: Prediction Model Development Study.J Med Internet Res. 2021 Feb 26;23(2):e23458. doi: 10.2196/23458. J Med Internet Res. 2021. PMID: 33539308 Free PMC article.
-
Machine Learning Applied to Clinical Laboratory Data in Spain for COVID-19 Outcome Prediction: Model Development and Validation.J Med Internet Res. 2021 Apr 14;23(4):e26211. doi: 10.2196/26211. J Med Internet Res. 2021. PMID: 33793407 Free PMC article.
-
Development and validation of a prognostic COVID-19 severity assessment (COSA) score and machine learning models for patient triage at a tertiary hospital.J Transl Med. 2021 Feb 5;19(1):56. doi: 10.1186/s12967-021-02720-w. J Transl Med. 2021. PMID: 33546711 Free PMC article.
-
Primary Care Relevant Risk Factors for Adverse Outcomes in Patients With COVID-19 Infection: A Systematic Review.J Am Board Fam Med. 2021 Feb;34(Suppl):S113-S126. doi: 10.3122/jabfm.2021.S1.200429. J Am Board Fam Med. 2021. PMID: 33622826
Cited by
-
Detection of COVID-19 Patients Using Machine Learning Techniques: A Nationwide Chilean Study.Int J Environ Res Public Health. 2022 Jun 30;19(13):8058. doi: 10.3390/ijerph19138058. Int J Environ Res Public Health. 2022. PMID: 35805713 Free PMC article.
-
Artificial intelligence approach towards assessment of condition of COVID-19 patients - Identification of predictive biomarkers associated with severity of clinical condition and disease progression.Comput Biol Med. 2021 Nov;138:104869. doi: 10.1016/j.compbiomed.2021.104869. Epub 2021 Sep 14. Comput Biol Med. 2021. PMID: 34547582 Free PMC article.
-
AD-CovNet: An exploratory analysis using a hybrid deep learning model to handle data imbalance, predict fatality, and risk factors in Alzheimer's patients with COVID-19.Comput Biol Med. 2022 Jul;146:105657. doi: 10.1016/j.compbiomed.2022.105657. Epub 2022 May 22. Comput Biol Med. 2022. PMID: 35672170 Free PMC article.
-
Online COVID-19 diagnosis prediction using complete blood count: an innovative tool for public health.BMC Public Health. 2023 Dec 19;23(1):2536. doi: 10.1186/s12889-023-17477-8. BMC Public Health. 2023. PMID: 38114942 Free PMC article.
-
A composite ranking of risk factors for COVID-19 time-to-event data from a Turkish cohort.Comput Biol Chem. 2022 Jun;98:107681. doi: 10.1016/j.compbiolchem.2022.107681. Epub 2022 Apr 9. Comput Biol Chem. 2022. PMID: 35487152 Free PMC article.
References
-
- WHO. Who coronavirus disease (covid-19) dashboard. URL https://covid19.who.int. Available at https://covid19.who.int. Accessed on 12.22.2020.
-
- Cascella M., Rajnik M., Cuomo A., Dulebohn S. C. & Di Napoli R. Features, evaluation and treatment coronavirus (covid-19). In Statpearls [internet] (StatPearls Publishing, 2020). - PubMed
MeSH terms
LinkOut - more resources
Full Text Sources
Medical
