Observational Study
. 2022 Mar 23;74(6):973-982.
doi: 10.1093/cid/ciab598.

A Clinical Prediction Model for Unsuccessful Pulmonary Tuberculosis Treatment Outcomes

Collaborators, Affiliations
Observational Study

A Clinical Prediction Model for Unsuccessful Pulmonary Tuberculosis Treatment Outcomes

Lauren S Peetluk et al. Clin Infect Dis. .

Abstract

Background: Despite widespread availability of curative therapy, tuberculosis (TB) treatment outcomes remain suboptimal. Clinical prediction models can inform treatment strategies to improve outcomes. Using baseline clinical data, we developed a prediction model for unsuccessful TB treatment outcome and evaluated the incremental value of human immunodeficiency virus (HIV)-related severity and isoniazid acetylator status.

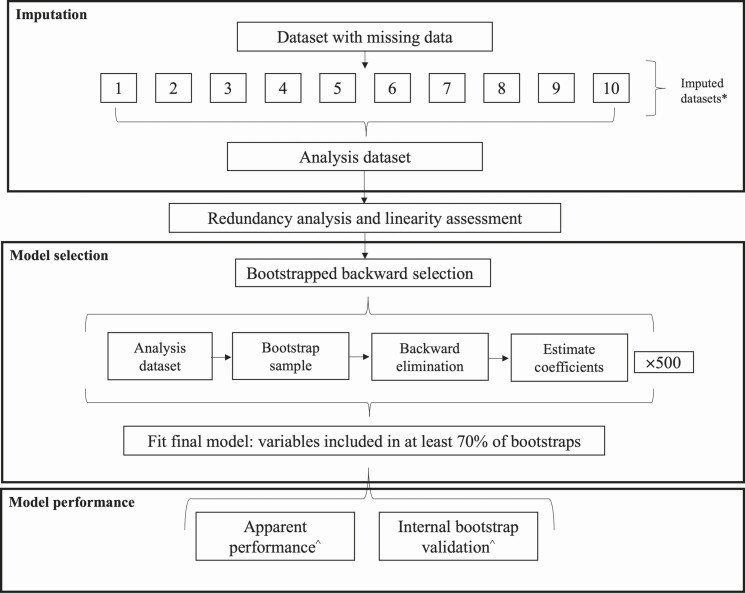
Methods: Data originated from the Regional Prospective Observational Research for Tuberculosis Brazil cohort, which enrolled newly diagnosed TB patients in Brazil from 2015 through 2019. This analysis included participants with culture-confirmed, drug-susceptible pulmonary TB who started first-line anti-TB therapy and had ≥12 months of follow-up. The end point was unsuccessful TB treatment: composite of death, treatment failure, regimen switch, incomplete treatment, or not evaluated. Missing predictors were imputed. Predictors were chosen via bootstrapped backward selection. Discrimination and calibration were evaluated with c-statistics and calibration plots, respectively. Bootstrap internal validation estimated overfitting, and a shrinkage factor was applied to improve out-of-sample prediction. Incremental value was evaluated with likelihood ratio-based measures.

Results: Of 944 participants, 191 (20%) had unsuccessful treatment outcomes. The final model included 7 baseline predictors: hemoglobin, HIV infection, drug use, diabetes, age, education, and tobacco use. The model demonstrated good discrimination (c-statistic = 0.77; 95% confidence interval, .73-.80) and was well calibrated (optimism-corrected intercept and slope, -0.12 and 0.89, respectively). HIV-related factors and isoniazid acetylation status did not improve prediction of the final model.

Conclusions: Using information readily available at treatment initiation, the prediction model performed well in this population. The findings may guide future work to allocate resources or inform targeted interventions for high-risk patients.

Keywords: HIV coinfection; epidemiologic research; prediction model; prognosis; pulmonary tuberculosis.


Figures

Figure 1.
Figure 1.
Schematic representation of each model development step and assessment of model performance. First, missing data were imputed across 10 datasets and summarized into an analysis dataset. Next, redundancy analysis and linearity assessment were carried out to identify highly correlated sets of variables and variables with evidence of nonlinearity. Following that, 500 repetitions of bootstrapped backward selection were used to identify the most important predictors of unsuccessful tuberculosis treatment outcome based on those included in at least 70% of bootstrap samples. Finally, model performance was evaluated in the original sample (apparent performance) and averaged over 2000 bootstrap samples (internal bootstrap validation). *Sensitivity analyses were conducted repeating all steps following imputation of the original data with missing information (complete case analysis) and in each of the imputed datasets. ^Model performance measures included discrimination (evaluated with the c-statistic) and calibration (evaluated using a calibration plot and the calibration slope and intercept).
Figure 2.
Figure 2.
A, The receiver operating characteristic (ROC) curve measures discrimination of the model, that is, how well the model can differentiate between those with and without an outcome. The grey error bars represent the 95% confidence intervals (CIs) for across the ROC curve, using 2000 stratified bootstrap samples. The area under the ROC curve, which is equivalent to the c-statistic, is 0.77 (95% CI, .73–.80). B, The calibration plot displays agreement between observed and predicted outcome probabilities across deciles of outcome risk. An ideal calibration curve has an intercept of 0 and a slope of 1 (dashed line). The apparent calibration (dotted line) is calibration of the model in the original data, and the bias-corrected line is corrected for overfitting using 200 bootstrap samples. The bias-corrected calibration intercept and slope were –0.12 and 0.89, respectively. The top of the plot displays a histogram of the distribution of predicted probabilities of unsuccessful outcome for the 944 culture-confirmed, drug-susceptible pulmonary tuberculosis patients included in the study.
Figure 3.
Figure 3.
The nomogram can be used in clinical settings to estimate individual risk of an unsuccessful tuberculosis outcome. For example, for an individual who is aged 50 years with diabetes as their only comorbidity, hemoglobin of 13 g/dL, 12 years of education, never drug use, and current tobacco use, their risk is calculated as: hemoglobin = 78 points, HIV-infection = 0 points, drug use = 0 points, diabetes = 12 points, age = 0 points, education = 7 points, and tobacco use = 10 points. Total points = 107, which equates to approximately 11% risk of an unsuccessful outcome. This is equivalent to what one would get when using the formula provided in the text: 1/(1 + exp (–Χβ*0.91)), where Χβ = 0.66 – 0.18*[13] + 0.71*[0] + 0.50*[0] + 1.19*[0] + 0.65*[1] – 0.48*[0] – 0.71*[0] – 1.09*[1] –0.46*[0 – 0.06*[12] + 0.63*[0] + 0.56*[1] = –2.28. Then risk = 1/(1 + exp(–(–2.28)*0.91) = 11%. This is also consistent with the calculation from the web app. Abbreviation: HIV, human immunodeficiency virus.
Figure 4.
Figure 4.
The decision curve plots the standardized net benefit (y-axis) across a variety of risk thresholds (x-axis) for 3 scenarios: intervene on all (All), intervene on none (None), or intervene based on predicted risk from the risk model (Risk Model). Standardized net benefit quantifies the total benefit (true-positive rate) minus the total harm (false-positive rate), assuming a population prevalence of unsuccessful outcome of 20% and standardized to a maximum benefit of 1 [24]. The lowest y-axis indicates the cost-benefit of intervention across risk thresholds. When an intervention has low perceived cost relative to high benefit, lower risk thresholds should be considered because the harms of unnecessary intervention are minimal compared with benefit of necessary intervention. Alternatively, as the cost-benefit of the intervention approaches 1:1, the risk threshold at which intervention should be considered increases because the costs or harms of unnecessary intervention start to balance out the benefit of necessary intervention. The 2 vertical lines bound the range (risk threshold, 11%–41%) where the lower 95% confidence interval estimate of using the risk model to inform treatment/intervention decisions has a higher standardized net benefit than treating/intervening on “All” patients and treating/intervening on “None”; however, the exact choice of the risk threshold should be selected based on cost-benefit considerations, which are intervention-specific. Use of the risk model to inform a novel treatment or intervention strategy is expected to have net benefit (true-positive rate outweighs false-positive rate, assuming outcome rate of 20%) when the cost-benefit ratio of the intervention is between 1:9 and 2:3.

References

    1. World Health Organization. Global tuberculosis report 2020. Geneva, Switzerland: World Health Organization, 2020.
    1. Arriaga M, Amorim G, Queiroz A, et al. . Novel stepwise approach to assess representativeness of a large multicenter observational cohort of tuberculosis patients: the example of RePORT Brazil. Int J Infect Dis 2020; 11:140. - PMC - PubMed
    1. World Health Organization. The End TB Strategy. Geneva, Switzerland: World Health Organization, 2015.
    1. Steyerberg EW, Moons KG, van der Windt DA, et al. ; PROGRESS Group. . Prognosis research strategy (PROGRESS) 3: prognostic model research. PLoS Med 2013; 10:e1001381. - PMC - PubMed
    1. Peetluk LS, Ridolfi FM, Rebeiro PF, Liu D, Rolla VC, Sterling TR. Systematic review of prediction models for pulmonary tuberculosis treatment outcomes in adults. BMJ Open 2021; 11:e044687. - PMC - PubMed

Publication types

MeSH terms