. 2021 Jul 21;49(13):7406-7423.
doi: 10.1093/nar/gkab548.

Phosphorylation of the HP1β hinge region sequesters KAP1 in heterochromatin and promotes the exit from naïve pluripotency

Affiliations

Phosphorylation of the HP1β hinge region sequesters KAP1 in heterochromatin and promotes the exit from naïve pluripotency

Weihua Qin et al. Nucleic Acids Res. .

Abstract

Heterochromatin binding protein HP1β plays an important role in chromatin organization and cell differentiation, however the underlying mechanisms remain unclear. Here, we generated HP1β-/- embryonic stem cells and observed reduced heterochromatin clustering and impaired differentiation. We found that during stem cell differentiation, HP1β is phosphorylated at serine 89 by CK2, which creates a binding site for the pluripotency regulator KAP1. This phosphorylation dependent sequestration of KAP1 in heterochromatin compartments causes a downregulation of pluripotency factors and triggers pluripotency exit. Accordingly, HP1β-/- and phospho-mutant cells exhibited impaired differentiation, while ubiquitination-deficient KAP1-/- cells had the opposite phenotype with enhanced differentiation. These results suggest that KAP1 regulates pluripotency via its ubiquitination activity. We propose that the formation of subnuclear membraneless heterochromatin compartments may serve as a dynamic reservoir to trap or release cellular factors. The sequestration of essential regulators defines a novel and active role of heterochromatin in gene regulation and represents a dynamic mode of remote control to regulate cellular processes like cell fate decisions.


Figures

Figure 1.
Figure 1.
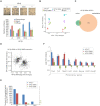
HP1β is required for neural progenitor cell (NPC) differentiation. (AC) Depletion of HP1β leads to alterations in number and size of chromocenters. Images of mESCs stained with DAPI (A), scale bar: 10 μm. 131 nuclei for wt and HP1β−/− cells respectively were counted and frequency (y-axis) relative to the number of chromocenters per cell (x-axis) was plotted (B). The area of chromocenters and nucleus was measured with ImageJ to calculate the relative space occupied by chromocenters within the nucleus for wt and HP1β−/− mESCs as depicted in the box plot. Center lines show the medians; box limits indicate the 25th and 75th percentiles as determined by R software; whiskers extend 1.5× the interquartile range from the 25th and 75th percentiles, outliers are represented by dots. 109 and 102 individual cells were measured for wt and HP1β−/−, respectively. Two-sided Student's t-test was done, **** P< 0.001 (C). (D) Volcano plot from HP1β ChIP-MS in wt and HP1β−/− mESCs (n = 2 biological replicates). Dark gray dots: significantly enriched proteins. Blue dots: proteins involved in heterochromatin regulation. Green dots: proteins involved in pluripotency. Purple dots: proteins involved in both heterochromatin and pluripotency. Cyan dots: zinc finger proteins (ZFPs). Statistical significance determined by performing a Student's t test with a permutation-based FDR of 0.05 and a cutoff of <2-fold enriched proteins. (E) Schematic representation of the NPC differentiation strategy and more details in Materials and Methods. Cells from distinct stages of differentiation were stained with a DyLight 650-conjugated anti-SSEA-1 antibody and analyzed by FACS.
Figure 2.
Figure 2.
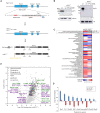
HP1β is phosphorylated at serine 89 residue. (A) Relative expression of HP1β in 2i/LIF (naïve) and metastable state conditions by RT-qPCR analysis. Values represent mean ± SEM from four biological replicates. (B) HP1β is upregulated in the metastable state condition. Total cell lysates of mESCs from naive and metastable culturing conditions were separated and visualized by anti-HP1β antibody. The anti-Tubulin blot was used as a loading control. (C, D) HP1β is highly phosphorylated on the serine 89 residue. GFP-HP1β purified from HEK293T cells was incubated with alkaline phosphatase and visualized in a coomassie stained gel (C). GFP-HP1β, wt and mutant, purified from HEK293T cells are visualized in a coomassie stained gel (D). (E) Characterization of a HP1β-pS89 monoclonal antibody by immunostaining. GFP-HP1β wt and mutant GFP-HP1β S89A fusion proteins were transiently expressed in BHK cells. HP1β proteins were anchored at a lac operator (lacO) array inserted in the genome and visible as a spot of enriched GFP fluorescence in the nucleus. Cell nuclei were stained with DAPI and HP1β proteins were visualized by the HP1β-pS89 antibody, scale bar: 5 μm. (F) Characterization of HP1β-pS89 monoclonal antibody by western blot. GFP-HP1β purified from HEK293T cells was incubated with alkaline phosphatase and visualized with anti-HP1β-pS89 antibody. (G) HP1β-pS89 is upregulated in the metastable condition. Total cell lysates of mESCs from naive and metastable culturing conditions were separated and visualized by anti-HP1β antibody. The anti-Tubulin blot was used as a loading control. (H) Co-immunoprecipitation shows an interaction between GFP-CK2 and Ch-HP1β. Cherry alone and cherry-tagged HP1β were immunoprecipitated from HEK293T cells co-transfected with GFP-CK2 using a RFP-Trap. Bound fractions were separated and visualized with an anti-GFP antibody and ponceau staining. (I) HP1β-pS89 is downregulated in the CK2a1as cell line treated with 1-NA-PP1. Total cell lysates from wt and CK2a1as mESCs treated with DMSO or 1-NA-PP1 were separated and visualized with anti-HP1β-pS89 and anti-HP1β antibodies. The anti-Actin blot was used as a loading control. Intensities of HP1β-pS89 were measured with ImageJ and normalized to the corresponding intensities of Actin before intensity ratios (1-NA-PP1/DMSO) were calculated. Values represent mean ± SEM of four biological replicates and the P-value of a two-sided Student's t-test is indicated.
Figure 3.
Figure 3.
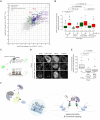
HP1β phosphorylation enhances its phase separation. (A) Illustration of the spin down assay to separate phase droplets from solution. (B) HP1β variants from 6 to 25 μM were incubated with 25 μM histones and phase-separated droplets were collected by centrifugation. Proteins in supernatants and pellets were visualized in coomassie stained gels. Line scans along the core histones in the supernatants and pellets of HP1β wt and mutant droplets at the concentration of 25 μM.
Figure 4.
Figure 4.
HP1β-pS89 promotes mESCs exit from naïve pluripotent state. (A) Representative images show alkaline phosphatase (AP) staining of wt E14 and HP1β mutant mESCs cultured in serum/LIF medium for 6 days. Numbers of dome-shape, diffuse and mixed colonies were counted, and values represent mean ± SEM from two different clones, each as a biological triplicate. (B) Principal component analysis (PCA) of whole transcriptome RNA-seq data from indicated cell lines in naive and metastable conditions. (C) Venn diagram showing dysregulated genes with fold changes >1.5 in HP1β S89A mESCs in naive and metastable conditions. (D) Scatter plot depicts overlapping dysregulated genes of HP1β S89A and HP1β S89E. (E) Bar plot showing the number of dysregulated genes from the transcriptomes of HP1β−/−, HP1β S89A and HP1β S89E mESCs at the indicated stages of NPC differentiation. (F) Pluripotency genes found to be dysregulated in (E) were plotted for the respective cell lines.
Figure 5.
Figure 5.
HP1β-pS89 interacts and recruits KAP1 to heterochromatin. (A) GFP-HP1β proteins immunoprecipitated using a GFP-Trap from HEK293T cells were separated and visualized by coomassie stained gels. A band showing more in GFP-HP1β wt and GFP-HP1β S89D, but less GFP-HP1β S89A, was cutted and sequenced by MS. (B) KAP1 is enriched in HP1β S89E phase-separated droplets in vitro. GFP and GFP-tKAP1 purified from HEK293T cells were incubated with 25 μM of HP1β S89E and histones in a buffer of 20 mM HEPES pH 7.2, 75 mM KCl and 1 mM DTT. 30 nM of HP1β S89E labeled with a NT-647 dye was added and phase-separated droplets were imaged using a 63x objective on a DeltaVision Personal Microscopy at 63 ×, scale bar: 5 μm. (C) Schematic illustration of KAP1 domains and their respective pI values. RING: really interesting new gene, BZ: B-box zinc finger, CC: Coiled-Coil, HP1 BD PxVxL: HP1 binding motif, PHD: plant homeodomains and Bromo domains. The N-terminus of CC (CCN) comprises a sequence (aa 250–280) that shares similarity with mouse histone H2B (aa 93–122). Conserved amino acids are highlighted in blue. (D) The CCN interacts with HP1β-pS89. To use the fluorescence three hybrid assay (F3H) (Herce et al., 2013; Rothbauer et al., 2008), GFP and GFP-HP1β fusion proteins as well as Ch-CCN were transiently expressed in BHK cells. GFP and GFP-HP1β proteins are anchored at a lac operator (lacO) array inserted in the BHK genome, thereby leading to a spot of enriched GFP fluorescence within the nucleus. While GFP-HP1β showed accumulation of Ch-CCN at the lacO spot, no or only weak interactions were detected for GFP and GFP-HP1β-SA, respectively. HP1β-pS89 was visualized with an anti-HP1β-pS89 antibody and nuclei were stained with DAPI, scale bar: 5 μm. (E) Images show KAP1−/−/HP1β S89E mESCs stably expressing either GFP-KAP1 wt or RH/PVL single or double mutation stained with an anti-HP1β antibody and DAPI, scale bar: 5 μm. (F) Quantification of chromocenter enrichment of GFP-tKAP1 wt and its mutations. GFP intensities in the chromocenters and euchromatic regions were measured with ImageJ and their ratio was calculated. Center lines depict the median; box limits indicate the 25th and 75th percentiles as determined by R software; whiskers extend 1.5x the interquartile range from the 25th and 75th percentiles; outliers are represented by circles. Individual chromocenters were analyzed (n = 64, 71, 69, 54 for GFP-tKAP1 wt, RH, PVL and RH/PVL, respectively). P values of a two-sided Student's t-test are indicated.
Figure 6.
Figure 6.
KAP1 relies on its ubiquitination activity to regulate pluripotency. (A) Schematic representation shows the CRISPR/Cas9 gene editing strategy used to generate KAP1−/− mESCs. gRNA target sequence and restriction enzyme recognition sites for screening are shown. (B) Western blot analysis of KAP1 protein levels in wt and KAP1−/− mESCs using antibodies against N- (left) and C-terminus (right) of KAP1. The tubulin and H3 blots were used as loading controls. (C) Mass spectrometry analyses of KAP1 expression in wt and KAP1−/− mESCs. (D) Volcano plot from diGly pulldowns in wt (n = 3 biological replicates) and KAP1−/− mESCs (n = 2 technical replicates). Dark gray dots: significantly enriched proteins. Blue dots: proteins involved in heterochromatin regulation. Green dots: proteins involved in pluripotency. Purple dots: proteins involved in both heterochromatin and pluripotency. Red dots: KAP1. Statistical significance determined by performing a Student's t test with a permutation-based FDR of 0.05 and an additional constant S0 = 1. (E) Plot of dysregulated pluripotency genes in the transcriptomes of HP1β−/− and KAP1−/− mESCs. Dark gray dots: significantly enriched proteins. Blue dots: proteins involved in heterochromatin regulation. Green dots: proteins involved in pluripotency. Purple dots: proteins involved in both heterochromatin and pluripotency. Red dots: KAP1 peptides.
Figure 7.
Figure 7.
HP1β-pS89 sequesters KAP1 into heterochromatin to promote mESCs exit from pluripotency. (A) Comparison of the HP1β ChIP-MS under naive (0 h) and epiblast states (48 h). (B) KAP1 is recruited to chromocenters by HP1β-pS89 during pluripotency exit. Box plot depicts the intensity of KAP1-GFP at chromocenters relative to the signal at euchromatic regions in GFP knockin cell lines at the naïve (0h) and epiblast (48 h) state, respectively. Center lines show the medians; box limits indicate the 25th and 75th percentiles as determined by R software; whiskers extend 1.5x the interquartile range from the 25th and 75th percentiles, outliers are represented by dots. The number of chromocenters (n) analyzed for each sample is indicated. P values from a two-sided Student's t-test are indicated. (C) Schematic representation of tethering KAP1-GFP to the nuclear envelope and chromocenters by using GBP-Lamin B1 and MBD-GBP, respectively. (D) Representative images of HP1β−/− cells ectopically expressing Cherry in combination with GBP-Lamin B1 or MBD-GBP stained with NANOG and DAPI, scale bar: 5 μm. (E) Box plots depict relative levels of the pluripotency protein NANOG for cells showing nuclear envelope and chromocenter tethering of GFP-tagged KAP1. Fluorescence intensities in nuclei were measured with ImageJ and normalized to the signals for untransfected cells. Center lines show the medians; box limits indicate the 25th and 75th percentiles as determined by R software; whiskers extend 1.5× the interquartile range from the 25th and 75th percentiles, outliers are represented by dots. The number of cells (n) analyzed for each sample is indicated. Two-sided Student's t-test was performed, and p values are indicated. (F) HP1β dimerizes and binds H3K9me3 clustering chromatin to form heterochromatin compartments. In response to pluripotency exit, HP1β is phosphorylated at serine 89 residue (HP1β-pS89) by CK2, thereby sequestering KAP1 into heterochromatin compartments. KAP1 relies on its ubiquitination/sumoylation activity to regulate pluripotency. The sequestration of KAP1 leads to downregulation of pluripotency genes allowing mESCs to exit pluripotency.

References

    1. Eissenberg J.C., Elgin S.C.. The HP1 protein family: getting a grip on chromatin. Curr. Opin. Genet. Dev. 2000; 10:204–210. - PubMed
    1. Li Y., Kirschmann D.A., Wallrath L.L.. Does heterochromatin protein 1 always follow code. Proc. Natl. Acad. Sci. U.S.A. 2002; 99:16462–16469. - PMC - PubMed
    1. Bannister A.J., Zegerman P., Partridge J.F., Miska E.A., Thomas J.O., Allshire R.C., Kouzarides T.. Selective recognition of methylated lysine 9 on histone H3 by the HP1 chromo domain. Nature. 2001; 410:120–124. - PubMed
    1. Jacobs S.A., Khorasanizadeh S.. Structure of HP1 chromodomain bound to a lysine 9-methylated histone H3 tail. Science. 2002; 295:2080–2083. - PubMed
    1. Nakayama J., Rice J.C., Strahl B.D., Allis C.D., Grewal S.I.. Role of histone H3 lysine 9 methylation in epigenetic control of heterochromatin assembly. Science. 2001; 292:110–113. - PubMed

Publication types

MeSH terms