. 2021 Sep 22;12(9):924-944.e2.
doi: 10.1016/j.cels.2021.06.002. Epub 2021 Jul 1.

Fundamental limits on the rate of bacterial growth and their influence on proteomic composition

Affiliations

Fundamental limits on the rate of bacterial growth and their influence on proteomic composition

Nathan M Belliveau et al. Cell Syst. .

Abstract

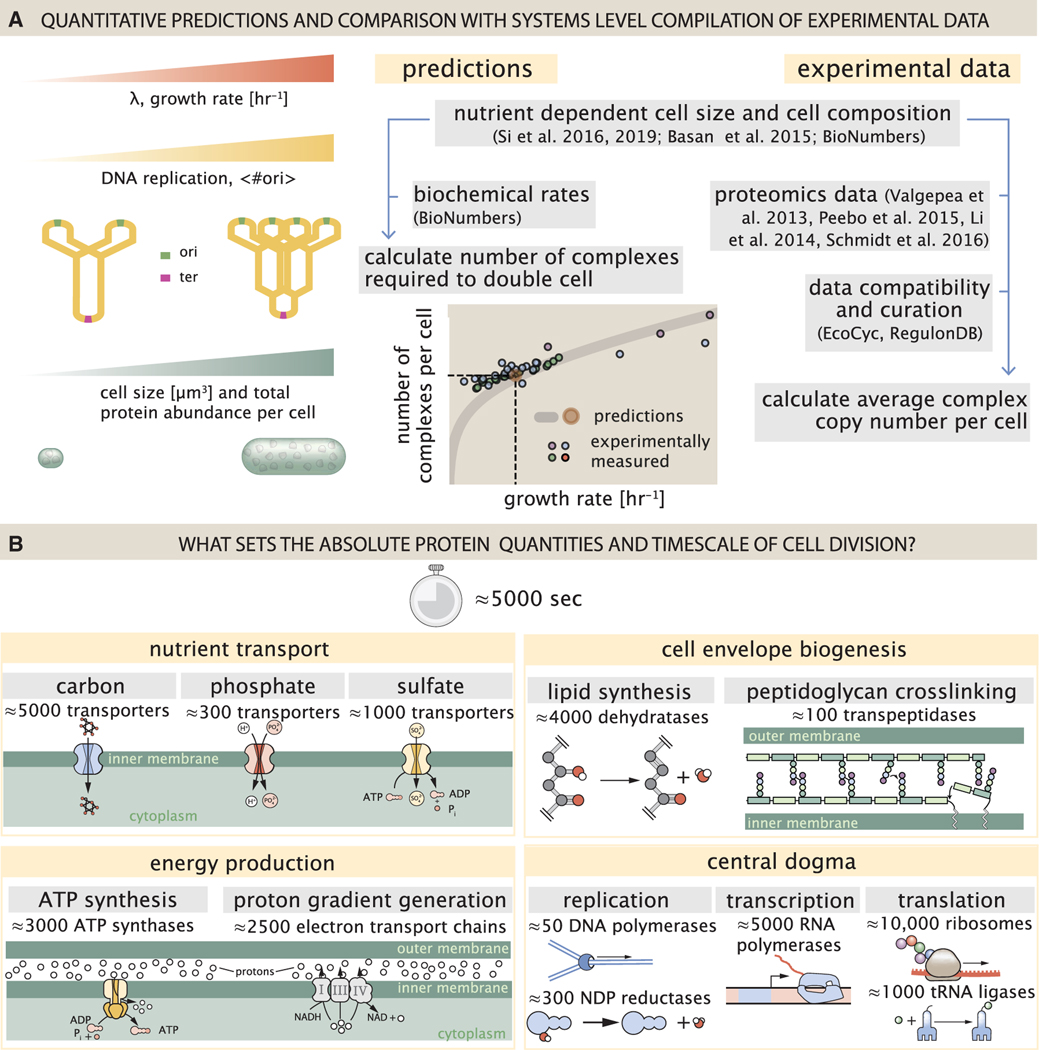
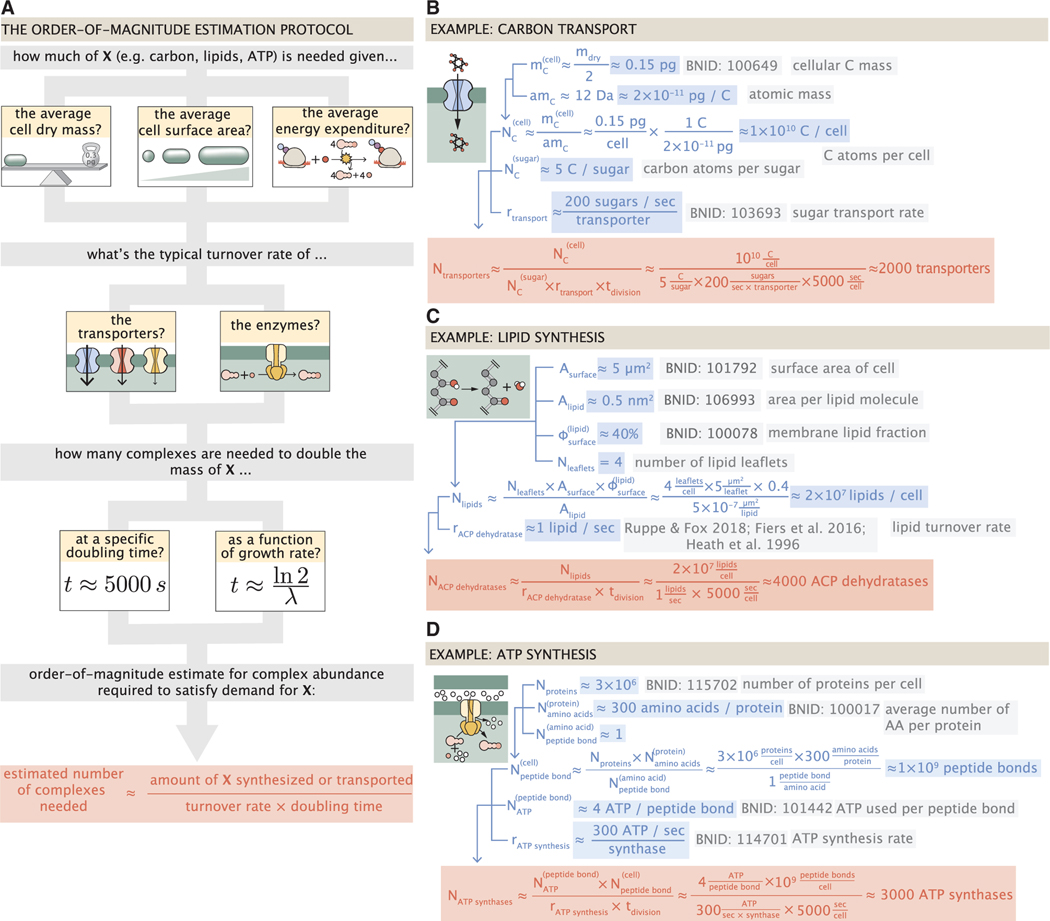
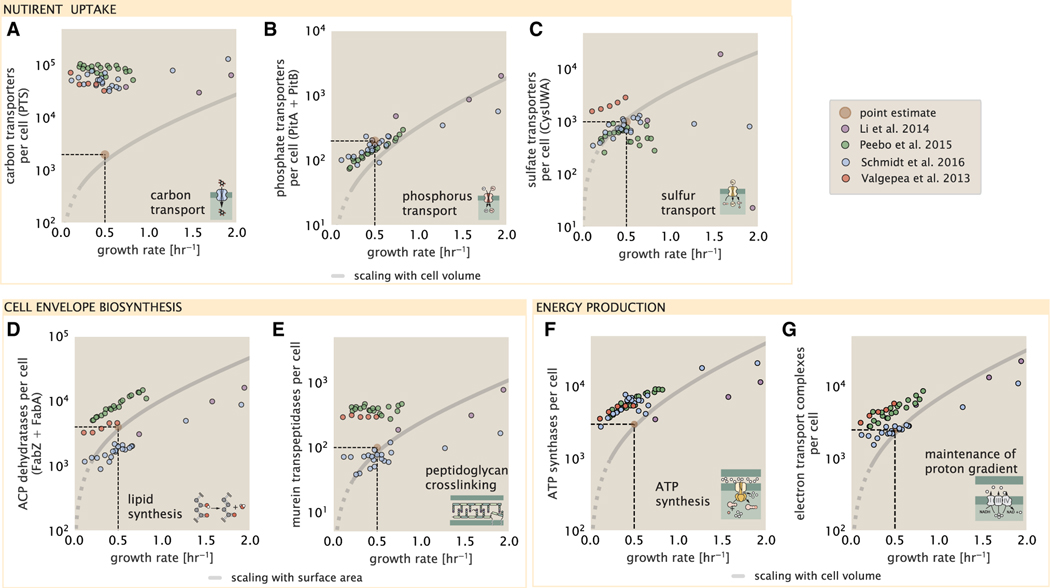
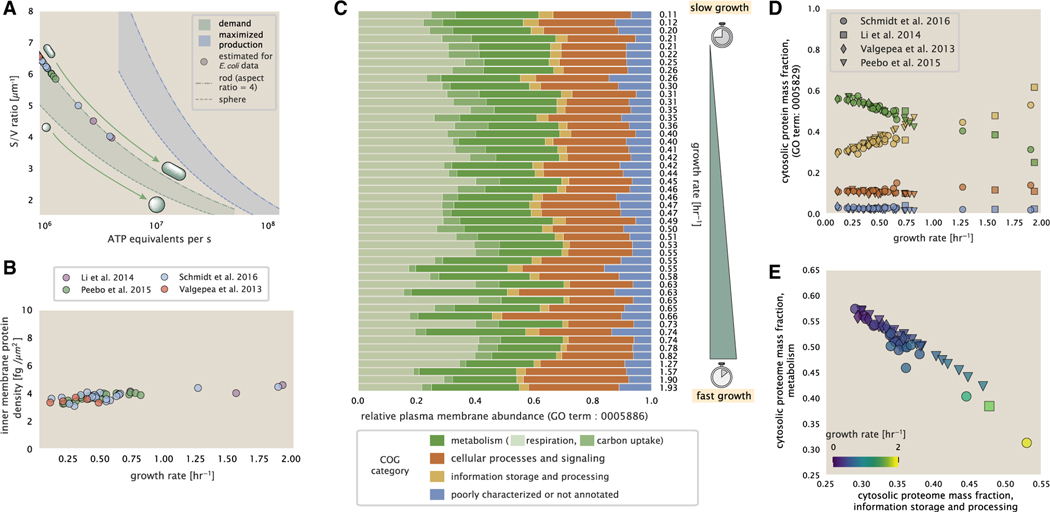
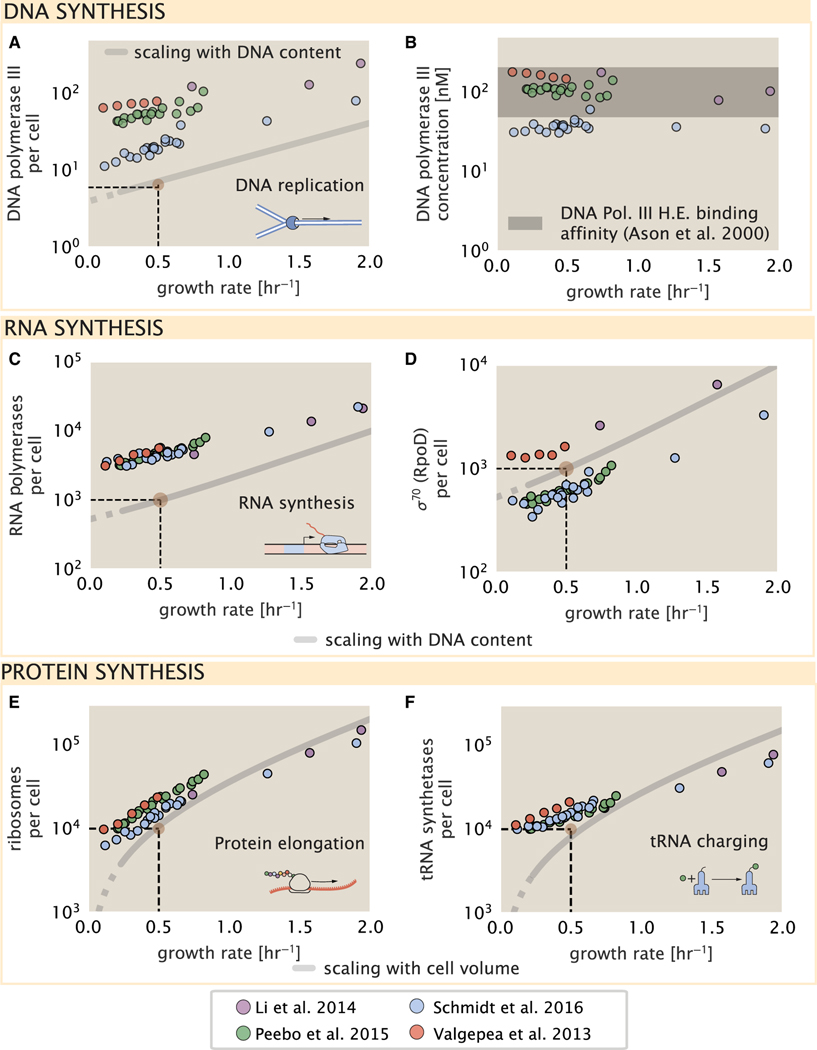
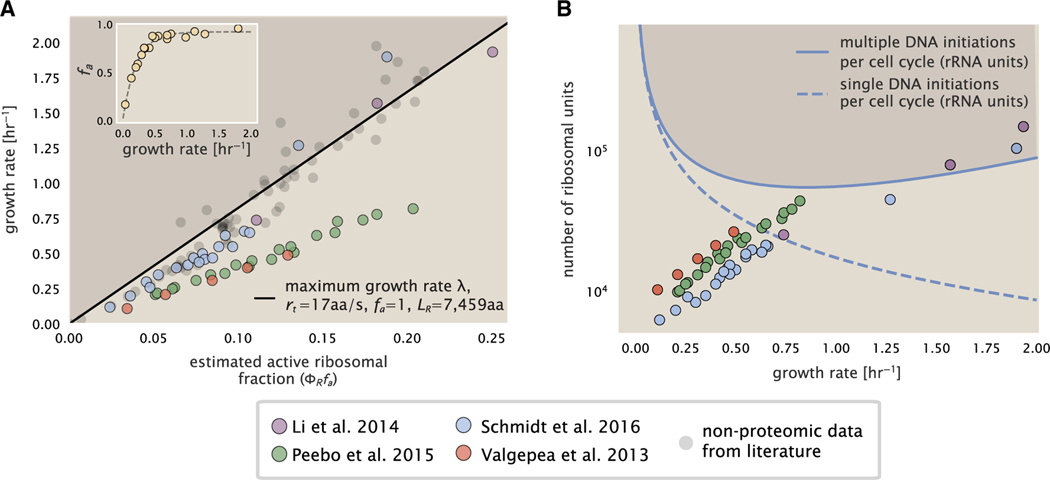
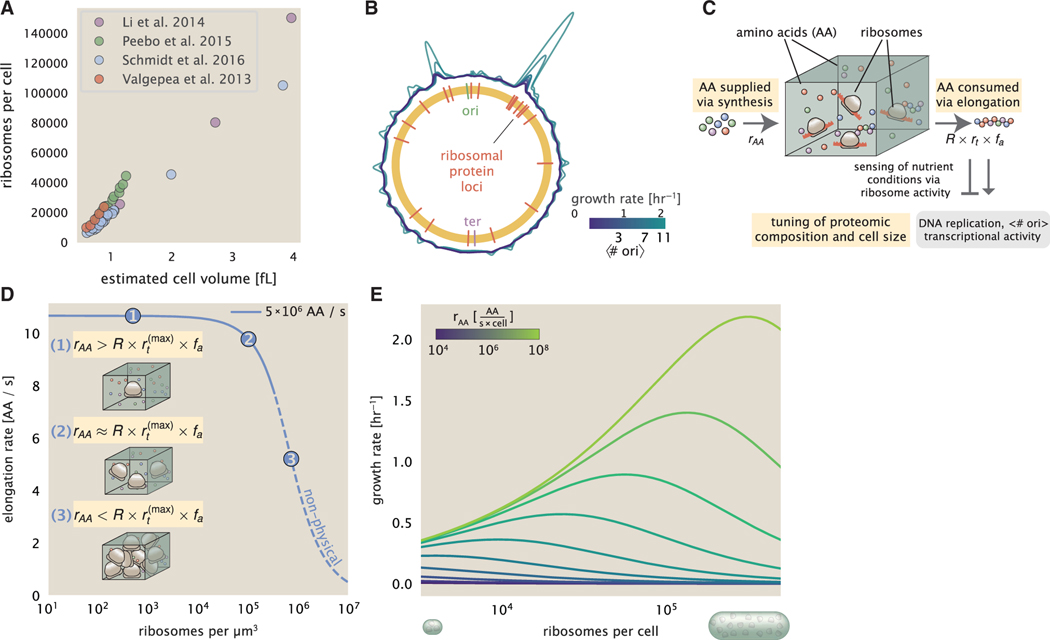
Despite abundant measurements of bacterial growth rate, cell size, and protein content, we lack a rigorous understanding of what sets the scale of these quantities and when protein abundances should (or should not) depend on growth rate. Here, we estimate the basic requirements and physical constraints on steady-state growth by considering key processes in cellular physiology across a collection of Escherichia coli proteomic data covering ≈4,000 proteins and 36 growth rates. Our analysis suggests that cells are predominantly tuned for the task of cell doubling across a continuum of growth rates; specific processes do not limit growth rate or dictate cell size. We present a model of proteomic regulation as a function of nutrient supply that reconciles observed interdependences between protein synthesis, cell size, and growth rate and propose that a theoretical inability to parallelize ribosomal synthesis places a firm limit on the achievable growth rate. A record of this paper's transparent peer review process is included in the supplemental information.

Keywords: bacteria; cell size; cellular growth; microbial growth laws; microbial physiology; order-of-magnitude estimation; physical biology; proteomics.


Conflict of interest statement

Declaration of interests J.A.T. is chief scientific advisor at the Allen Institute for Cell Science (Seattle, WA, 98109). The authors otherwise declare no competing interests.

Figures

Figure 1.
Figure 1.. Quantitative predictions of required protein abundances across key transport and synthesis processes necessary for cell division
(A) The growth rate dependent changes in bacterial size and composition provide a basis to both predict the protein abundances necessary to double a cell, and compile and compare proteomic measurements on a per cell basis across the recent datasets from Schmidt et al. (2016); Li et al. (2014); Peebo et al. (2015), and Valgepea et al. (2013). Predictions rely on the wealth of molecular turnover rate measurements and additional data tabulated on the BioNumbers Database (bionumbers.hms.harvard.edu, Milo et al. [2010]). (B) We consider an array of processes necessary for a cell to double its molecular components, broadly grouped into four classes. These categories are nutrient transport across the cell membrane, cell envelope biogenesis, energy production (namely, ATP synthesis), and processes associated with the central dogma. Numbers shown are the approximate number of complexes of each type observed at a growth rate of 0.5 h −1, or a cell doubling time of ≈5,000 s.
Figure 2.
Figure 2.. The order-of-magnitude estimate protocol and examples for fundamental cellular processes
(A) Nearly all order-of-magnitude estimates undertaken in this work follow the same basic estimate scheme. For a given process, we first consider how much of a given material X (e.g., carbon atoms, lipid molecules, or ATP) the cell must transport or synthesize. This is dependent on the elemental composition of the cellular dry mass, the cellular surface area, or the cellular energy expenditure. With a value for the amount to be synthesized, we consider how quickly the process can occur given the literature values of the in vivo or in vitro kinetics of the key complexes involved in the process. The number of complexes needed to meet the synthetic or transport demand is dependent on the doubling time of the cell, which can be taken to be a specific value or evaluated over a continuum of growth rates. Together, these three quantities can be combined to estimate the number of complexes needed to meet the demand in a given time, highlighted in red, with order-of-magnitude or better precision. Example estimates are given for (B) the number of carbon transporters, (C) the number of lipid synthesis enzymes, and (D) the number of ATP synthases. Similar diagrams of other estimates can be found in Table S1.
Figure 3.
Figure 3.. Key processes required for nutrient uptake, cell wall biogenesis and energy synthesis during growth.
Dashed black lines indicate order of magnitude estimate needed at a growth rate of ≈0.5 per h (light-brown point), while the gray line accounts for the growth rate dependence changes in cell size and doubling time. Dashed region of gray line represents growth rates with a doubling time ≥ 3 h where protein maintenance costs may be important but are not considered. (A) Estimate for the minimum number of generic carbohydrate transport systems. Colored points correspond to the mean number of complexes involved in carbohydrate import (complexes annotated with the gene ontology terms GO:0009401 and GO:0098704) for different growth conditions across different published datasets. (B) Number of PitA phosphate transport systems needed to maintain a 3% phosphorus dry mass. (C) Number of CysUWA complexes necessary to maintain a 1% sulfur E. coli dry mass and the experimentally observed complex copy numbers using the transporter stoichiometry [CysA]2[CysU][CysW][Sbp/CysP]. (D) Number of ACP dehydratases necessary to form functional phospholipids, which is assumed to be a rate-limiting step on lipid synthesis, and the experimentally observed complex copy numbers using the stoichiometries [FabA]2 and [FabZ]2. (E) Number of peptidoglycan transpeptidases needed to complete maturation of the peptidoglycan and experimental measurements of the transpeptidase complexes, following the stoichiometries [MrcA]2, [MrcB]2, [MrdA]1, and [MrdB]1. (F) Number of F1-F0 ATP synthase complexes needed to accommodate peptide bond formation and other NTP dependent processes and experimental measurements following the stoichiometry [AtpE]10[AtpF]2[AtpB][AtpC][AtpH] [AtpA]3[AtpG][AtpD]3. (G) Number of electron transport chain complexes needed to maintain a membrane potential of −200 mV. Points in plot correspond to the average number of complexes identified as being involved in aerobic respiration by the GO identifier GO:0019646. These complexes include cytochromes bd1 ([CydA][CydB][CydX] [CydH]), bdII ([AppC][AppB]), bo3,([CyoD][CyoA][CyoB][CyoC]) and NADH:quinone oxioreductase I ([NuoA][NuoH][NuoJ][NuoK][NuoL][NuoM][NuoN][NuoB] [NuoC] [NuoE][NuoF][NuoG][NuoI]) and II ([Ndh]).
Figure 4.
Figure 4.. Influence of cell size and surface area to volume ratio on ATP production and inner membrane composition
(A) Scaling of ATP demand and maximum ATP production through respiration as a function of surface area to volume ratio. Cell volumes of 0.5 fL to 50 fL were considered, with the dashed ( - -) line corresponding to a sphere and the dash-dot line (−.) reflecting a rod-shaped bacterium like E. coli with a typical aspect ratio (length/width) of 4 (Shi et al., 2018). The ATP demand is calculated as 106 ATP/(μm3 s), while the maximum ATP production rate is taken to be 3 ATP / (nm2•s) (Szenk et al., 2017), with calculations of E. coli volume and surface area detailed in supplemental information section “estimation of cell size and surface area.” In this calculation, 50% of the bacterial inner membrane is assumed to be protein, with the remainder lipid. (B) Total protein mass per μm2 calculated for proteins with inner membrane annotation (GO term: 0005886). (C) Relative protein abundances are grouped by their COG annotations (“metabolic,” “cellular processes and signaling,” “information storage and processing,” and “poorly characterized or not annotated”) for the data from Schmidt et al. (2016). Metabolic proteins are further separated into respiration (F1-F0 ATP synthase, NADH dehydrogenase I, succinate:quinone oxidoreductase, cytochrome bo3 ubiquinol oxidase, cytochrome bd-I ubiquinol oxidase) and carbohydrate transport (GO term: GO:0008643). Note that the elongation factor EF-Tu can also associate with the inner membrane but was excluded in this analysis due to its high relative abundance (roughly identical to the summed protein shown in B). (D) Relative cytosolic protein abundances (GO term: 0005886), grouped by their COG annotations, are plotted as a function of growth rate. (E) The relative cytosolic protein abundances (GO term: 0005886) associated with the “information storage and processing” and “metabolic” COG categories are plotted against each other and highlight the larger mass fraction devoted to “information storage and processing” at faster growth rates.
Figure 5.
Figure 5.. Processes of the central dogma
(A) The minimum number of DNA polymerase holoenzyme complexes needed to facilitate replication of the genome. Points correspond to the total number of DNA polymerase III holoenzyme complexes ([DnaE]3[DnaQ]3[HolE]3[DnaX]5[HolB] [HolA][DnaN]4[HolC]4[HolD]4) per cell. (B) The effective concentration of DNA polymerase III holoenzyme (see supplemental information section “estimation of cell size and surface area” for calculation of cell size). Shaded region corresponds to the range of KD values measured by Ason et al. (2000), from 50 to 200 nM. (C) The number of RNA polymerase core enzymes, with measurements corresponding to the average number given a subunit stoichiometry of [RpoA]2[R-poC][RpoB]. (D) The abundance of σ70 as a function of growth rate along with the same prediction from (C). (E) Number of ribosomes required to synthesize 109 peptide bonds with an elongation rate of 15 peptide bonds per second. (F) Number of tRNA synthetases that will supply the required amino acid demand. The sum of all tRNA synthetases copy numbers are plotted ([ArgS], [CysS], [GlnS], [GltX], [IleS], [LeuS], [ValS], [AlaS]2, [AsnS]2, [AspS]2, [TyrS]2, [TrpS]2, [ThrS]2, [SerS]2, [ProS]2, [PheS]2[PheT]2, [MetG]2, [lysS]2, [HisS]2, [GlyS]2[GlyQ]2). Dashed black lines indicate order of magnitude estimate needed at a growth rate of ≈0.5 per h (light-brown point), while the gray line accounts for the growth rate dependence changes in cell size and doubling time. Dashed region of gray line represents growth rates with a doubling time ≥ 3 h where protein maintenance costs may be important but are not considered.
Figure 6.
Figure 6.. Limitations on ribosomal protein synthesis and growth rate
(A) Translation-limited growth rate as a function of the actively translating ribosomal fraction. The actively translating ribosomal fraction is calculated using the estimated values of fa from Dai et al. (2016) (shown in inset; see supplemental information “calculation of active ribosomal fraction” for additional detail). Shaded region defines boundary due to constraint set on growth rate by Equation 3. The solid line is calculated for an elongation rate of 17 peptide bonds per s. Gray data points show additional measurements based on measurements of cellular RNA to protein ratio, with ΦR the cellular RNA to protein ratio divided by 2.1 (Dai et al., 2016) and come from Forchhammer and Lindahl (1971); Bremer and Dennis (2008); Scott et al. (2010); Dai et al. (2016); Si et al. (2017). (B) Maximum number of rRNA units that can be synthesized as a function of growth rate. Solid curve corresponding to the rRNA copy number is calculated by multiplying the number of rRNA operons by the estimated number of # ori at each growth rate. The quantity # ori was calculated using Equation 4 and the measurements from Si et al. (2017). The dashed line shows the maximal number of functional rRNA units produced from a single chromosomal initiation per cell cycle. Shaded region defines boundary due to maximal rRNA synthesis.
Figure 7.
Figure 7.. Coordination of cell size and proteomic composition via ribosome activity
(A) Plot of the ribosome copy number estimated from the proteomic data against the estimated cell size (see supplemental information “estimation of cell size and surface area” for details on the calculation of cell size). (B) A running Gaussian average (20 kbp SD) of protein copy number is calculated for each growth condition considered by ( Schmidt et al., 2016) based on each gene’s transcriptional start site. Since total protein abundance increases with growth rate, protein copy numbers are median subtracted to allow comparison between growth conditions. # ori are estimated using data from Si et al. (2017) (see supplemental information “estimation of # ori for additional details). (C) We consider a unit volume of cellular material composed of amino acids (colored spheres) provided at a supply rate rAA. These amino acids are polymerized by a pool of ribosomes (brown blobs) at a rate rt × R × fa, where rt is the elongation rate, R is the ribosome copy number in the unit volume, and fa is the fraction of those ribosomes actively translating. In addition to determining total protein synthesis rate, the nutrient status is gauged by any accumulation of de-acylated tRNAs and synthesis of the secondary messenger (p)ppGpp, which ultimately determine # ori, cell size, and proteomic composition. (D) The observed elongation rate is plotted as a function of the number of ribosomes. The three points correspond to three regimes of ribosome copy numbers and are shown schematically on the left-hand side. The region of the curve shown as dashed lines represents a non-physical copy number but is shown for illustrative purposes. This curve was generated using an amino acid supply rate of 5 × 10⁶ AA / s, a maximal elongation rate of 17.1 AA / s, fa = 1, and a unit cell volume of 1 fL. See supplemental information “derivation of minimal model for nutrient-mediated growth rate control” for additional model details. (E) The cellular growth rate is plotted as a function of total cellular ribosome copy number for different cellular amino acid supply rates, with blue and green curves corresponding to low and high supply rates, respectively. As the ribosome copy number is increased, so too is the cell size and total protein abundance Npep.

References

    1. Abelson HT, Johnson LF, Penman S, and Green H. (1974). Changes in RNA in relation to growth of the fibroblast: II. The lifetime of mRNA, rRNA, and tRNA in resting and growing cells. Cell 1, 161–165. 10.1016/0092-8674(74)90107-X. - DOI - PubMed
    1. Aidelberg G, Towbin BD, Rothschild D, Dekel E, Bren A, and Alon U. (2014). Hierarchy of non-glucose sugars in Escherichia coli. BMC Syst. Biol 8, 133. 10.1186/s12918-014-0133-z. - DOI - PMC - PubMed
    1. Amir A. (2017). Is cell size a spandrel? eLife 6, 18261. - PMC - PubMed
    1. Antonenko YN, Pohl P, and Denisov GA (1997). Permeation of ammonia across bilayer lipid membranes studied by ammonium ion selective microelectrodes. Biophys. J 72, 2187–2195. - PMC - PubMed
    1. Ashburner M, Ball CA, Blake JA, Botstein D, Butler H, Cherry JM, Davis AP, Dolinski K, Dwight SS, Eppig JT, et al. (2000). Gene ontology: tool for the unification of biology. Nat. Genet 25, 25–29. - PMC - PubMed

Publication types

LinkOut - more resources