. 2021 Jul 8;184(14):3731-3747.e21.
doi: 10.1016/j.cell.2021.06.001. Epub 2021 Jul 1.

A neural circuit state change underlying skilled movements

Affiliations

A neural circuit state change underlying skilled movements

Mark J Wagner et al. Cell. .

Abstract

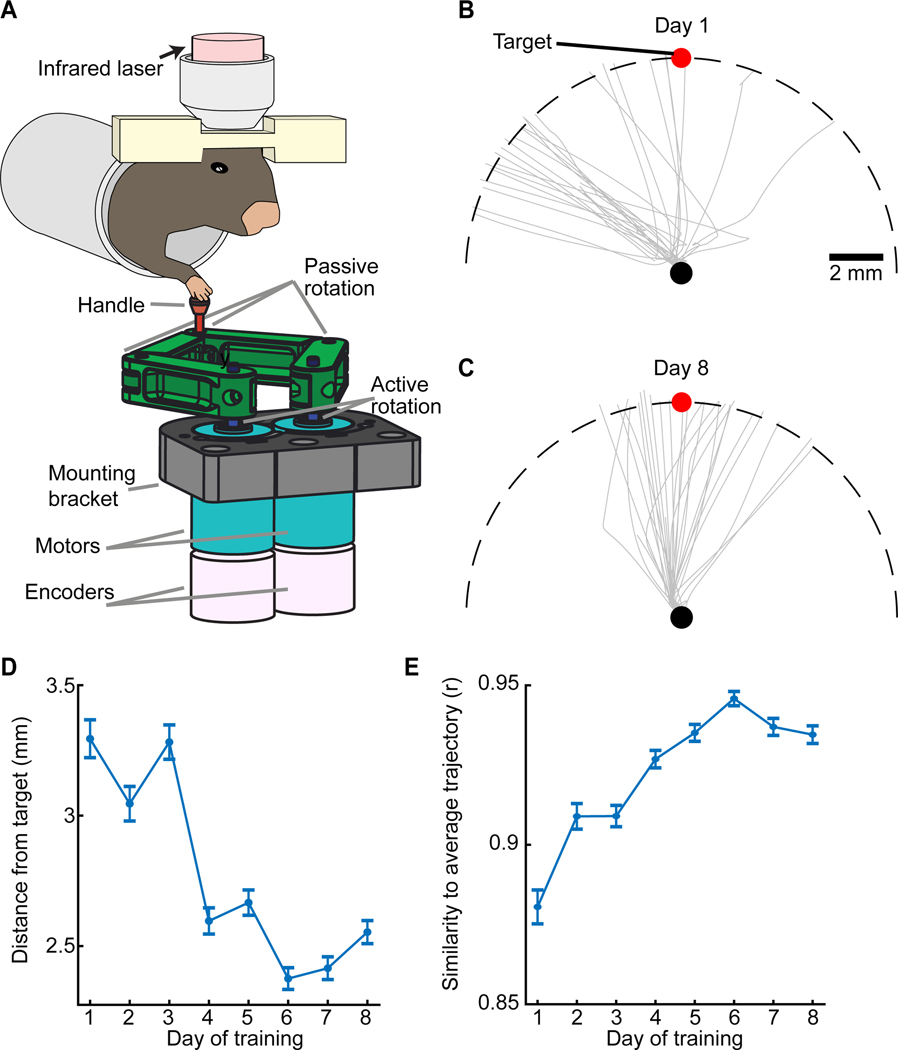
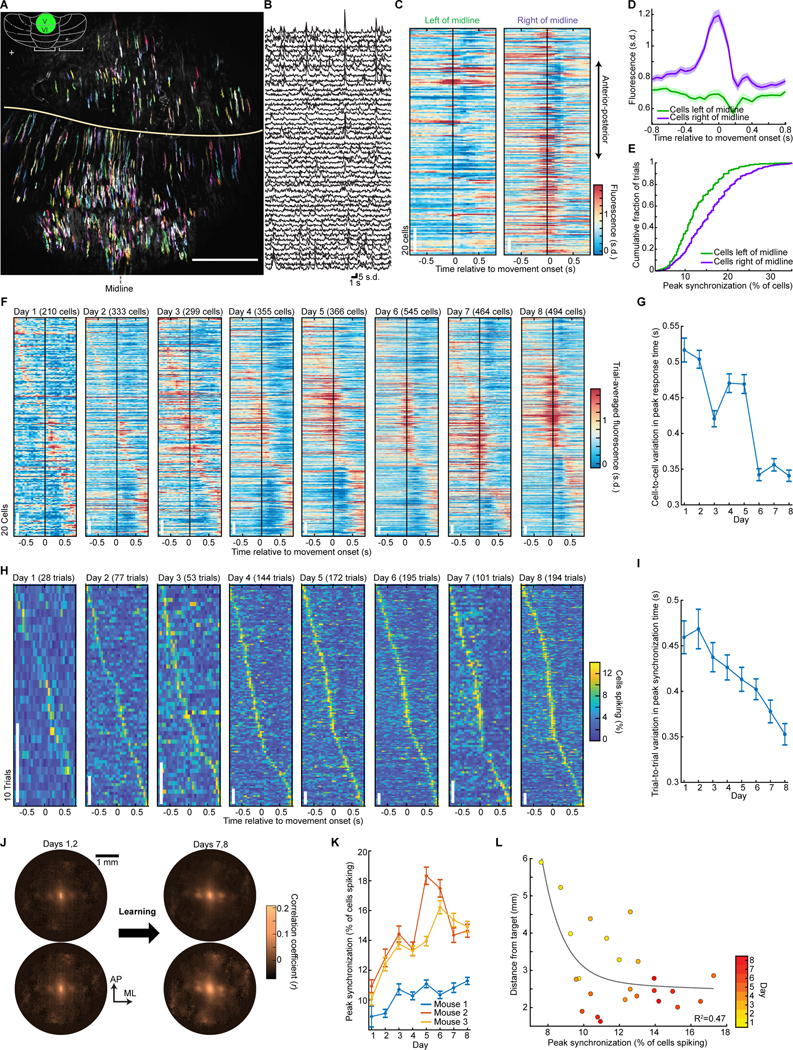
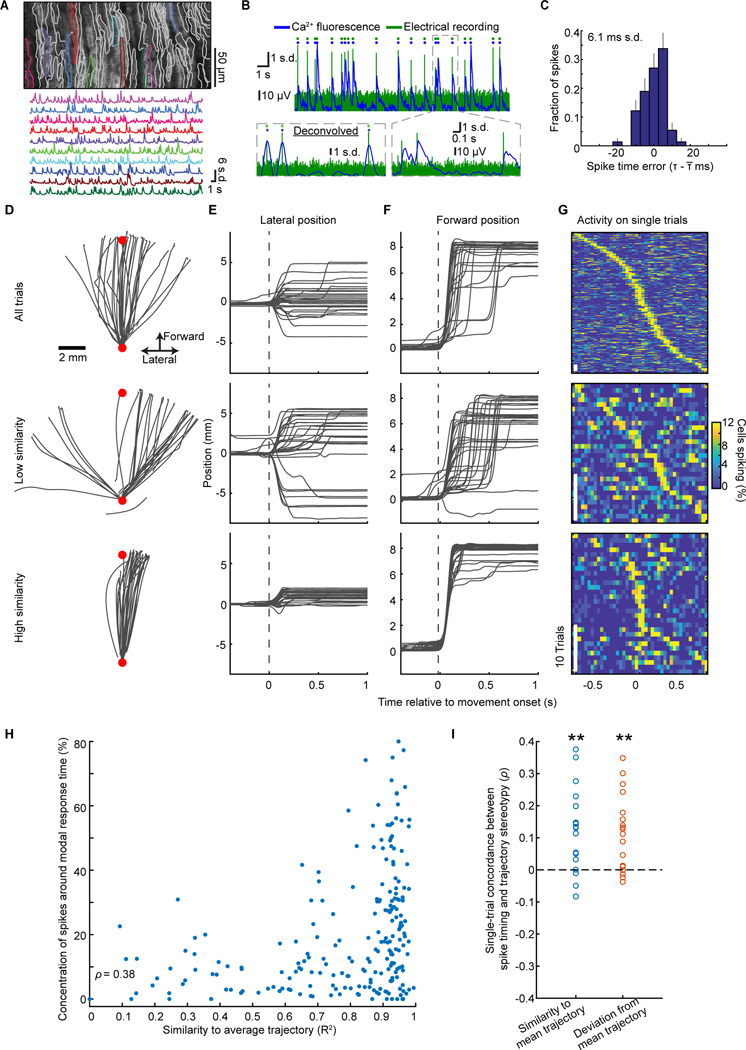
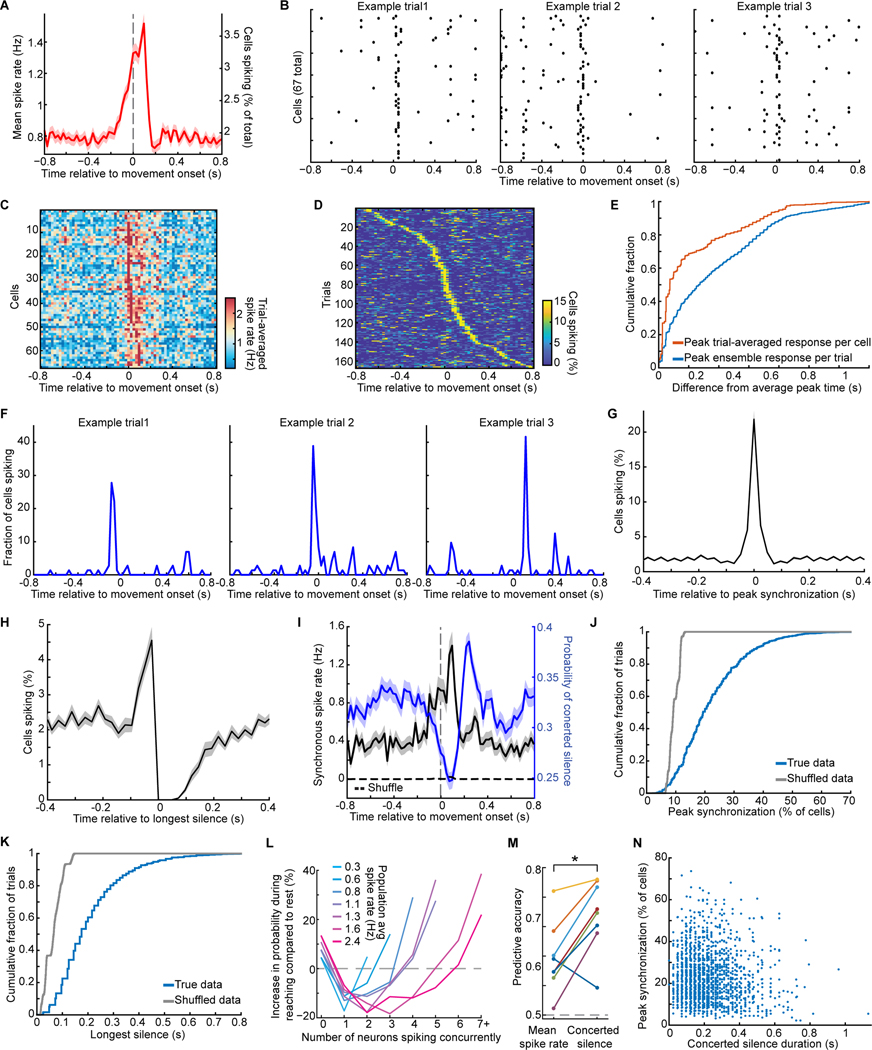
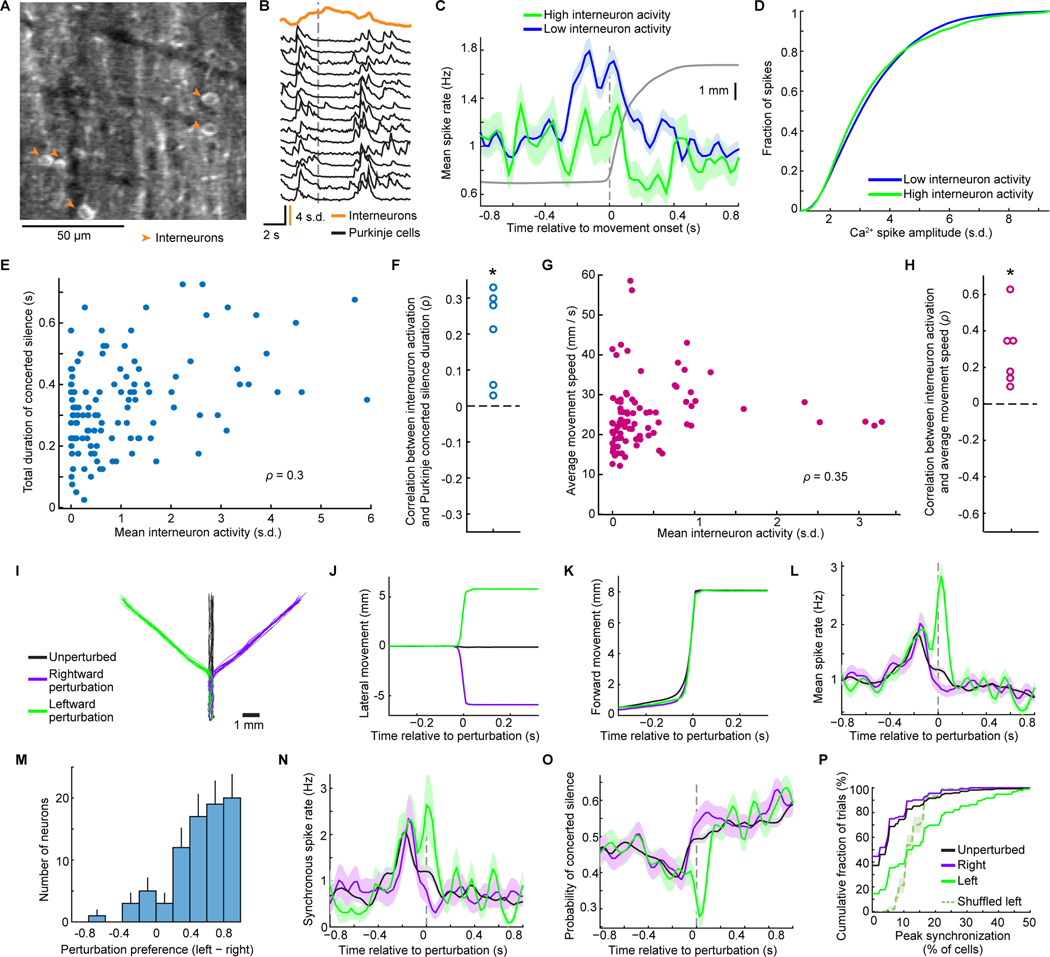
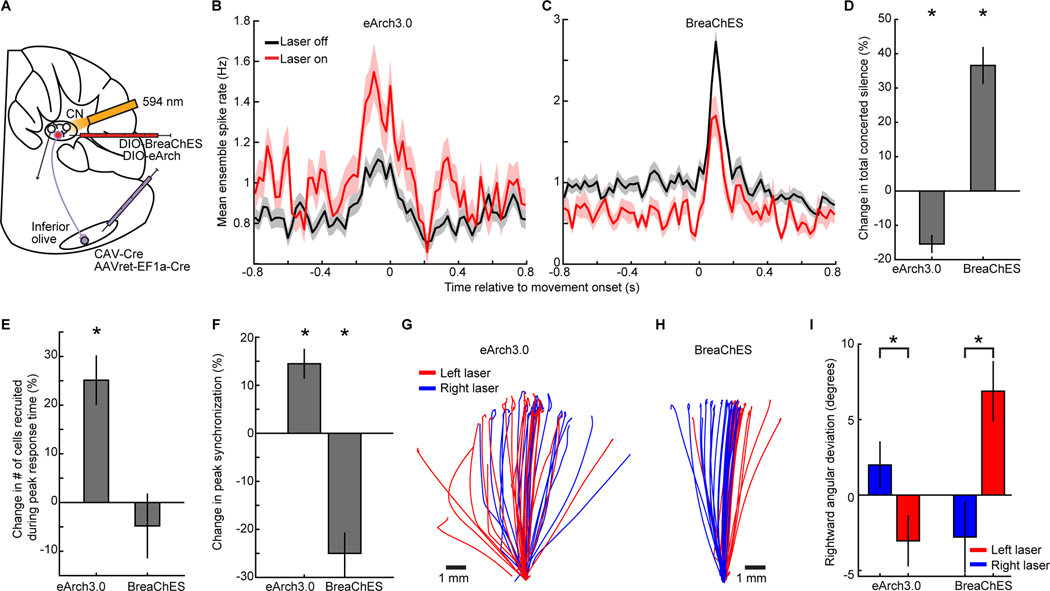
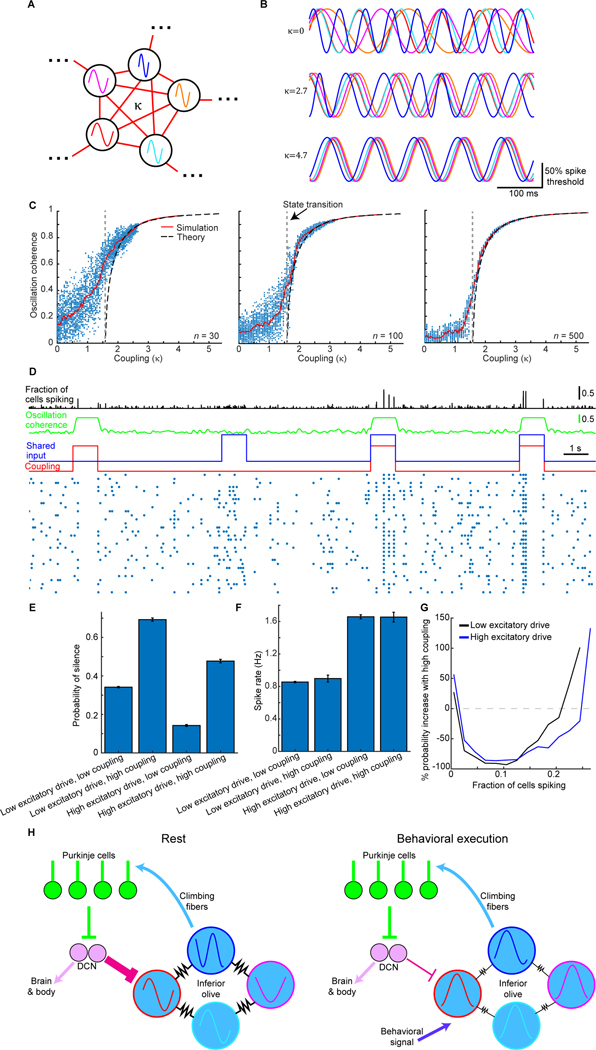
In motor neuroscience, state changes are hypothesized to time-lock neural assemblies coordinating complex movements, but evidence for this remains slender. We tested whether a discrete change from more autonomous to coherent spiking underlies skilled movement by imaging cerebellar Purkinje neuron complex spikes in mice making targeted forelimb-reaches. As mice learned the task, millimeter-scale spatiotemporally coherent spiking emerged ipsilateral to the reaching forelimb, and consistent neural synchronization became predictive of kinematic stereotypy. Before reach onset, spiking switched from more disordered to internally time-locked concerted spiking and silence. Optogenetic manipulations of cerebellar feedback to the inferior olive bi-directionally modulated neural synchronization and reaching direction. A simple model explained the reorganization of spiking during reaching as reflecting a discrete bifurcation in olivary network dynamics. These findings argue that to prepare learned movements, olivo-cerebellar circuits enter a self-regulated, synchronized state promoting motor coordination. State changes facilitating behavioral transitions may generalize across neural systems.

Keywords: Purkinje cells; calcium imaging; cerebellum; climbing fibers; coupled oscillators; motor learning; neural circuit dynamics; state change; synchronization; two-photon microscopy.


Conflict of interest statement

Declaration of interests O.R., M.J.S., J.L., T.H.K., and J.S. are inventors on a patent, assigned to Stanford, for the two-photon mesoscope. K.D. and C.R. have disclosed all novel opsins to Stanford, which has submitted patent applications to facilitate commercial application and translation; all opsin methods, protocols, clones, and sequences are freely available to nonprofit institutions and investigators.

Figures

Figure 1.
Figure 1.. A Targeted Arm-Reaching Task.
(A) During Ca2+ imaging, mice directed a robotic manipulandum toward a target zone. (B, C) Gray curves: Paw trajectories on 25 trials by an example mouse on training days 1 (B) and 8 (C). Black and red dots: Start and target positions, respectively. Dashed curve: 8-mm-distance at which the robot halted movement. (D). Mean lateral displacements between reach endpoints and target location. (E). Reaching stereotypy, assessed by the correlation coefficient of individual reaching trajectories to each day’s mean trajectory (p<10−6; rank sum test between Days 1, 8; n=8 mice; 1105–1688 total trials per day). Error bars: SEM. See Figure S1.
Figure 2.
Figure 2.. Ca2+-spiking with Millimeter-scale Coherence Arises with Motor Learning.
(A) Using a mesoscope, we imaged Purkinje cell Ca2+-spiking activity in lobules V and VI (area in green, inset) of PCP2-Cre/Ai148 mice. 494 cells from one mouse are shown in color. (B) Ca2+ activity traces of 50 cells. (C) For all cells in A, each row shows one cell’s activity relative to reach onset, averaged over all (194) trials. (D) Mean Ca2+ activity for cells right or left of the midline, averaged across all cells and trials from the final session in 3 mice. Cells right of midline had greater peak activity (p<10−6; rank-sum test; 453 and 698 total cells left and right of midline). Shading: SEM. (E) Cumulative distributions of the peak fraction of cells that spiked concurrently during reaching. Peak synchronization was higher right of midline (p<10−6; Kolmogorov-Smirnov test; 590 trials; 3 mice on their last session). (F) With motor training, cells developed similar activity patterns. For an example mouse, each plot is for one day; each row shows one cell’s activity relative to reach onset, averaged across trials. Cells are sorted by time of peak activity. (G) Variability between different cells’ dynamics declined with learning. We identified the time at which the greatest number of cells had their peak activity. We then computed the mean interval between this time and when individual cells had their peak activity. Error bars: SEM across all cells (3 mice). Timing variability was lower on Day 8 than Day 1 (p<10−6; rank-sum test; 606−1173 cells per day). (H) With training, cells’ dynamics grew more synchronized and stereotyped. For the mouse of F, each row shows, for one trial, the percentage of cells spiking synchronously (trials sorted by time of peak synchronized activity). (I) Across learning, trial-to-trial variations declined regarding the time at which peak synchronized activity arose. For each trial we identified the time bin with the greatest percentage of active cells. For each mouse and session, we also computed the time bin at which the greatest number of trials exhibited their peak synchrony. The differences between this identified time bin and the time of peak synchrony on single trials were lower on Day 8 than Day 1 (p<10−6; rank-sum test; n=273–655 trials per day). Error bars: SEM over trials. (J) Spatial cross-correlations of spiking activity, averaged over all cell pairs with a given spatial separation, early or late in training and for reaching vs. inter-trial periods (24 total days; 3 mice). Millimeter-scale correlations rose with learning. (K) Mean ± SEM peak percentages of cells that spiked concurrently in a 25 ms time bin within ±800 ms of reach onset. (L) Mean distances between reach endpoints and the target negatively co-varied with the mean peak synchronization of Ca2+ spiking. Each datum is from one mouse, on one day (24 total days; 3 mice). Black curve: double exponential fit. See Figure S2.
Figure 3.
Figure 3.. Complex Spike Synchronization Covaries with Movement Stereotypy.
(A) Top, Perimeters of Purkinje cells’ dendritic trees atop a mean two-photon image of cerebellar cortex. Bottom, Ca2+ traces for 10 cells colored in top panel. (B) Example dual electrical and fast line-scanning Ca2+ recordings. Rasters mark identified spikes. Insets: Magnified views of 3 spikes in raw (right) and deconvolved (left) optical traces. (C) Histogram of spike timing errors for the cell in B (s.d.:6.1 ms; 152 spikes). Error bars: s.d. estimated based on counting errors. (D–F) Top, Example reaching trajectories, (D), chosen randomly from one mouse’s trials, and their lateral (E) or forward (F) time-dependence. Middle, bottom panels show 30 trajectories that were most dissimilar (middle) or similar (bottom) to the mean trajectory. Red dots: Start and target locations. (G) For trials of D–F, each row shows the time-varying synchronized complex spiking on one trial. Stereotyped reaching trials were more likely to have synchronized spiking at motion onset. (H, I) For the mouse of D–G, we assessed movement stereotypy by scoring trials (individual data points; H) by their similarity (R2) to the mean trajectory (x-axis), and the fraction of cells that spiked at the cell population’s most common response time (y-axis; p<10−6; Spearman’s ρ=0.4; 219 trials). I, Spearman’s ρ, computed as in H for 18 mice (blue points). Using the RMS-deviation from the mean trajectory (orange points) as a stereotypy metric led to nearly the same results (**p=0.002; signed-rank test for non-zero median). See Figures S3, S4.
Figure 4.
Figure 4.. Synchronized Spiking and Concerted Silence Arise During Reaching and Reflect Intrinsic Synchronization, Not Task-related Changes in Spiking.
(A) Complex spike rates rose before reach onset (averaged over 695 cells, 2552 trials by 15 mice). Shading: SEM across trials. (B) Spike raster plots for 67 cells and 3 trials of one mouse reveal synchronized spiking near reach onset, then a global silence. (C, D) Trial-averaged spike rates, (C), and time-varying percentages of cells spiking synchronously on single trials, (D), for cells of B. (E) Cumulative distributions reveal greater trial-to-trial variability in the timing of peak synchronization (blue curve) than cell-to-cell variability in the times of peak activity in trial-averaged traces (orange curve) (p<10−6; Kolmogorov-Smirnov test; 2552 trials as in A), indicative of a coherent state in which large sets of cells spike concurrently, but at times that vary trial-to-trial relative to reach onset. (F) Example traces of the fraction of cells that spiked on different trials, with peak synchrony before, at, or after reach onset. (G,H) Spiking synchronization within −0.4–0.4 s of each rtial’s time of peak synchronization, G, or onset of each trial’s longest concerted silence, H, averaged across all trials for each mouse, and then across mice. Shading: SEM over 15 mice. (I) Rates of synchronous spiking (>20% of visible Purkinje cells; black trace) and full-field concerted silence (blue trace), averaged over the 2552 trials of A. Trial-shuffled data (dashed trace) had almost no synchronous spiking. Shading: SEM across trials. (J, K) Cumulative distributions across all trials of peak synchrony levels, J, and the longest concerted silence, K. (p<10−6 for real vs. trial-shuffled datasets; Kolmogorov-Smirnov tests; 2552 trials). (L) Percentage changes in the probabilities of 0–7 cells spiking together in the same 25-ms time bin, for reaching vs. resting epochs, in periods with different spike rates (8 mice; >2,500 time points per curve). Reaching suppressed events with 1 (p<6×10⁻⁴), 2 (p<5×10⁻⁴ for all firing rates ≥0.8 Hz), or 3 active cells (p<4×10⁻⁴ for rates ≥1.6 Hz; chi-squared test; 1,693 reaches; 302 cells; 8 mice), but boosted concerted silence and large-scale synchronized spiking. (M) In a receiver operating characteristic analysis, concerted silence better discriminated resting epochs vs. reaching (100–400 ms after reach onset) than mean spike rates (p=0.016; signed-rank test; 8 mice). (N) Magnitudes of concerted silence and synchronous spiking on single trials (individual points) were uncorrelated (p=0.22; 2552 reaches, 15 mice). See Figures S5.
Figure 5.
Figure 5.. Interneuron Activation Accompanies Concerted Silence in Purkinje Cells and Purkinje Cell Populations Encode Movement Perturbations.
(A) In some mice, GCaMP6f expressed in both Purkinje cells and molecular layer interneurons (marked by arrowheads in a mean two-photon image). (B) A rise in Ca2+ activity summed across interneurons (15 cells; orange trace) coincided with concerted silence in all 46 visible Purkinje cells in an example mouse (traces shown for 15 cells). Vertical line: onset of forelimb reaching. (C) Mean rate of complex spiking by Purkinje cells (6 mice) on trials when interneurons were highly or weakly active (105 reaches with interneuron activity >1 s.d. above the mean, 525 reaches with interneuron activity less than the mean within −500 to 500 ms of reach onset; 62 interneurons; 219 Purkinje cells; 1048 trials). (D) Cumulative distributions of Ca2+ spike amplitudes across trials with high (green) or low (blue) interneuron activity levels. (E,F) For an example mouse, E, mean interneuron activity on individual reaching trials (points) covaried with the duration of Purkinje cell concerted silence (119 trials, p=0.0009, permutation test for Spearman correlation). F, Results for all 6 mice (*p=0.03 signed-rank test). (G, H) Movement speed vs. mean interneuron activation on individual trials, G, for the mouse of E (p=0.008), showing that interneuron activation was predictive of faster movements. Results from 6 mice, H, (*p=0.03 signed-rank test). (I) In the perturbation task, the robot displaced forward-constrained reaches on a random 25% of trials (12.5% each to the left or right). Traces: 20 trajectories of each type. (J, K) Mean trajectories decomposed into lateral, J, and forward motion, K, for the mouse in I. (L) After the perturbation, mean spike rates were greater for leftward perturbations (p<10−6comparing the 50 ms after the perturbation for 113 rightward vs. 115 leftward trials; 780 unperturbed trials; 80 cells; 3 mice in L–P; rank-sum test). Dashed vertical line: Occurrence of a 4 mm lateral deviation. (M) Histogram of individual cells’ perturbation preferences, (RleftRright)/(Rleft+Rright), where R is the cell’s mean spike rate from 0−50 ms after the perturbation. Error bars: s.d. estimated based on counting errors. (N, O) Trial-averaged rates of synchronized spiking (with ≥20% of visible cells), N, and concerted silence, O. Leftward perturbations induced more synchronized spiking (p<10–6 rank-sum test). (P) Cumulative distributions of the largest set of cells spiking concurrently 0−50 ms after the perturbation. Trial-shuffled data had less synchrony (p=0.01; permutation test). Shading in C,J–L,N,O: SEM over trials.
Figure 6.
Figure 6.. Cerebellar Feedback to the Inferior Olive Regulates Purkinje Cell Synchrony.
(A) To retrogradely target axons of fastigial nuclear cells, we injected Cre-expressing virus bilaterally (7 mice) or in the left inferior olive (3 mice). To inhibit or excite feedback to the olive, fastigial nuclei received virus for Cre-dependent expression of, respectively, eArch3.0 (7 mice; 4 bilateral, 3 ipsilateral to the reaching paw) or BreaChES (3 mice bilaterally) and 594-nm-laser light. (B,C) Mean complex spike rates in Purkinje cells on reaching trials without vs. with fastigial inhibition (B; 1268 laser-off, 374 laser-on trials; 7 mice) or excitation (C; 547 laser-off, 147 laser-on trials; 3 mice). (20–30% probability per trial of laser activation; illumination lasted across the trial). (D,E) Inhibiting the feedback pathway reduced the total duration, D, of concerted silence; excitation increased it (*p<10−6; signed-rank tests in D–F; y-axes show changes from mean levels during laser-off trials in each mouse). Inhibiting the feedback also raised (*p=0.0006) the fraction of cells, E, that spiked on each trial at the modal response time, computed as in Figure 3. (F) Peak levels of complex spike synchronization were boosted by inhibition and reduced by excitation of the feedback pathway (from the studies in B,C, p=0.003 for inhibition; p<10−6 for excitation). (G–I) Right paw trajectories of mice with bilateral fiber-optic implants during inhibition (G) or excitation (H) of the left or right feedback pathway (random 20% of trials each). (I), Unilateral inhibition (excitation) biased motion in the direction ipsilateral (contralateral) to the illuminated nucleus (*p=0.01 for eArch3.0; 3×10⁻⁶ for BreaChES, for left (91 trials) vs. right (86 trials) illumination in 4 mice with eArch3.0, or 75 left vs. 68 right illumination trials by 3 mice with BreaChES; rank sum test). Shading and error bars in B–F,I: SEM over trials. See Figure S6.
Figure 7.
Figure 7.. A Network of Kuramoto Oscillator Cells Exhibits a Dynamical Bifurcation and Captures Key Facets of Purkinje Cell Complex Spiking Before and After the State Transition.
(A) We simulated a network of olivary cells, each with a natural frequency of sub-threshold oscillation, chosen from a normal distribution (10 ± 2 Hz (s.d.)). The electrical couplings between cells, κ, sets the phase coherence and has units normalized by the frequency dispersion (2 Hz). (B) 5 cells’ oscillations at different κ values. At high κ, cells adopt a common frequency and phase. (C) Oscillatory coherence vs. κ, for networks of 30, 100 or 500 cells. Each datum shows the coherence at one 2-ms-time-step. Red curves: Median coherence values. Dashed black curves: Predictions from a mean field theory of the Kuramoto model (Acebrón et al., 2005). The theory has a bifurcation, in which the network switches from incoherent to coherent oscillations as κ exceeds a critical value (1.6; dashed vertical line). With finite numbers of cells, the state transition approximates the discrete bifurcation (compare red vs. black curves). (D–F) For a spiking model (100 cells), D, with sub-threshold noise and ~1 Hz spike rates, rasters (blue dots) show spikes for 30 example cells in 25-ms-time bins. When κ (red trace) rose from a value below (0.8) to above (4.7) the bifurcation in C, mimicking how fastigial inputs would affect gap junctions, oscillatory coherence (green trace) rose. Olivary cells also shared excitatory input (blue trace) with transient rises (1.4% of spike threshold). When coupling and input changes coincided, synchronized spikes (black trace), concerted silence (75 ms periods with no spikes), E, and spike rates, F, all rose, as in real data. Acting alone, neither transient change led to all 3 rises (E,F). Concerted silence was more likely at high κ, at both high and low levels of shared input (p<10−6; rank-sum test; 200 repetitions (1 s each) per condition). Error bars: SEM. (G) Changes in probabilities of differently sized synchronized spiking events (25 ms time bins) when κ rose from below to above its critical value, at low (black) or high (blue) shared input levels. Mimicking changes at reach onset (Figure 4L), synchronized spikes in small cell sets declined (p<10−6; rank-sum test; events with 1–15% of cells) but grew more likely in large sets (p<10−6; events with ≥30% of cells). (H) Putative olivocerebellar dynamics at rest vs. task execution. Olivary cells share gap junctions (resistors) and send climbing fibers to Purkinje cells that inhibit deep cerebellar nuclei (DCN) cells. DCN cells shunt (magenta projection) the olivary gap junctions. At rest, when shunting is strong, olivary cells’ coupling is weak and their oscillations desynchronize. At task execution, excitatory drive (dark blue) and spike rates rise in the olive, and shunting declines, which synchronizes the oscillations. See Figure S7.

References

    1. Abbott LF, and Rohrkemper R. (2007). A simple growth model constructs critical avalanche networks. In Progress in Brain Research, Paul Cisek TD, and John FK, eds. (Elsevier; ), pp. 13–19. - PubMed
    1. Acebrón JA, Bonilla LL, Pérez Vicente CJ, Ritort F, and Spigler R. (2005). The Kuramoto model: A simple paradigm for synchronization phenomena. Reviews of Modern Physics 77, 137–185.
    1. Apps R, and Hawkes R. (2009). Cerebellar cortical organization: a one-map hypothesis. Nat Rev Neurosci 10, 670–681. - PubMed
    1. Badura A, Schonewille M, Voges K, Galliano E, Renier N, Gao Z, Witter L, Hoebeek, Freek E, Chédotal A, and De Zeeuw, Chris I. (2013). Climbing Fiber Input Shapes Reciprocity of Purkinje Cell Firing. Neuron 78, 700–713. - PubMed
    1. Bazzigaluppi P, De Gruijl J, Van Der Giessen R, Khosrovani S, De Zeeuw C, and De Jeu M. (2012a). Olivary subthreshold oscillations and burst activity revisited. Frontiers in Neural Circuits 6. - PMC - PubMed

Publication types

MeSH terms