. 2021 Jul 8;184(14):3812-3828.e30.
doi: 10.1016/j.cell.2021.06.004. Epub 2021 Jul 1.

Humans with inherited T cell CD28 deficiency are susceptible to skin papillomaviruses but are otherwise healthy

Vivien Béziat  1 Franck Rapaport  2 Jiafen Hu  3 Matthias Titeux  4 Mathilde Bonnet des Claustres  4 Mathieu Bourgey  5 Heather Griffin  6 Élise Bandet  4 Cindy S Ma  7 Roya Sherkat  8 Hassan Rokni-Zadeh  9 David M Louis  10 Majid Changi-Ashtiani  11 Ottavia M Delmonte  12 Toshiaki Fukushima  13 Tanwir Habib  14 Andrea Guennoun  14 Taushif Khan  14 Noemi Bender  15 Mahbuba Rahman  14 Frédégonde About  4 Rui Yang  2 Geetha Rao  7 Claire Rouzaud  16 Jingwei Li  3 Debra Shearer  3 Karla Balogh  3 Fatima Al Ali  14 Manar Ata  14 Soroosh Dabiri  17 Mana Momenilandi  18 Justine Nammour  4 Marie-Alexandra Alyanakian  19 Marianne Leruez-Ville  19 David Guenat  20 Marie Materna  4 Léa Marcot  4 Natasha Vladikine  4 Christine Soret  20 Hassan Vahidnezhad  21 Leila Youssefian  21 Amir Hossein Saeidian  21 Jouni Uitto  21 Émilie Catherinot  22 Shadi Sadat Navabi  23 Mohammed Zarhrate  4 David T Woodley  24 Mohamed Jeljeli  25 Thomas Abraham  3 Serkan Belkaya  2 Lazaro Lorenzo  4 Jérémie Rosain  16 Mousa Bayat  17 Fanny Lanternier  16 Olivier Lortholary  16 Faramarz Zakavi  26 Philippe Gros  27 Gérard Orth  28 Laurent Abel  29 Jean-Luc Prétet  20 Sylvie Fraitag  19 Emmanuelle Jouanguy  29 Mark M Davis  30 Stuart G Tangye  7 Luigi D Notarangelo  12 Nico Marr  14 Tim Waterboer  15 David Langlais  27 John Doorbar  6 Alain Hovnanian  16 Neil Christensen  3 Xavier Bossuyt  18 Mohammad Shahrooei  31 Jean-Laurent Casanova  32
Affiliations

Humans with inherited T cell CD28 deficiency are susceptible to skin papillomaviruses but are otherwise healthy

Vivien Béziat et al. Cell. .

Abstract

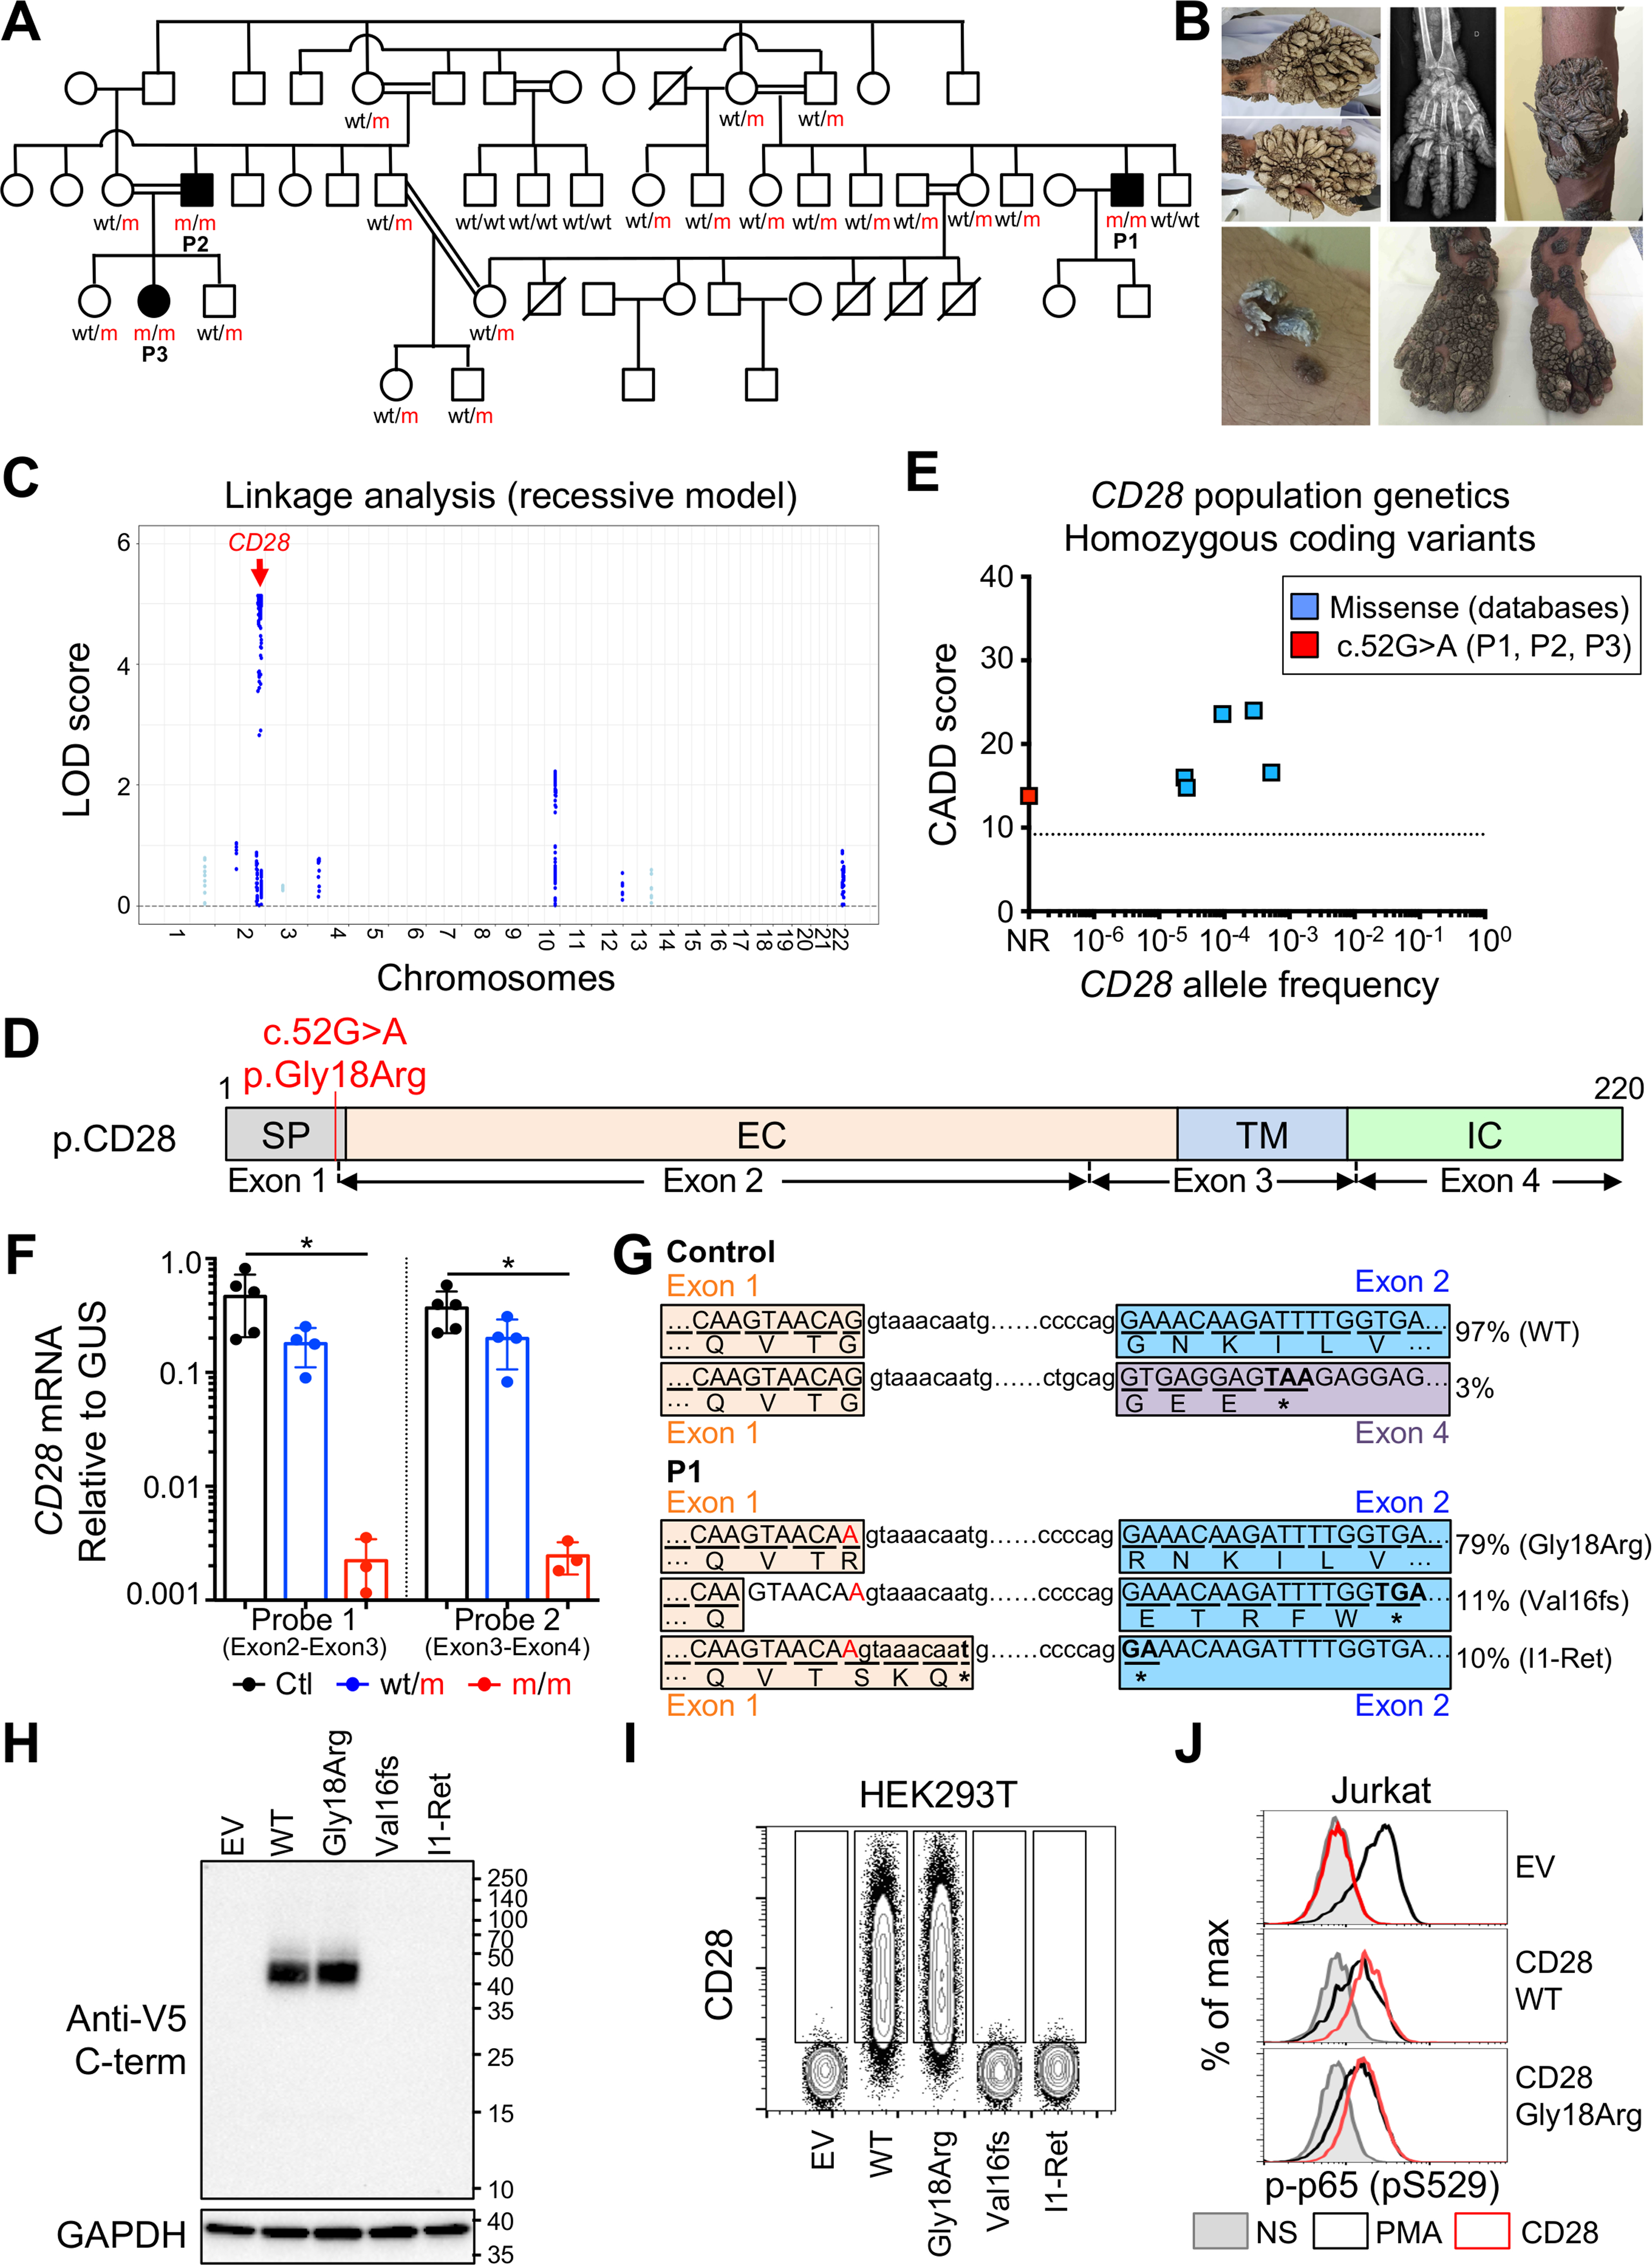
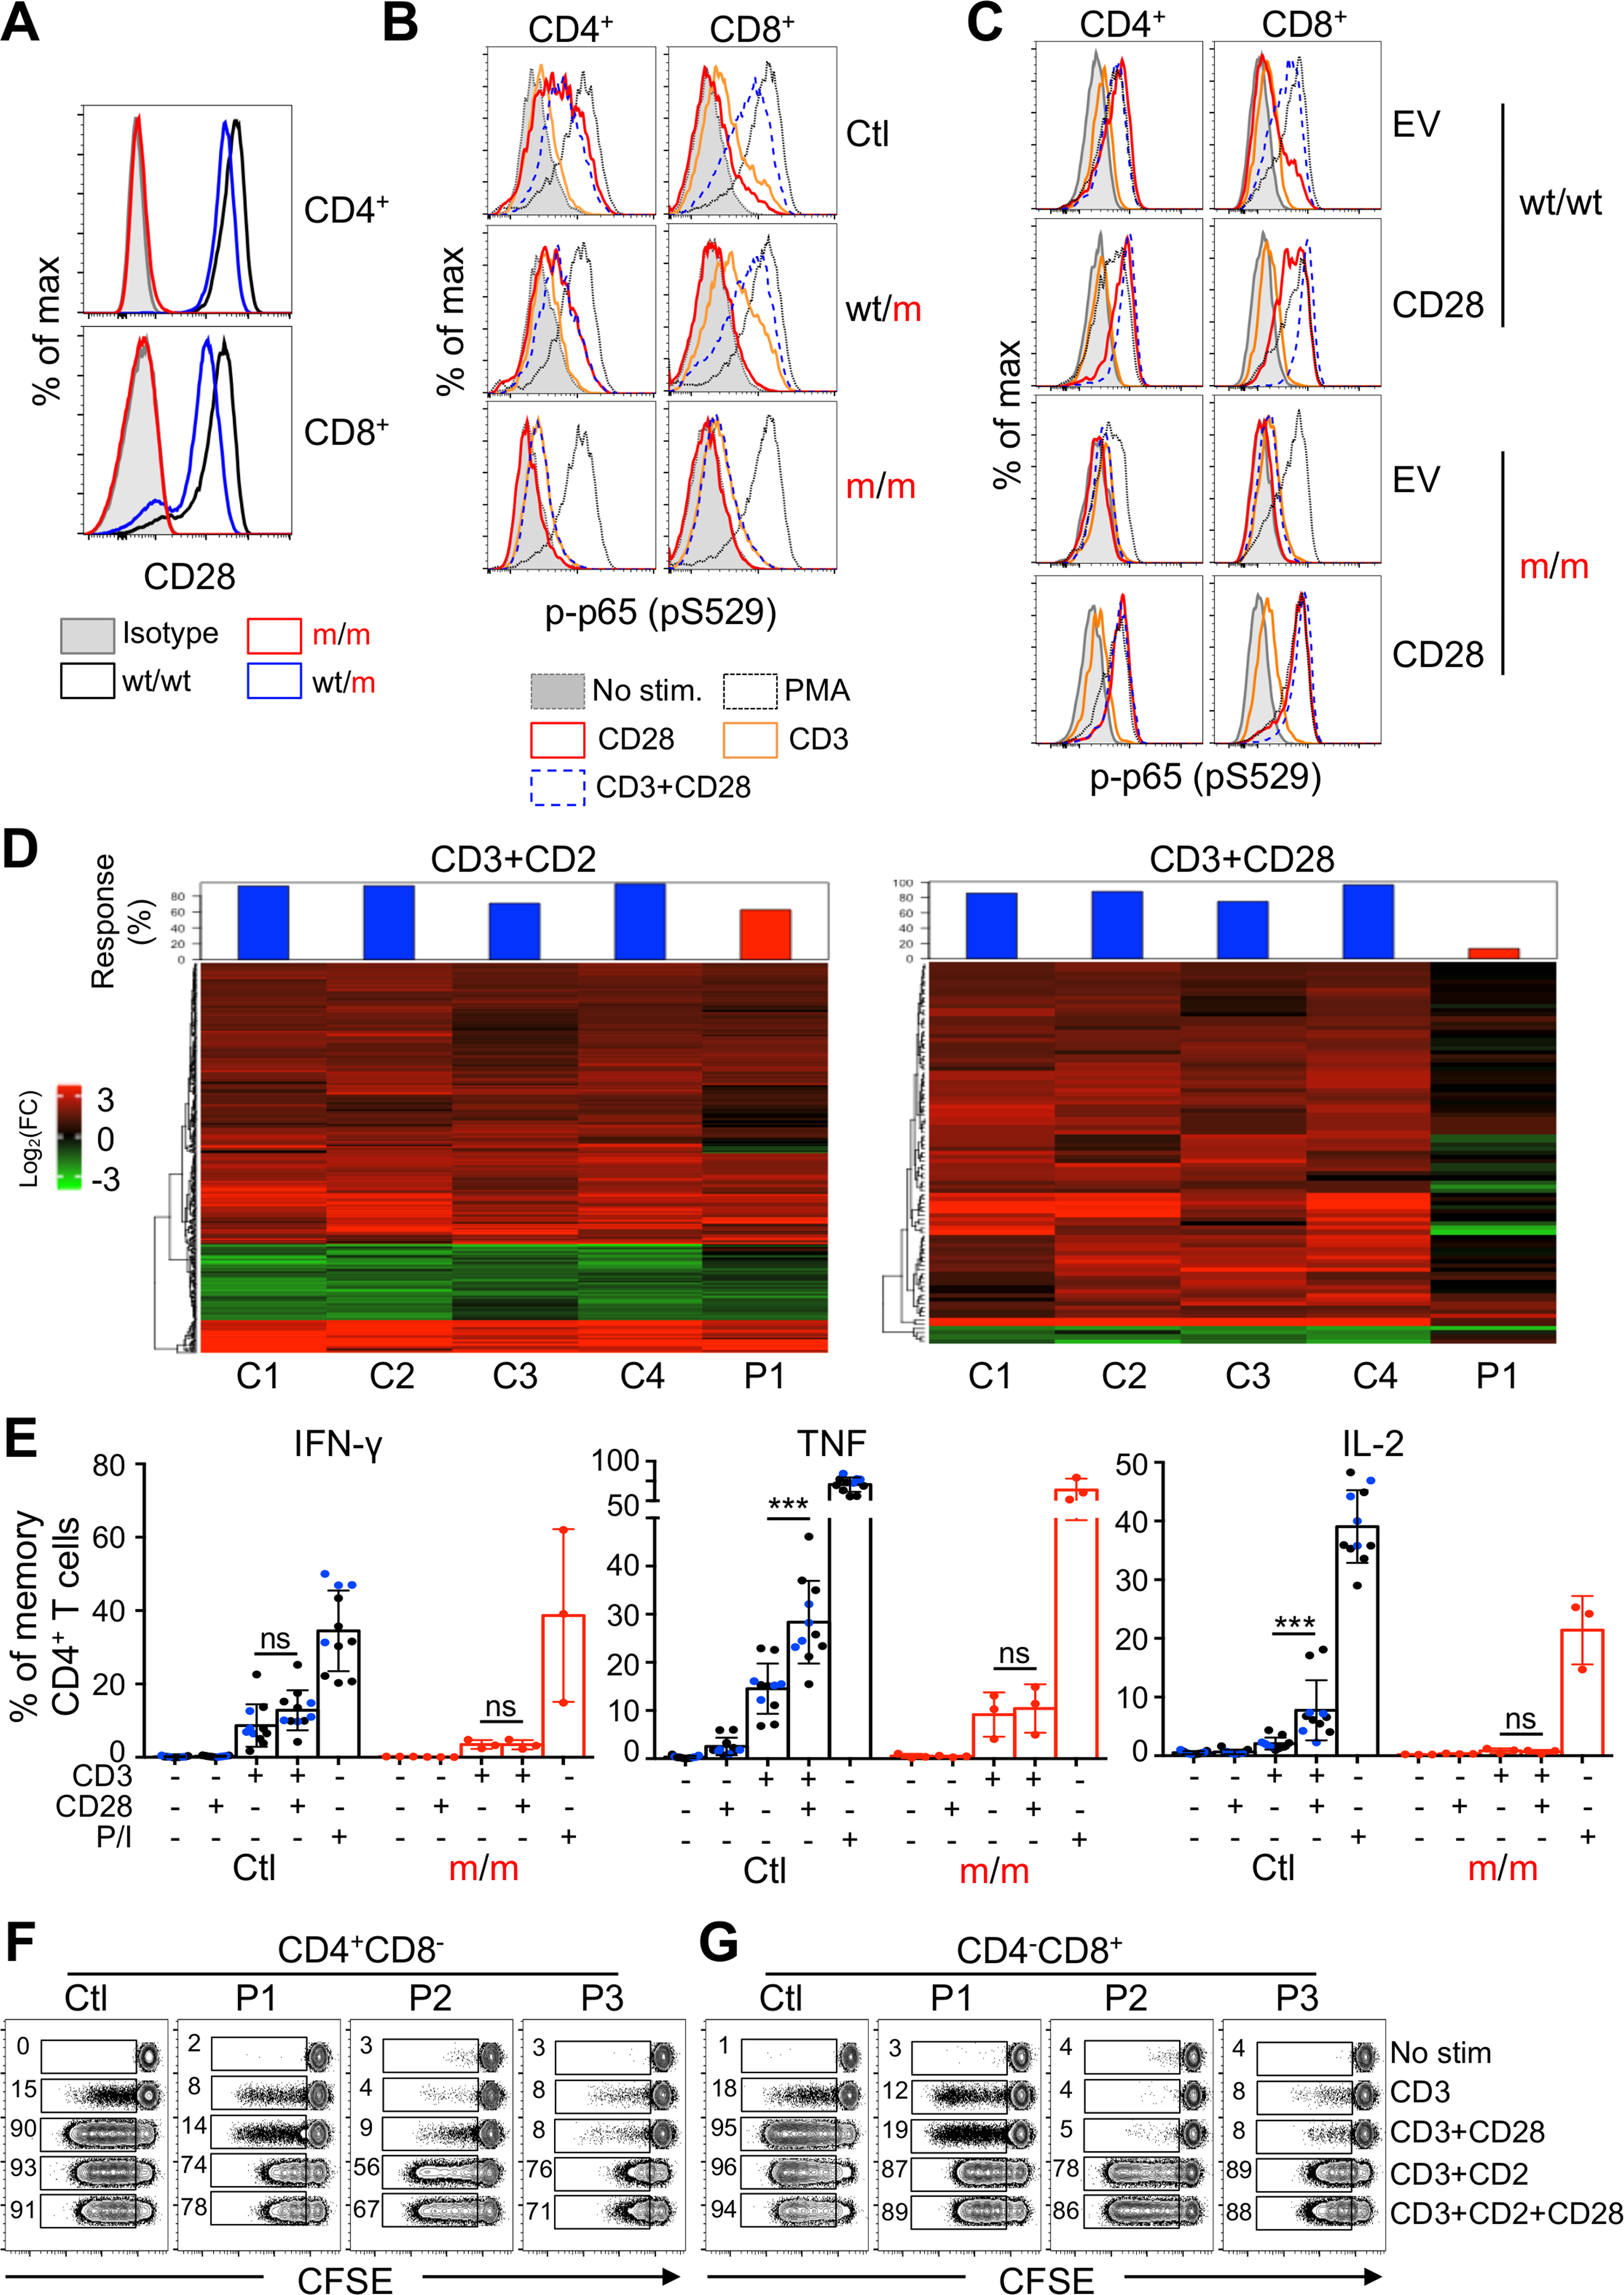
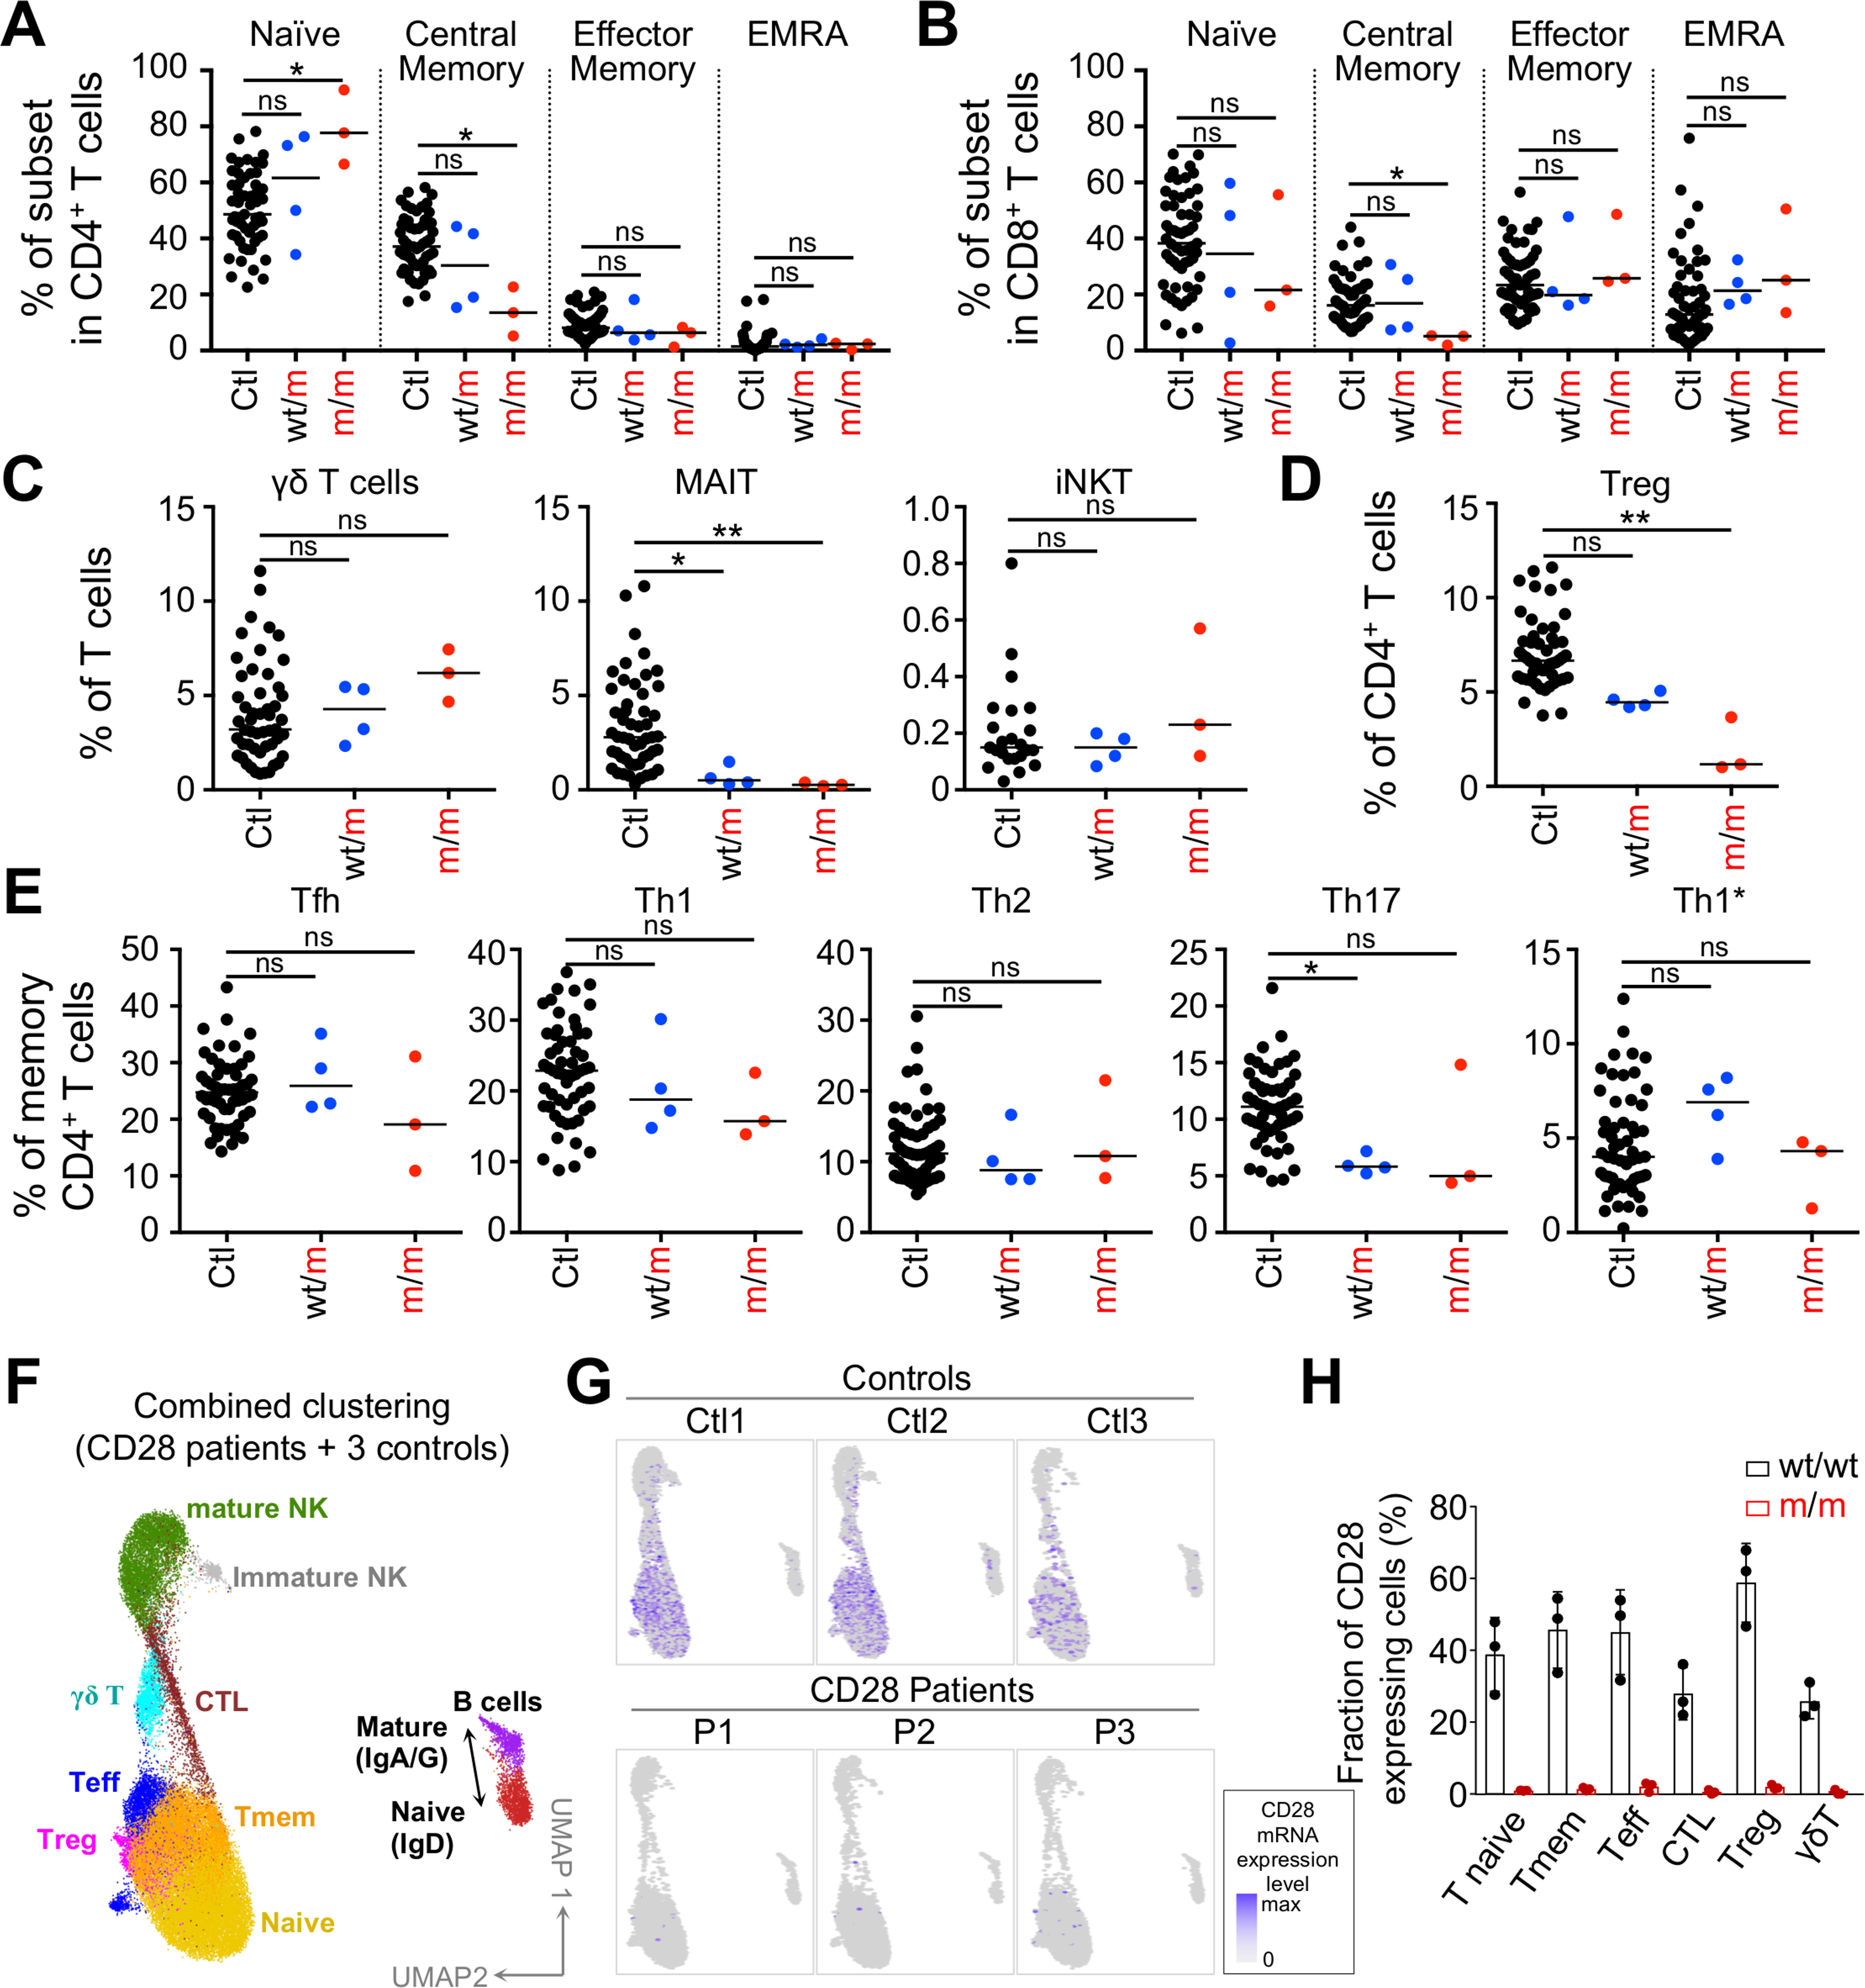
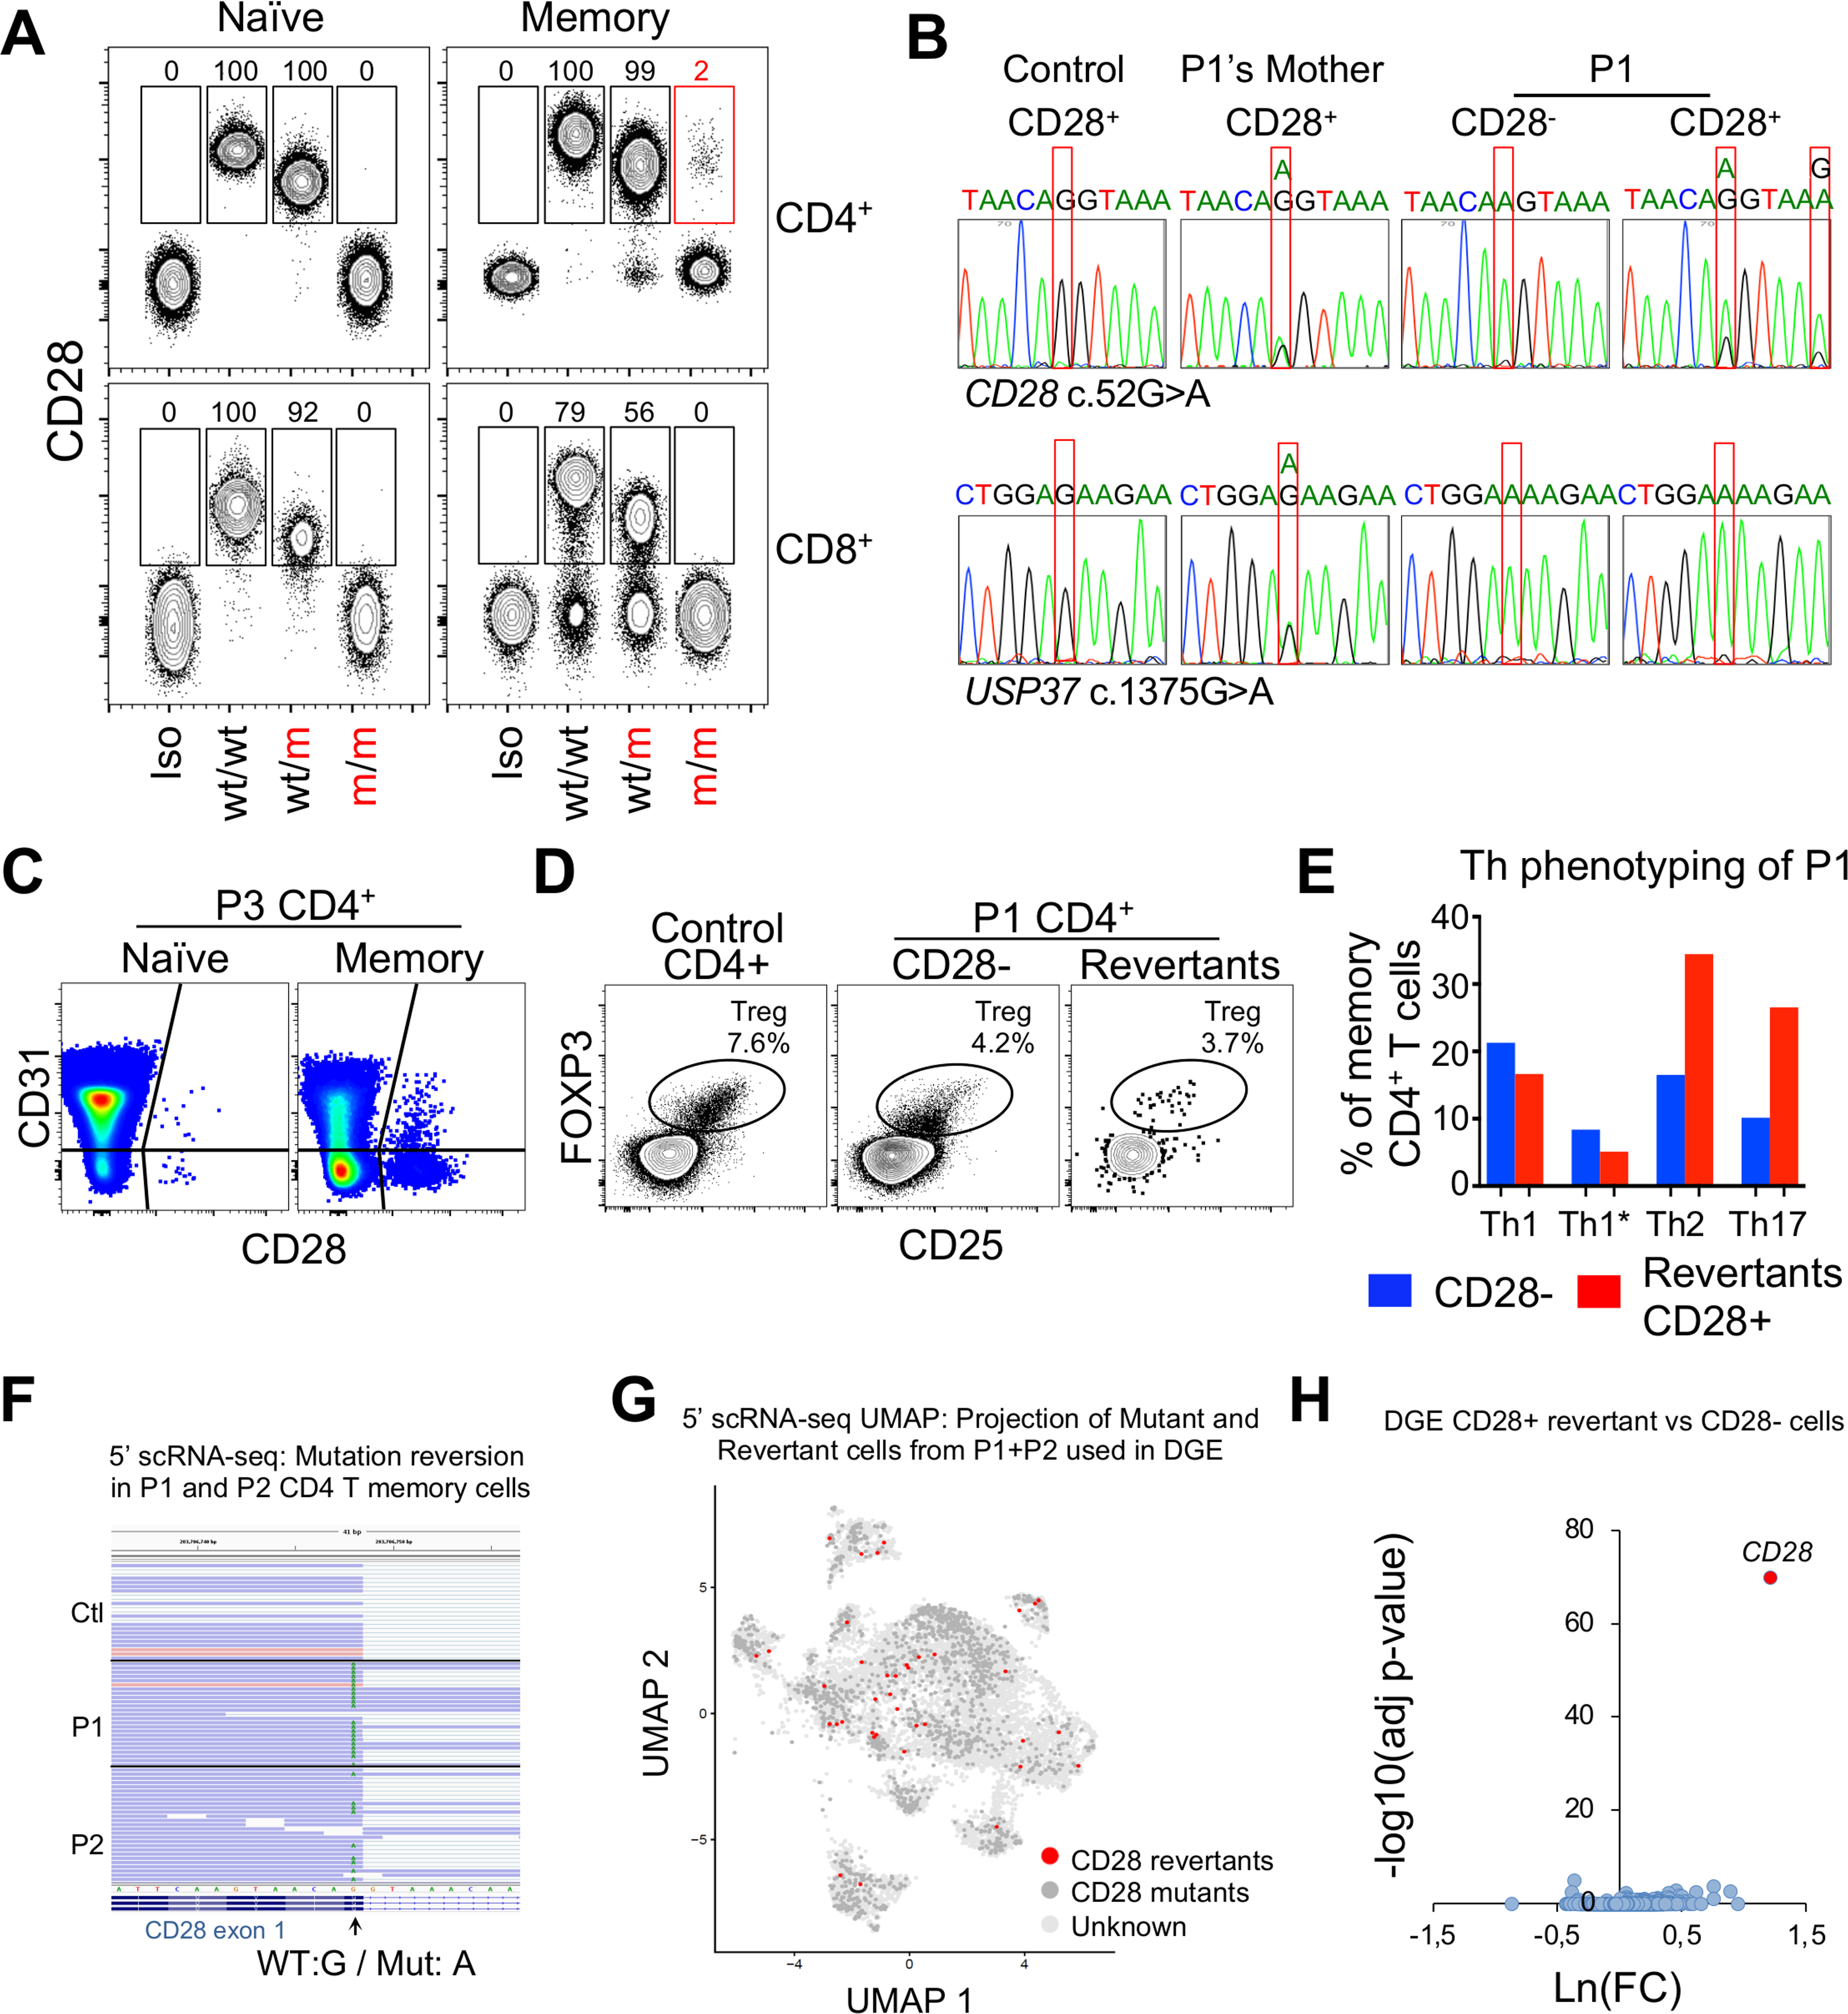
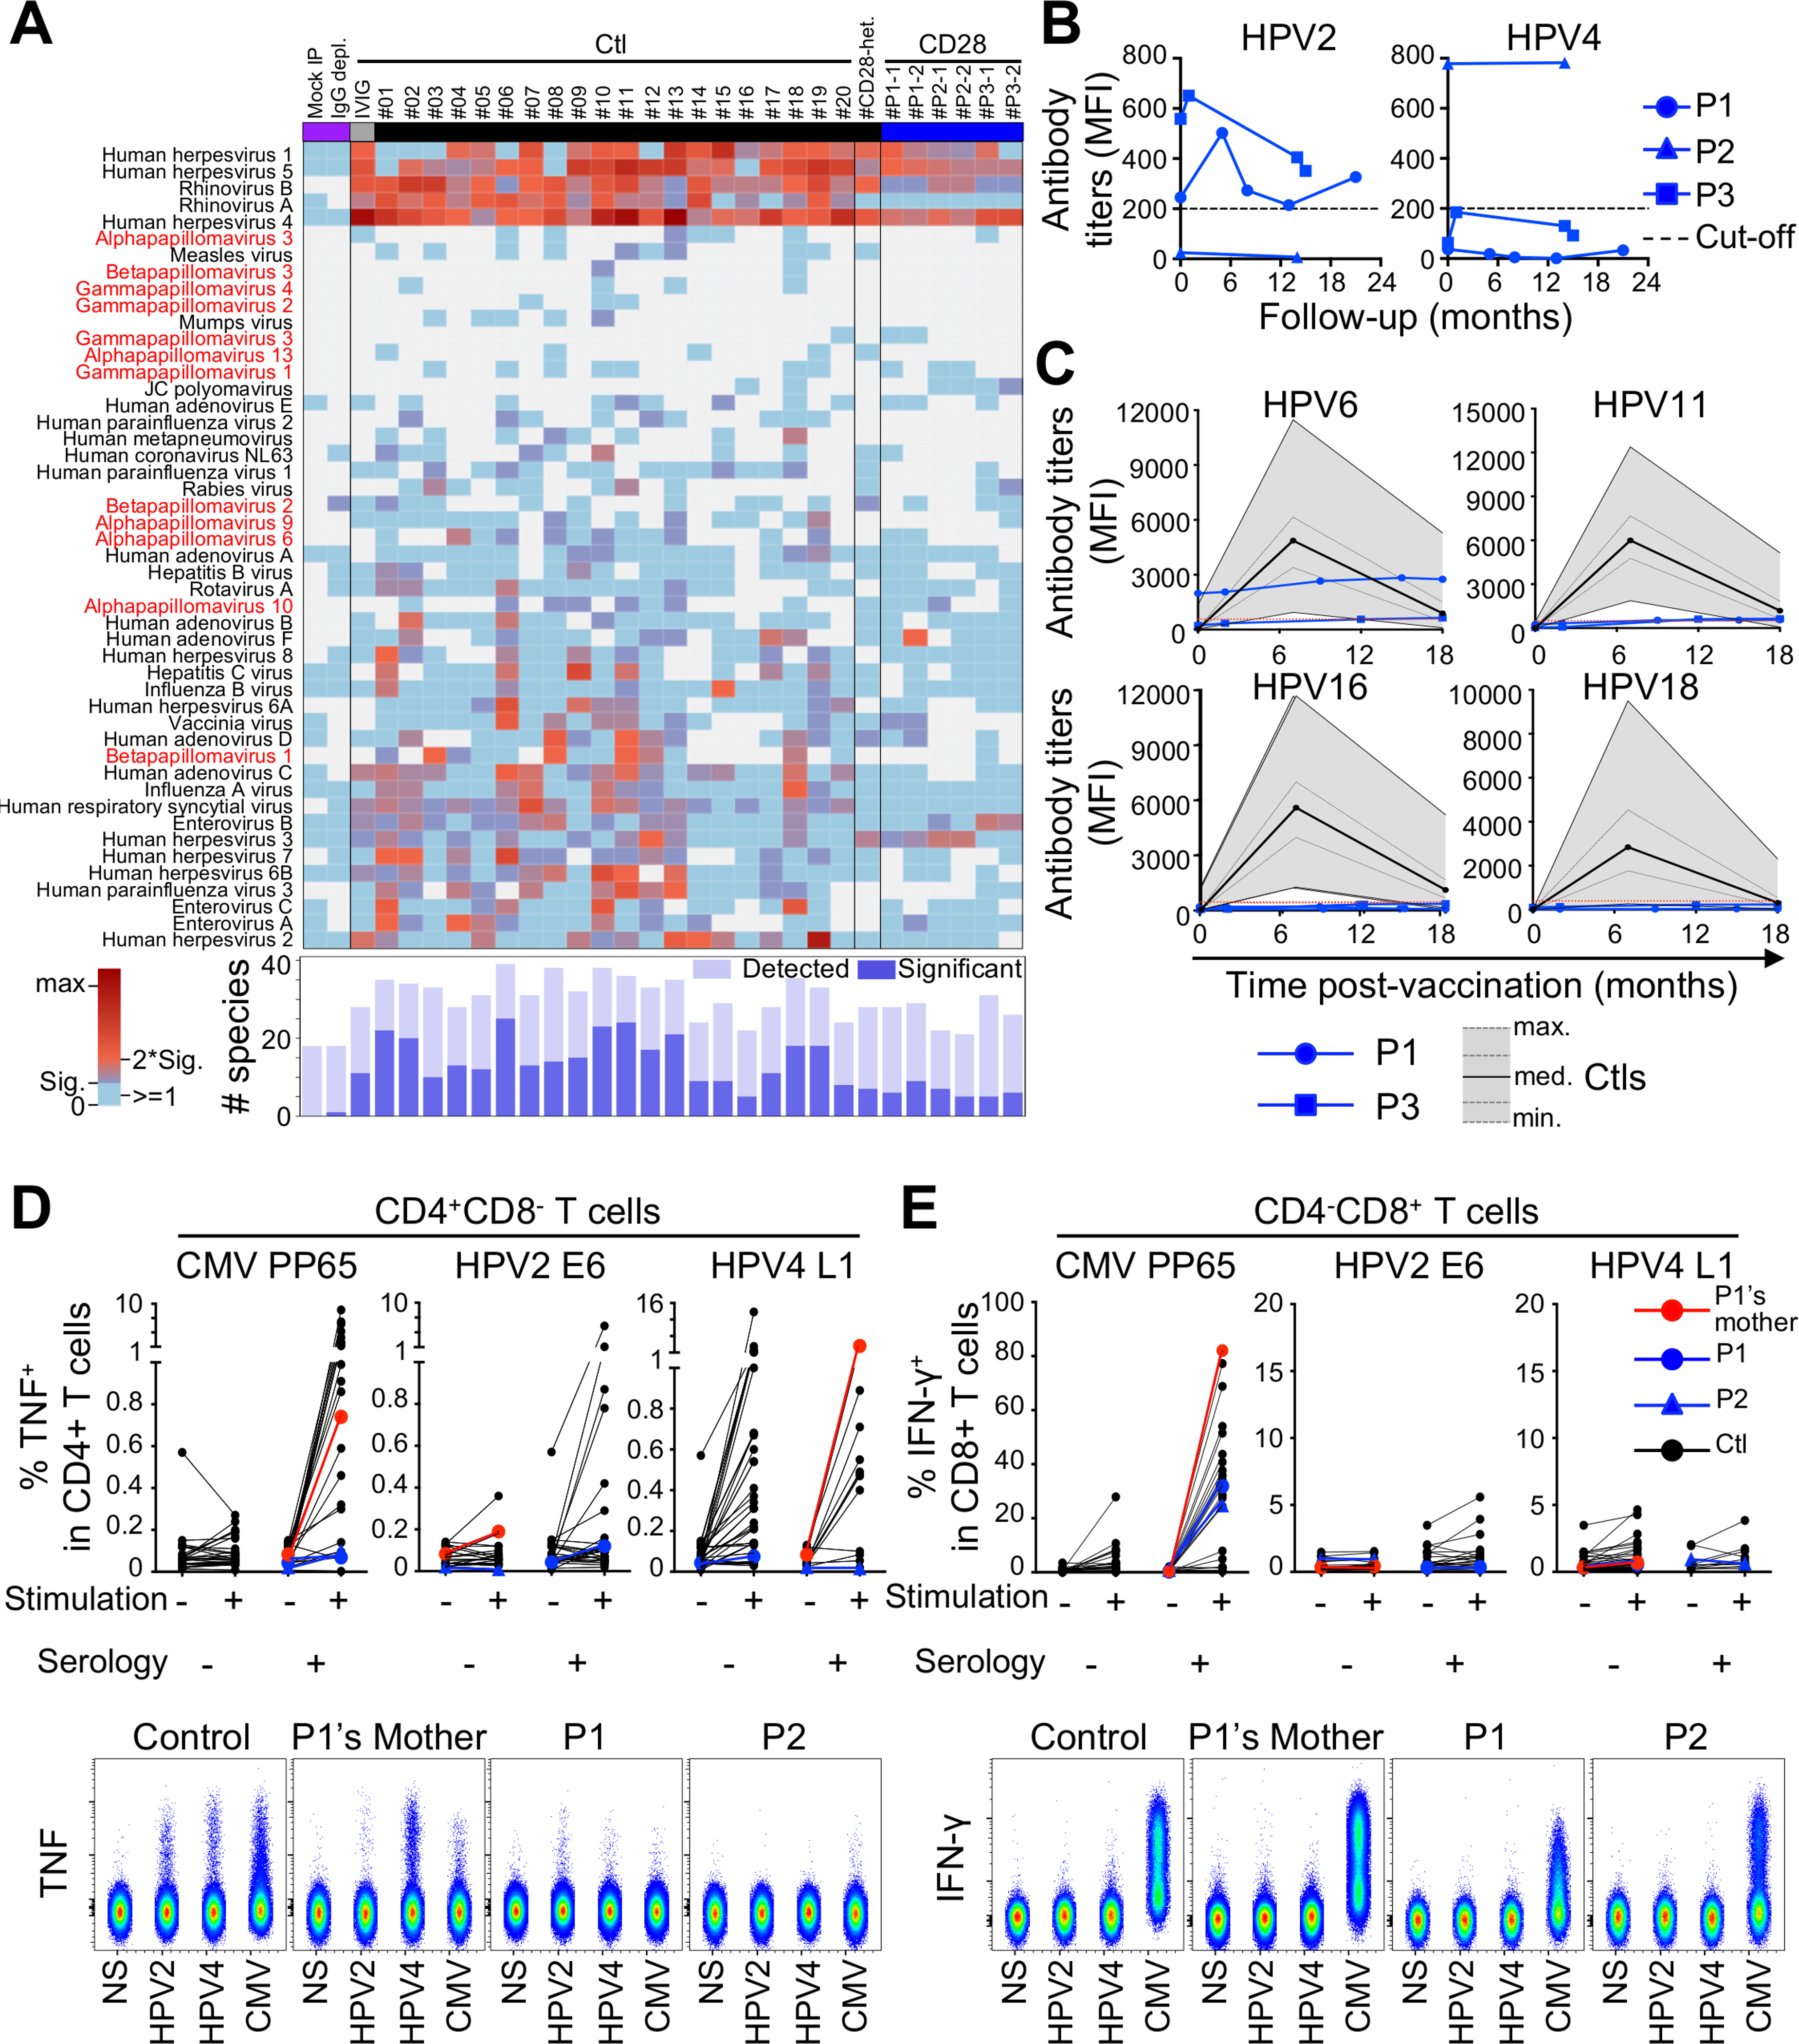
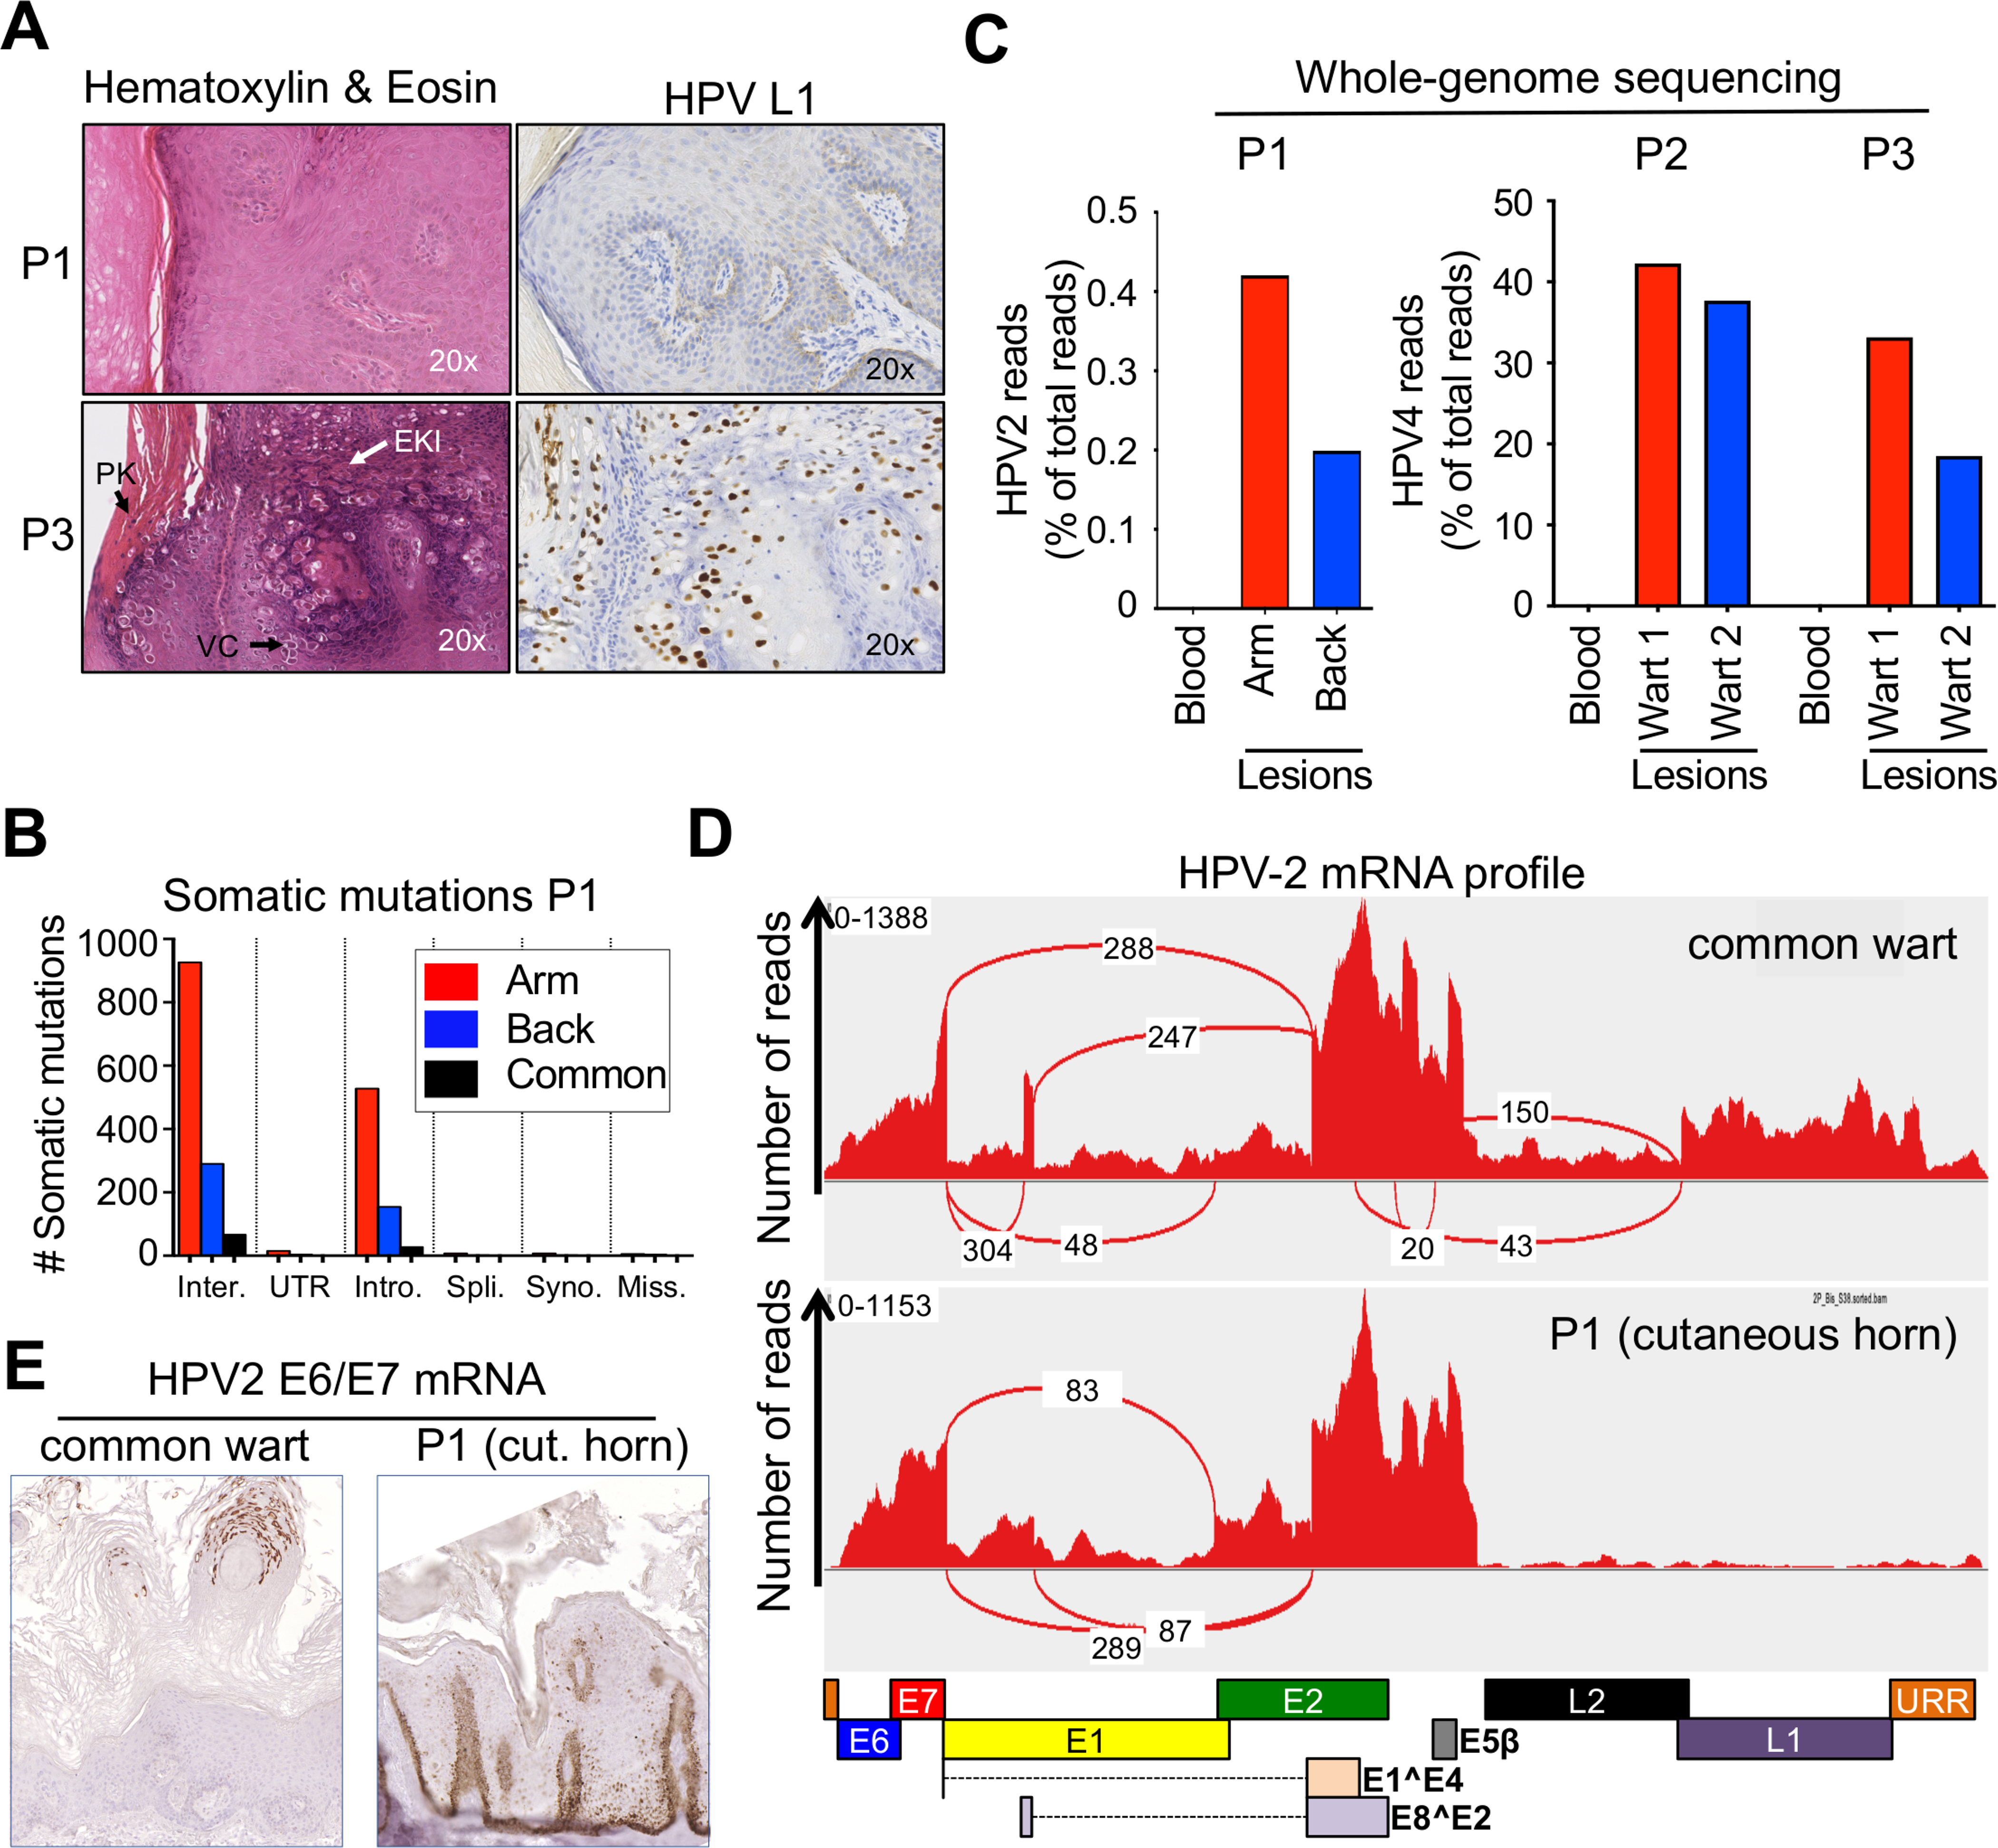
We study a patient with the human papilloma virus (HPV)-2-driven "tree-man" phenotype and two relatives with unusually severe HPV4-driven warts. The giant horns form an HPV-2-driven multifocal benign epithelial tumor overexpressing viral oncogenes in the epidermis basal layer. The patients are unexpectedly homozygous for a private CD28 variant. They have no detectable CD28 on their T cells, with the exception of a small contingent of revertant memory CD4+ T cells. T cell development is barely affected, and T cells respond to CD3 and CD2, but not CD28, costimulation. Although the patients do not display HPV-2- and HPV-4-reactive CD4+ T cells in vitro, they make antibodies specific for both viruses in vivo. CD28-deficient mice are susceptible to cutaneous infections with the mouse papillomavirus MmuPV1. The control of HPV-2 and HPV-4 in keratinocytes is dependent on the T cell CD28 co-activation pathway. Surprisingly, human CD28-dependent T cell responses are largely redundant for protective immunity.

Keywords: CD28; HPV; T cell; cutaneous horn; immunodeficiency; oncogene; papillomavirus; somatic reversion; tree man syndrome; wart.


Conflict of interest statement

Declaration of interests L.D.N. receives compensation as Chief Editor of Frontiers in Immunology. T.W. serves on advisory boards for MSD (Merck Sharp and Dohme). J.-L.C. serves on the scientific advisory boards of ADMA Biologics Inc., Kymera Therapeutics, and Elixiron Immunotherapeutics. All other authors declare no competing interests.

Figures

Figure 1.
Figure 1.. Autosomal recessive CD28 deficiency and “tree man” syndrome
(A) Pedigree showing familial segregation of the c.52G>A mutant CD28 allele. (B) Images of the TMS phenotype of P1 and X-ray of the right hand of P1 showing that the lesions have not extended to the bones. (C) Genome-wide linkage analysis on DNA from 16 members of the kindred, assuming AR mode of inheritance, with complete penetrance. The linkage region with the highest LOD score was on chromosome 2 and contained CD28 (red arrow). (D) Schematic representation of CD28 protein. SP, signal peptide; EC, extracellular domain; TM, transmembrane domain; IC, intracellular domain. Exons and exon boundaries are depicted below. The mutation is indicated with a red line. (E) Frequency and CADD score for all CD28 variants reported homozygous in the public databases. The dotted line corresponds to the MSC. NR, not reported. The private c.52G>A mutation appears in red. (F) Reverse transcription qPCR for total CD28 with two different probes representative of three independent experiments. Bars represent the mean and the SD. Mann-Whitney tests were used for comparisons. (G) Reverse transcription PCR from PHA blasts from one control and P1 was performed to amplify the sequence between the 5′ and 3′ UTRs of the CD28 cDNA for insertion into a vector. We sequenced 190 colonies for the control and 106 for P1. The splice variants involving the splice donor site of exon 1, and their respective frequencies are shown. The amino acid sequence encoded by each transcript is shown below the nucleotide sequence. (H and I) HEK293T cells were transfected with an empty vector (EV) or with vectors encoding the indicated CD28 transcripts. (H) Immunoblotting with a monoclonal antibody against the V5 tag and GAPDH. (I) Cell surface CD28 levels. (J) Jurkat cells were transduced with an EV or a plasmid encoding the indicated CD28 cDNA. Phospho-p65 (p-p65) was detected by flow cytometry after the crosslinking of CD28 or PMA stimulation. (H–J) Data representative of three independent experiments. See also Figures S1, S2, and S3 and Data S1.
Figure 2.
Figure 2.. Abolished CD28 response in the patients’ primary T cells
(A) Representative fluorescence-activated cell sorting (FACS) plots showing CD28 expression on PHA blasts from patients, heterozygotes, and controls. (B) Phospho-p65 (p-p65) detection in CD4+ (left) and CD8+ (right) PHA blasts from P1 (m/m), a heterozygote (wt/m) and a healthy control (wt/wt), after crosslinking of the indicated cell surface receptors. Representative of two independent experiments. (C) PHA blasts from one control (top) and P1 (bottom) were transduced with an empty vector (EV) or a vector encoding the wild-type CD28. Phospho-p65 (p-p65) detection by flow cytometry in CD4+mCherry+ (left) and CD8+mCherry+ (right) PHA blasts after crosslinking of the indicated cell surface receptors. (B and C) PMA stimulation was used as a positive control. (D) RNA-seq analysis of primary CD4+ T cells. Compared to CD3 stimulation alone, 368 and 91 genes were significantly up- or downregulated in control’s cell stimulated by CD3+CD2 (left) or CD3+CD28 (right), respectively. The residual responses of the CD28-deficient patient are shown as percentage in the red bar charts for each condition. (E) Frequency of indicated cytokine in CD4+ memory T cells from healthy controls and patients after stimulation with PMA and ionomycin, or P815 cells in the presence of anti-CD3 and/or anti-CD28 mAbs. Graphs show the mean ± SD. Wilcoxon tests were used for comparisons. (F and G) CFSE dilution of CD4+ (F) and CD8+ (G) T cells from a control, P1, P2, and P3 after 5 day stimulation with beads coated with the indicated combination of CD2, CD3, and CD28 mAbs. Numbers indicate frequencies of proliferating cells in each condition. Data representative of 2–3 independent experiments. See also Figure S4 and Table S1.
Figure 3.
Figure 3.. CD28 deficiency has a mild impact on lymphocyte subset development
(A–E) Frequency of indicated T cell subsets of controls (n = 23–57), heterozygotes (n = 4), and patients (n = 3). Kruskal-Wallis tests were used for all comparisons. The bars represent the median. (F) scRNA-seq UMAP clustering of PBMC from 3 CD28 homozygous patients together with a set of 3 controls. CTL, cytotoxic T cells; Teff, effector T cells; Tmem, memory T cells. (G) CD28 expression level superimposed on the scRNA-seq UMAP clustering. (H) Fraction of CD28+ cells in T cell subsets indicated and as defined by single-cell RNA-seq UMAP clustering. Graphs show the mean ± SD. See also Figures S4, S5, and S6, Table S2, and Data S1.
Figure 4.
Figure 4.. Evidence for somatic mosaicism in the patients’ memory CD4+ T cells
(A) CD28 expression on the indicated T cell subsets from P1 (m/m), a heterozygote (wt/m), and a healthy control (wt/wt). Isotype control (Iso) was used as a negative control. Representative data from the 3 patients and 4 heterozygotes. Numbers are frequencies of CD28+ cells in the indicated subset of each donor. (B) Sanger sequencing chromatograms of the c.52G>A mutation in gDNA from a control, P1’s mother, and CD28 and CD28+ CD4+ memory T cells from P1 (upper line). A rare mutation of USP37 (c.1375G>A) was used to demonstrate that the CD28+CD4+ memory T cells sorted from P1 were not of maternal origin (bottom line). (C) FACS plots of CD28 expression on recent thymic emigrants (CD31+CD4+ T cells). (D) FACS plots showing Tregs in CD4+ T cells of one control or CD28 or CD28+ (revertant) CD4+ T cells from P1. (E) Comparison of Th subset frequencies in CD28 and CD28+ (revertant) memory CD4+ T cells from P1. (F–H) CITE-seq analysis of CD4 memory T cells from a control, P1, and P2. (F) Sequence reads showing the presence or absence of the reversion in RNA from P1 and P2 cells. (G) UMAP clustering of patients’ CD4 memory T cells with a projection of CD28 revertant identified using strict selection criteria. Cells with no detectable CD28 RNA or protein were considered mutants (dark gray). (H) Volcano plot for a differential gene expression (DGE) analysis comparing CD28 revertant with CD28 cells, as shown in (G). See also Figure S7 and Data S1.
Figure 5.
Figure 5.. Anti-HPV B and T cell responses
(A) Virscan. Adjusted virus scores for indicated samples from patients, a heterozygote and controls, mock immunoprecipitate (IP) samples and-IgG depleted serum, and IVIg. Shown are virus species for which we found at least one sample to be seropositive. The heatmap shows adjusted virus score values for each sample as a color gradient from blue if antibodies were detected but below our significance cutoff values, through purple to red if the adjusted virus score values were above our significance cutoff values. The bar plot (bottom) illustrates the size of the Ab repertoire for a given sample, indicating the precise number of different species for which peptides were enriched (light blue) and the number of different species for which the adjusted virus score values exceeded the cutoff values for significance (dark blue). (B) Ab titers against HPV-2 and HPV-4 in patients at multiple time points; sensitivity threshold is indicated by a dashed line. (C) Titers of antibodies against indicated HPVs in P1 and P3 pre and post Gardasil 9 vaccination (blue lines). The sensitivity threshold is indicated by a red dotted line. The black line represents the median value for a published control group (Bhatla et al., 2018). The gray area and the gray lines indicate the minimum, interquartile range and maximum responses of the control group. (D and E) PBMCs were stimulated for 14 days with overlapping peptides from pp65 (HCMV), E6 (HPV-2), or L1 (HPV-4). Intracellular production of TNF and IFN-γ was measured in CD4+ (D) and CD8+ (E) T cells, respectively. Controls (n = 46), heterozygote, and patients were categorized on the basis of seropositivity for HCMV, HPV-2, and HPV-4 (top panels). Representative images are shown in the lower panels. See also Figure S7 and Data S1.
Figure 6.
Figure 6.. Histological and virological studies of TMS lesions reveal an atypical papilloma
(A) H&E staining (left), immunohistochemical staining of the L1 protein of HPV (right) in a skin lesion from P1 (top) and a common wart from P3 (bottom). Vacuolated cells (VC), parakeratosis (PK), and large eosinophilic keratohyalin inclusions (EKI), suggesting productive viral replication is not found in P1’s lesions. (B) Bar graph summarizing the number of somatic mutations in P1’s lesions, sorted by mutation type: intergenic (inter.), untranslated region (UTR), intronic (intro.), splicing region (spli.), synonymous (syno.), and missense (miss.). The numbers of somatic mutations common to the 2 skin lesions are shown for each type of mutation. (C) Bar graph showing HPV-2 (P1) and HPV-4 (P2 and P3) read counts normalized to total read counts extracted from WGS data for two separate lesions (arm and back) and the blood of the patients. (D) Representative RNA sequencing profiles for a control wart (top) and one TMS lesion from P1 (bottom). The graph shows the number of reads detected for each position. The red connecting lines indicate the most frequent splice events detected; the number of detected reads is indicated. Boxes below the graph indicate the position of the main HPV-2 open reading frames. (E) In situ hybridization showing E6/E7 mRNA levels in an HPV-2+ common wart and a cutaneous horn from P1. See also Table S3 and Data S1.

Comment in

References

    1. Abecasis GR, Cherny SS, Cookson WO, and Cardon LR (2002). Merlin–rapid analysis of dense genetic maps using sparse gene flow trees. Nat. Genet 30, 97–101. - PubMed
    1. Adzhubei IA, Schmidt S, Peshkin L, Ramensky VE, Gerasimova A, Bork P, Kondrashov AS, and Sunyaev SR (2010). A method and server for predicting damaging missense mutations. Nat. Methods 7, 248–249. - PMC - PubMed
    1. Alisjahbana B, Dinata R, Sutedja E, Suryahudaya I, Soedjana H, Hidajat NN, Soetikno RD, Oktaliansah E, Deng A, Rady P, et al. (2010). Disfiguring generalized verrucosis in an indonesian man with idiopathic CD4 lymphopenia. Arch. Dermatol 146, 69–73. - PubMed
    1. Anders S, Pyl PT, and Huber W (2015). HTSeq–a Python framework to work with high-throughput sequencing data. Bioinformatics 31, 166–169. - PMC - PubMed
    1. Antonsson A, Green AC, Mallitt KA, O’Rourke PK, Pandeya N, Pawlita M, Waterboer T, and Neale RE (2010). Prevalence and stability of antibodies to 37 human papillomavirus types–a population-based longitudinal study. Virology 407, 26–32. - PubMed

Publication types

MeSH terms