. 2021 Aug 11;29(8):1235-1248.e8.
doi: 10.1016/j.chom.2021.05.011. Epub 2021 Jul 1.

Commensal microbiota regulates skin barrier function and repair via signaling through the aryl hydrocarbon receptor

Affiliations

Commensal microbiota regulates skin barrier function and repair via signaling through the aryl hydrocarbon receptor

Aayushi Uberoi et al. Cell Host Microbe. .

Abstract

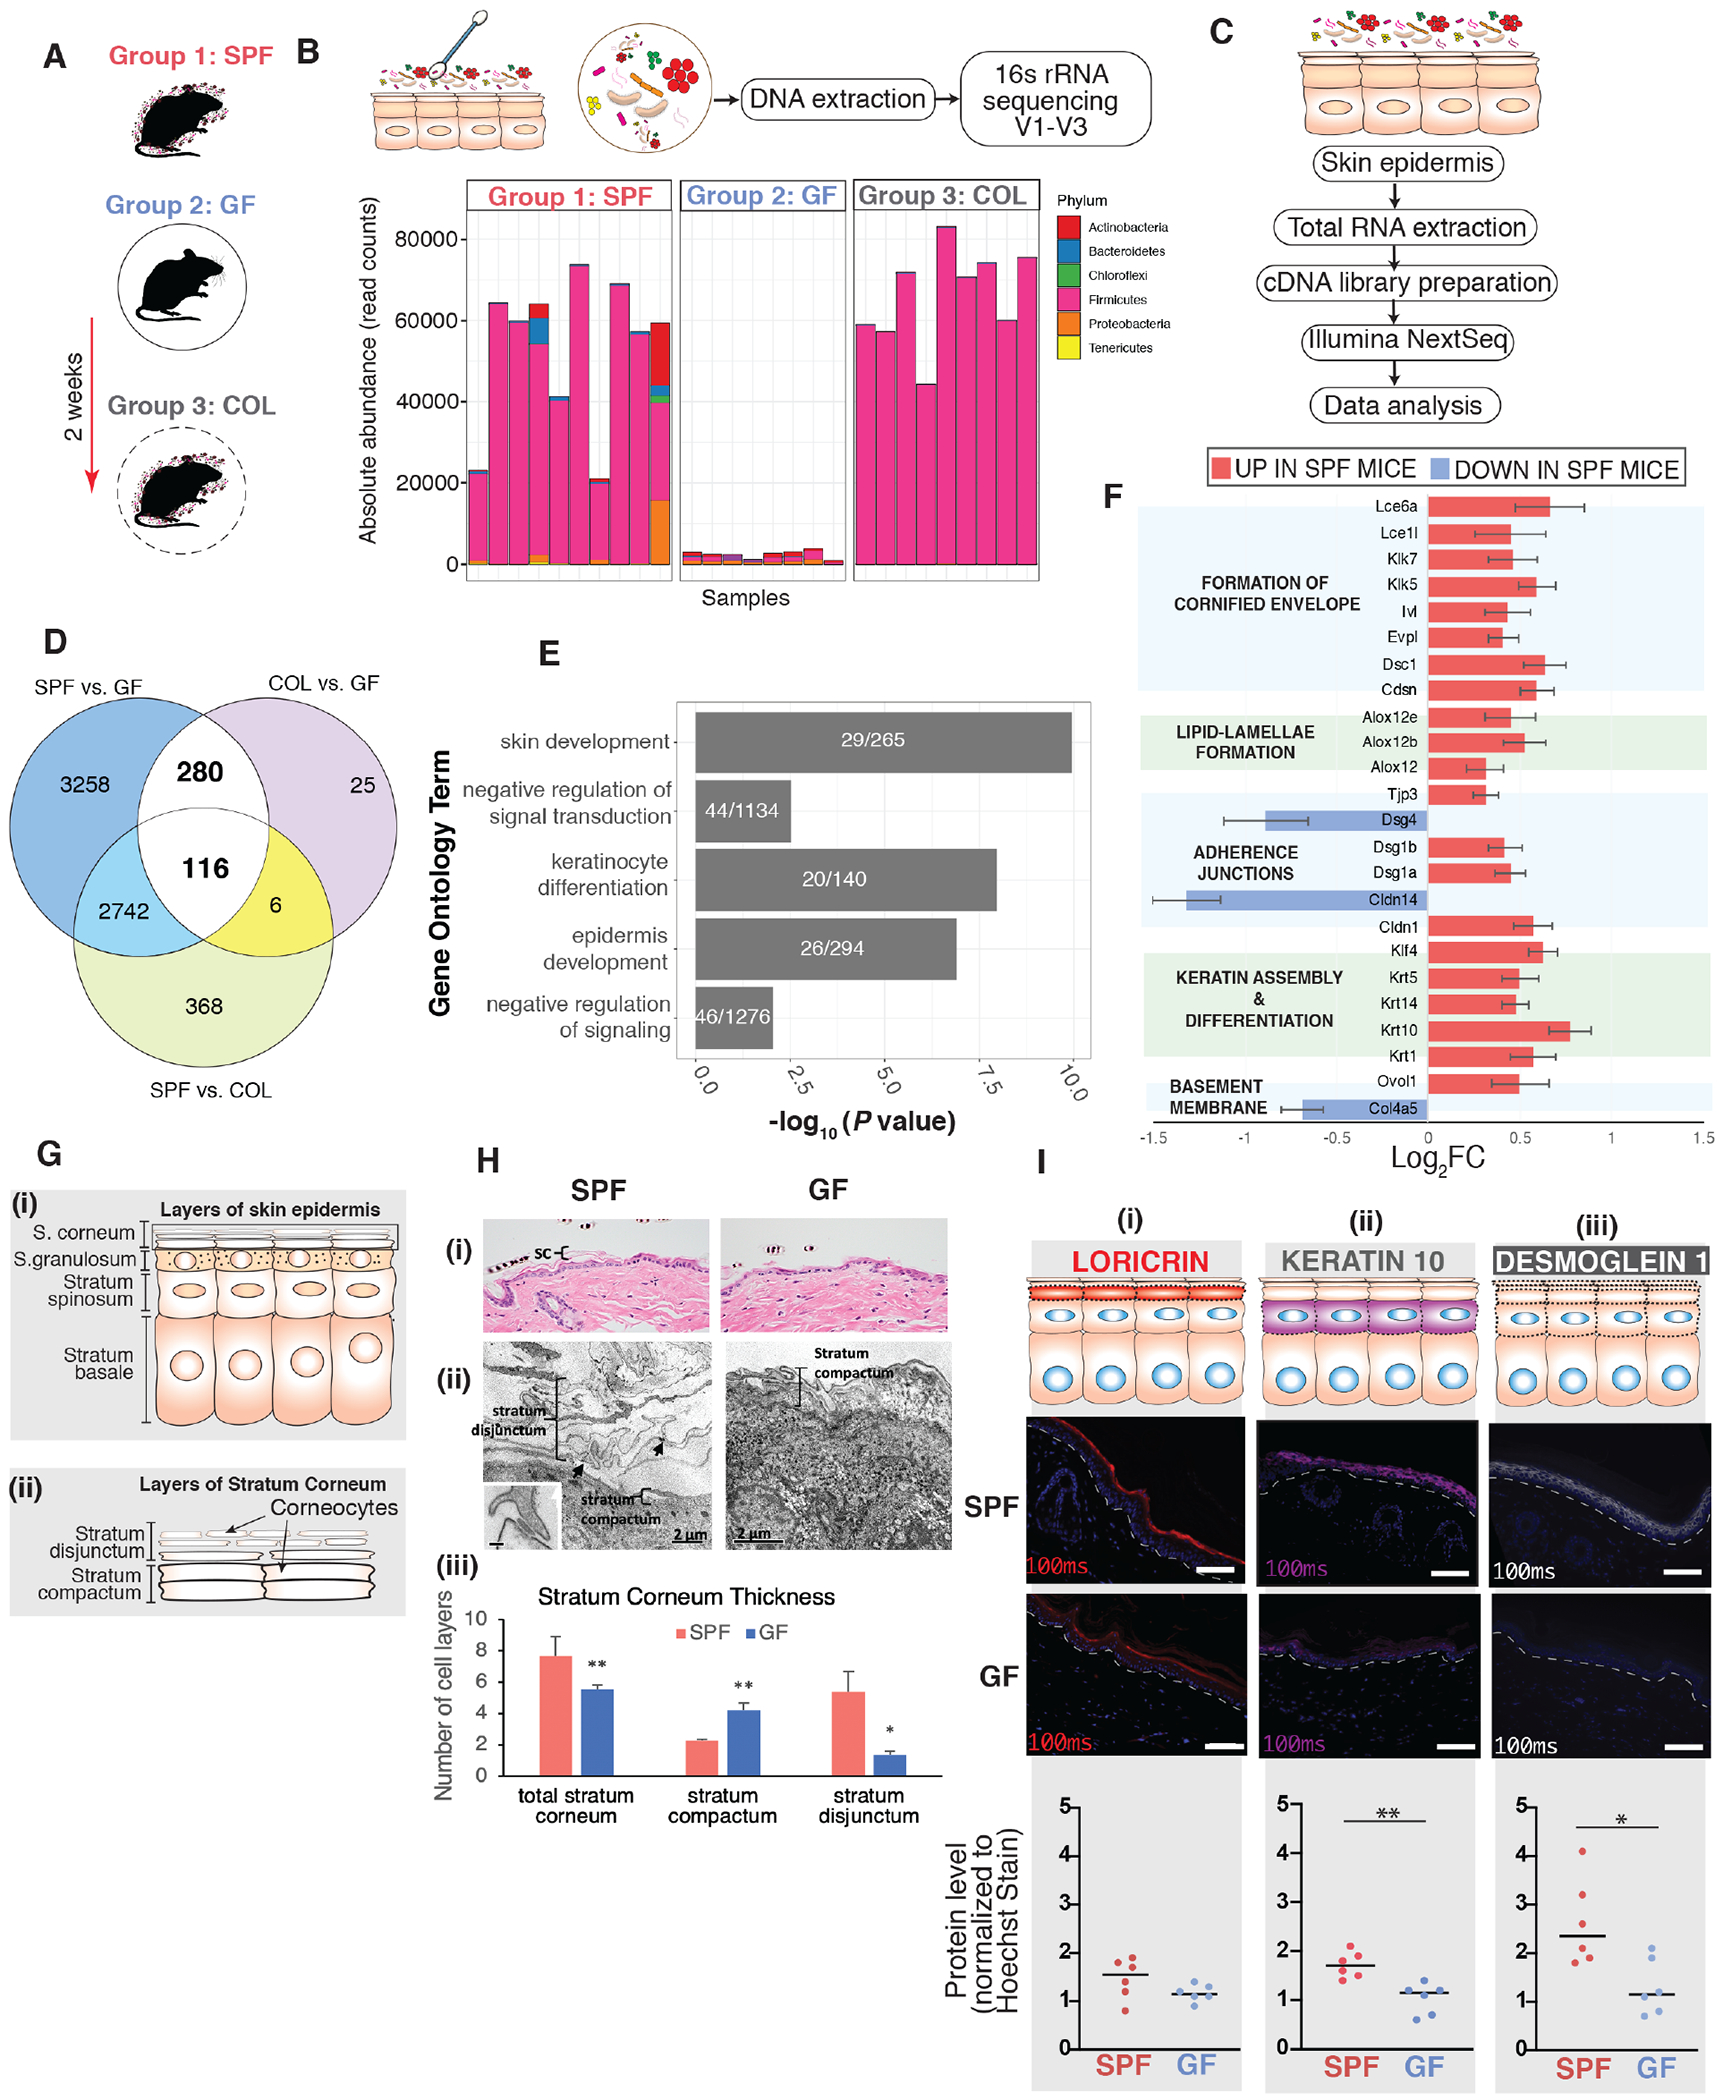
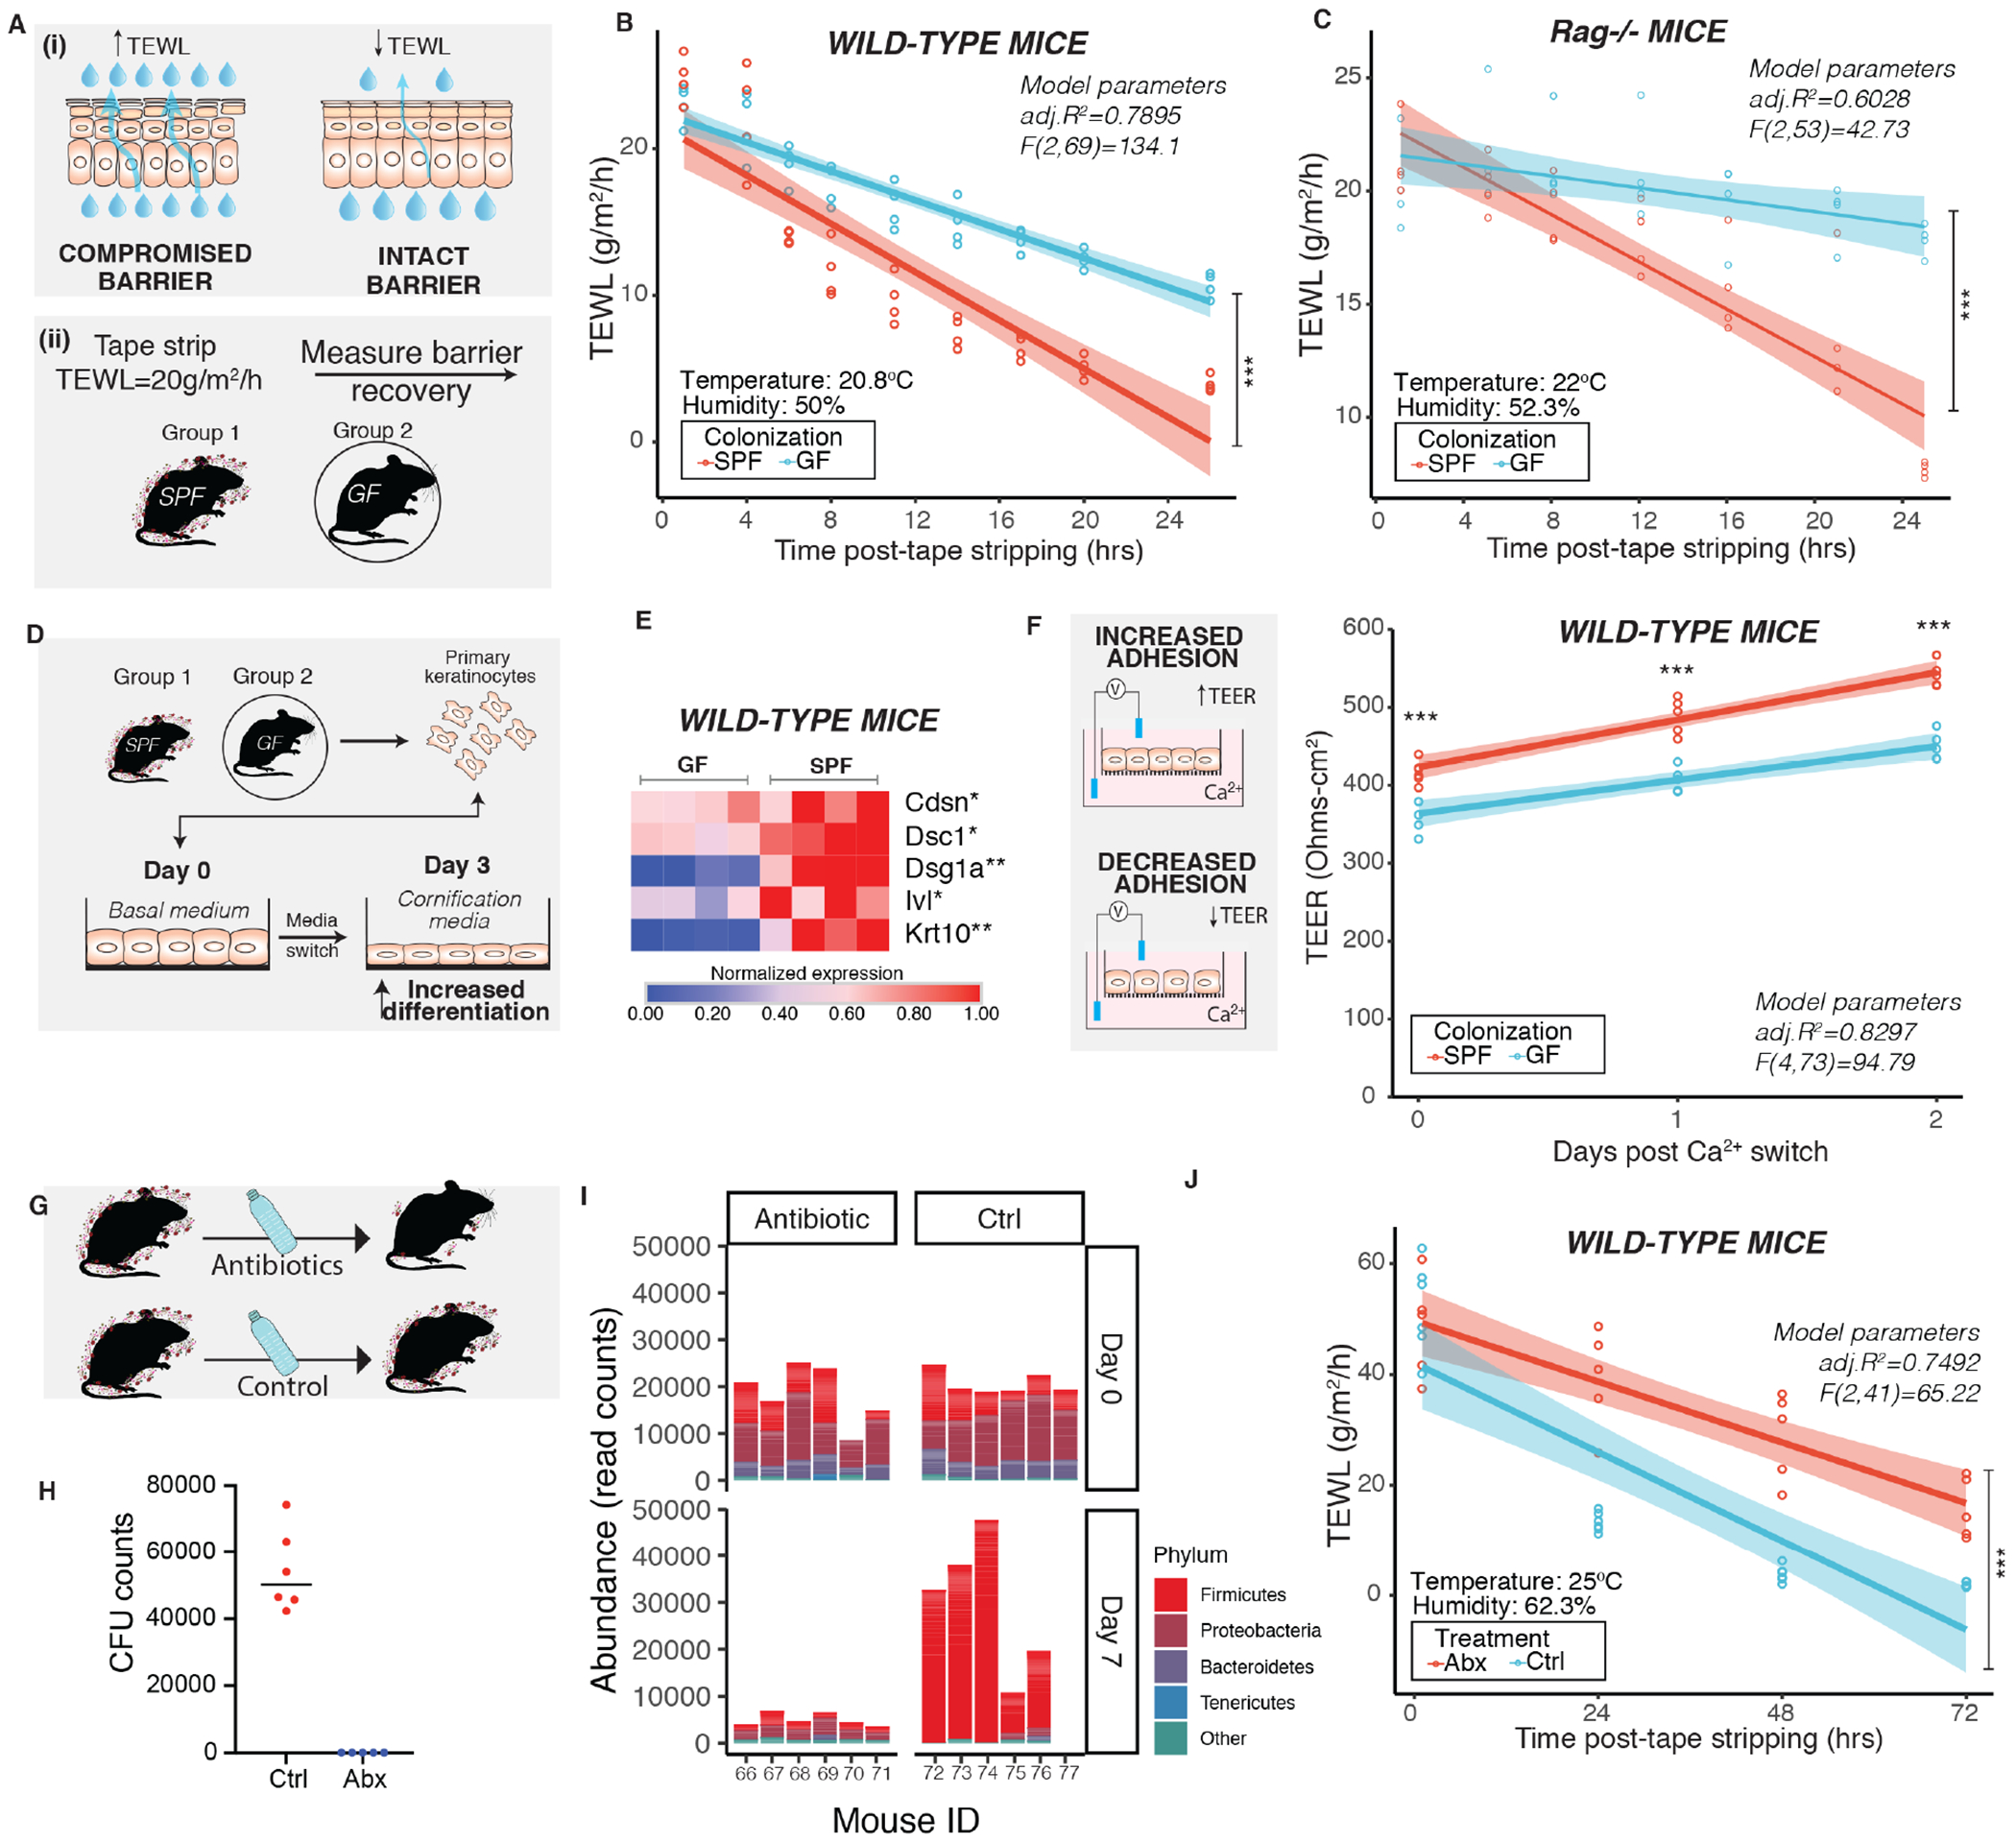
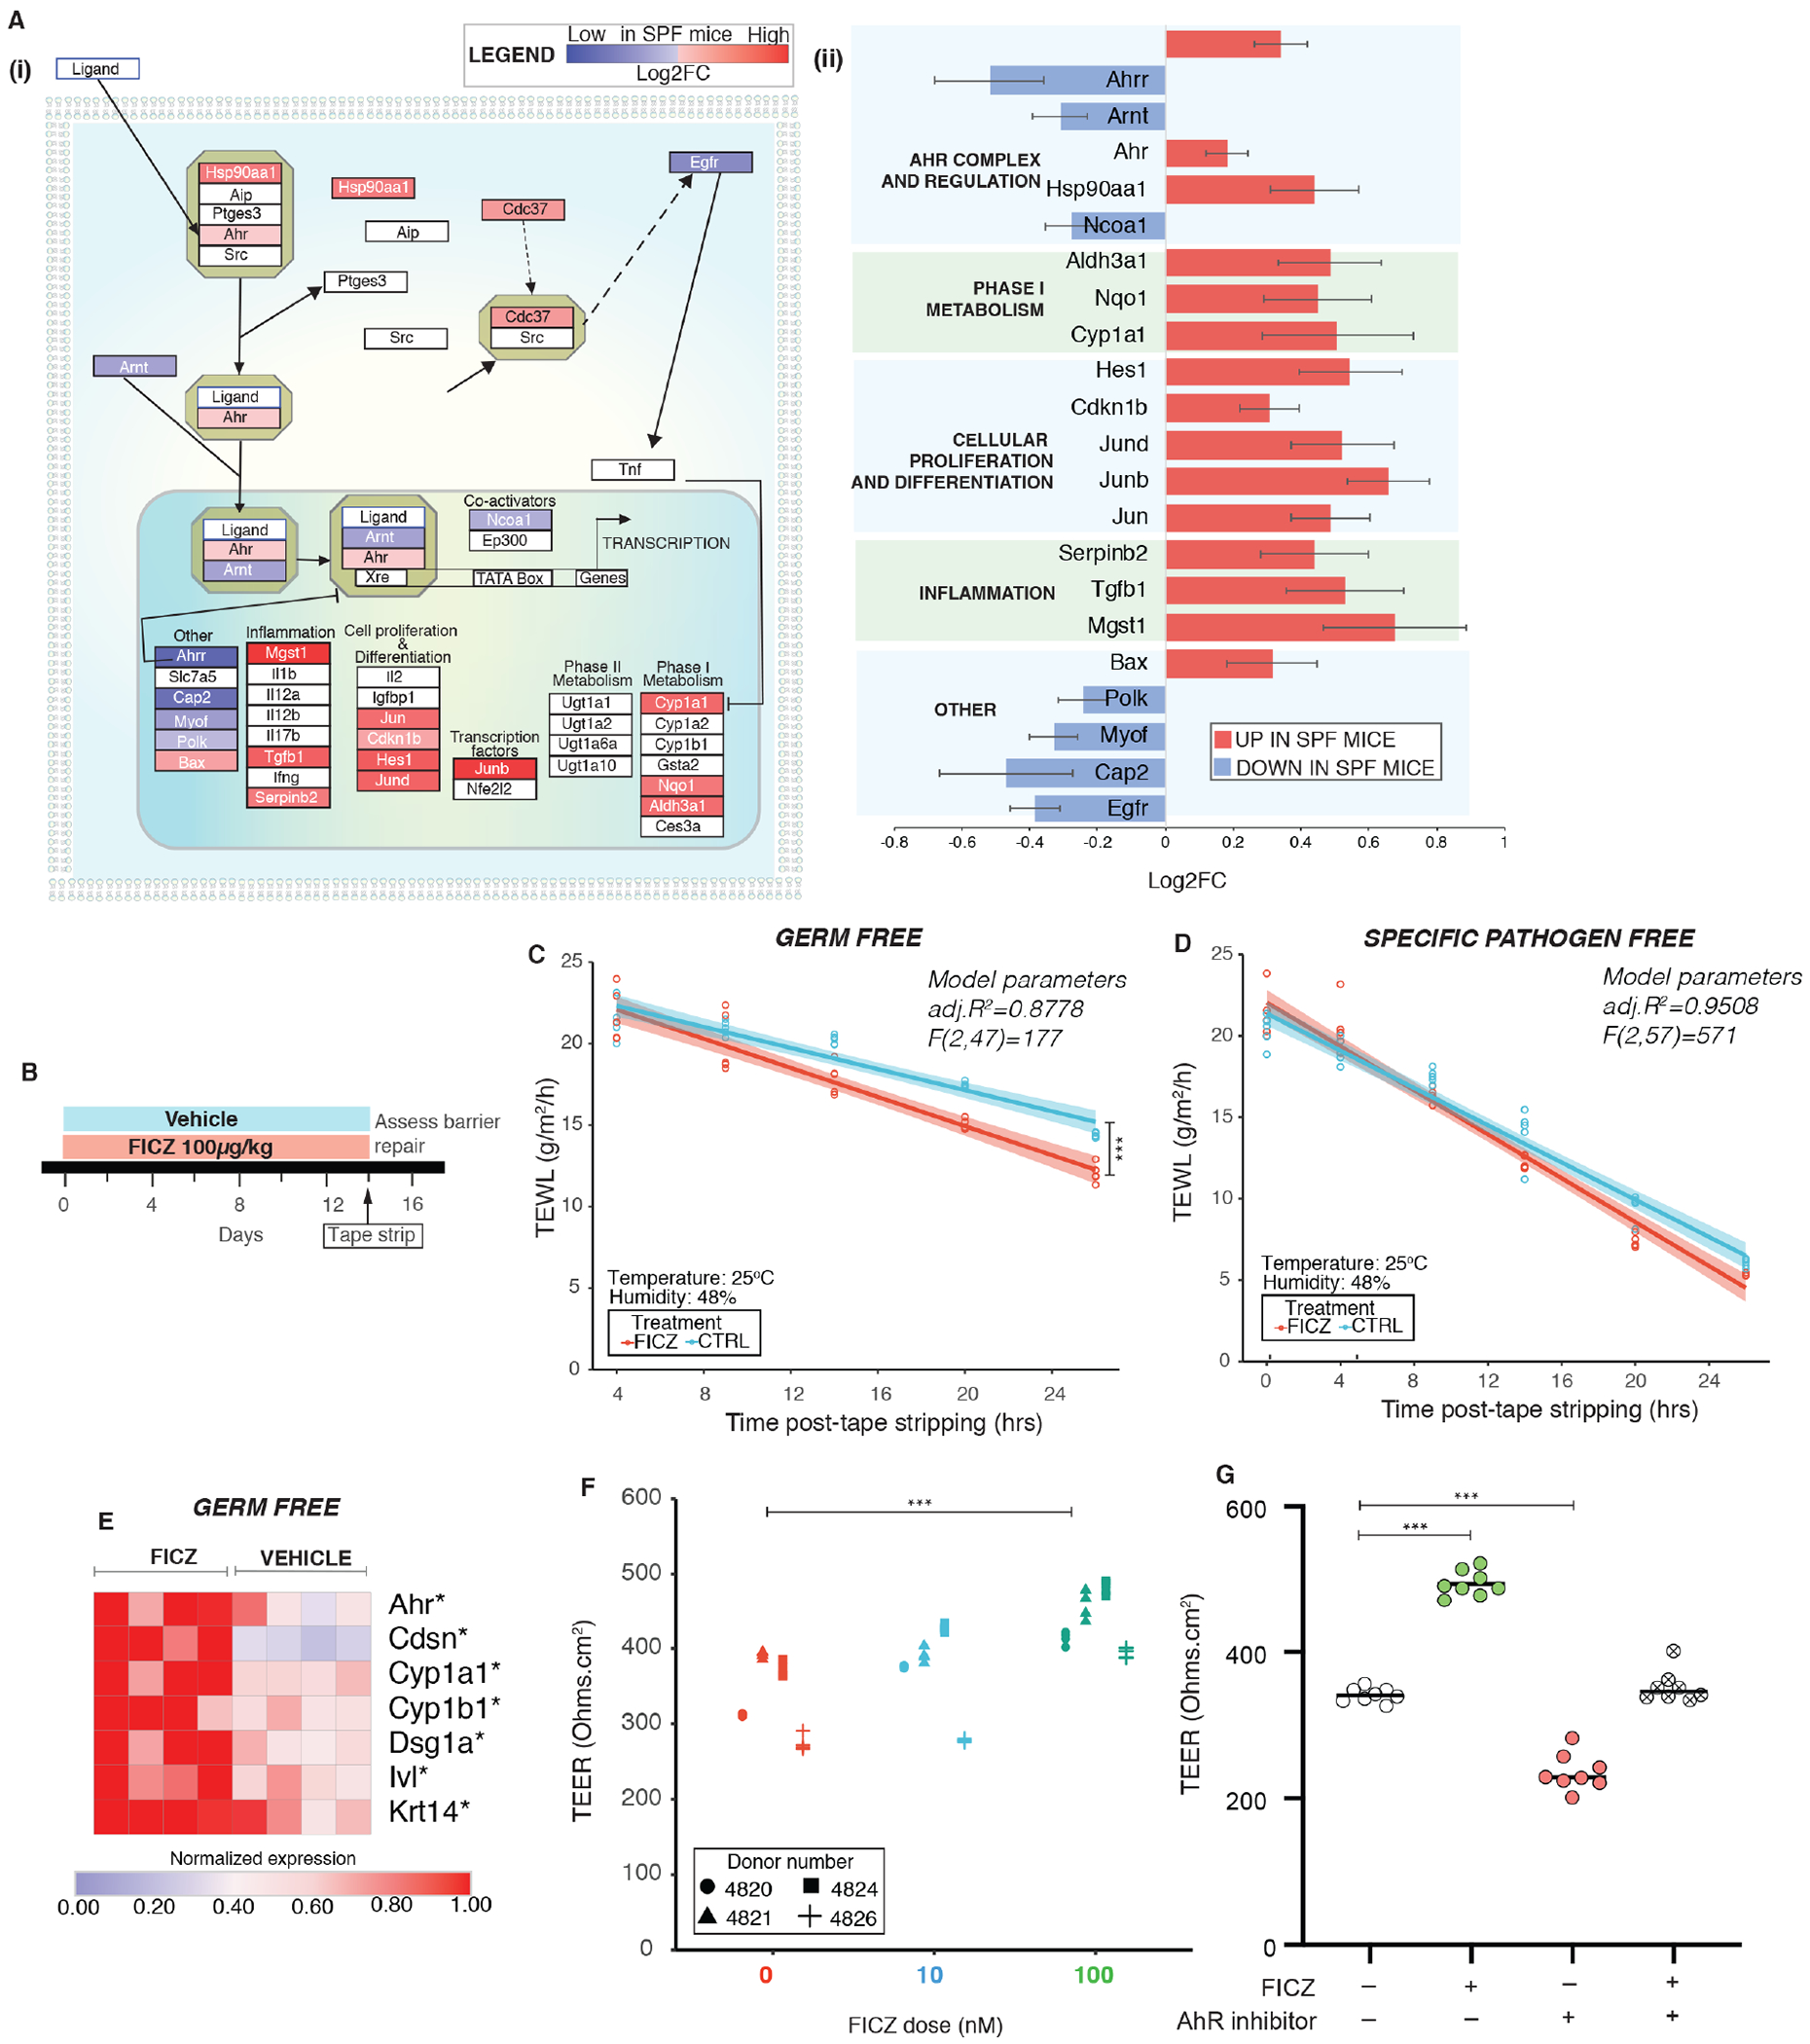
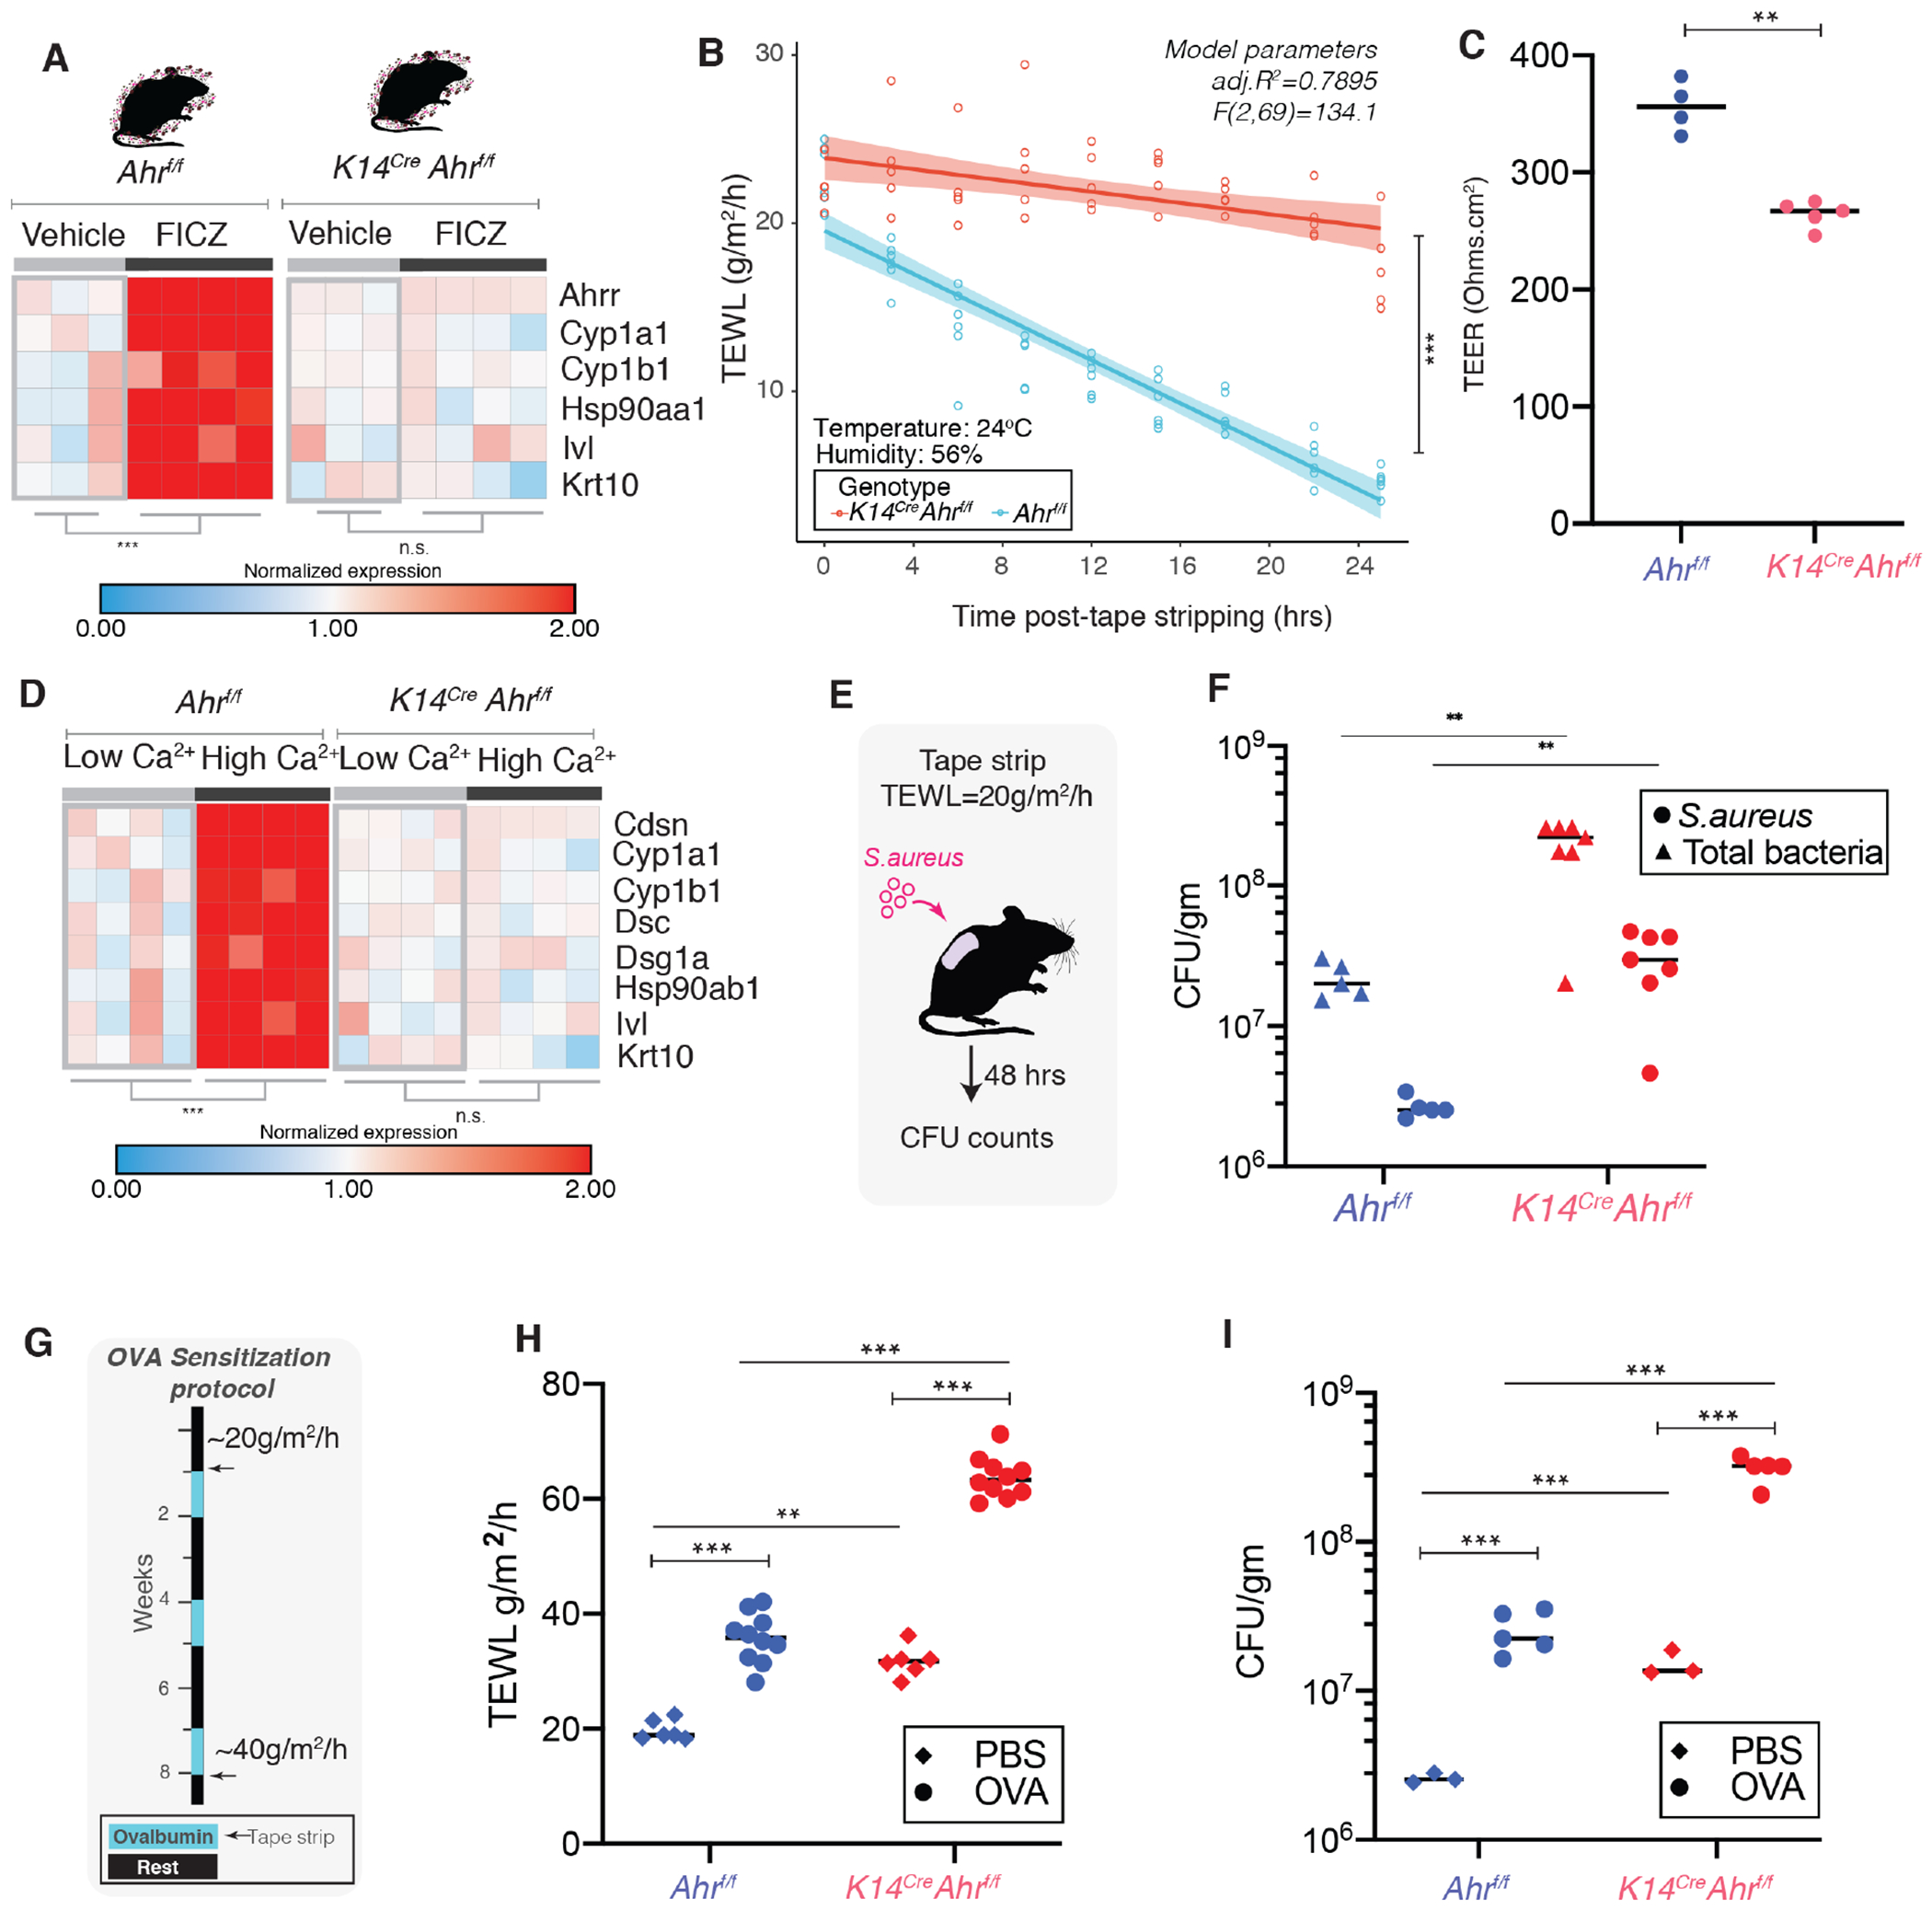
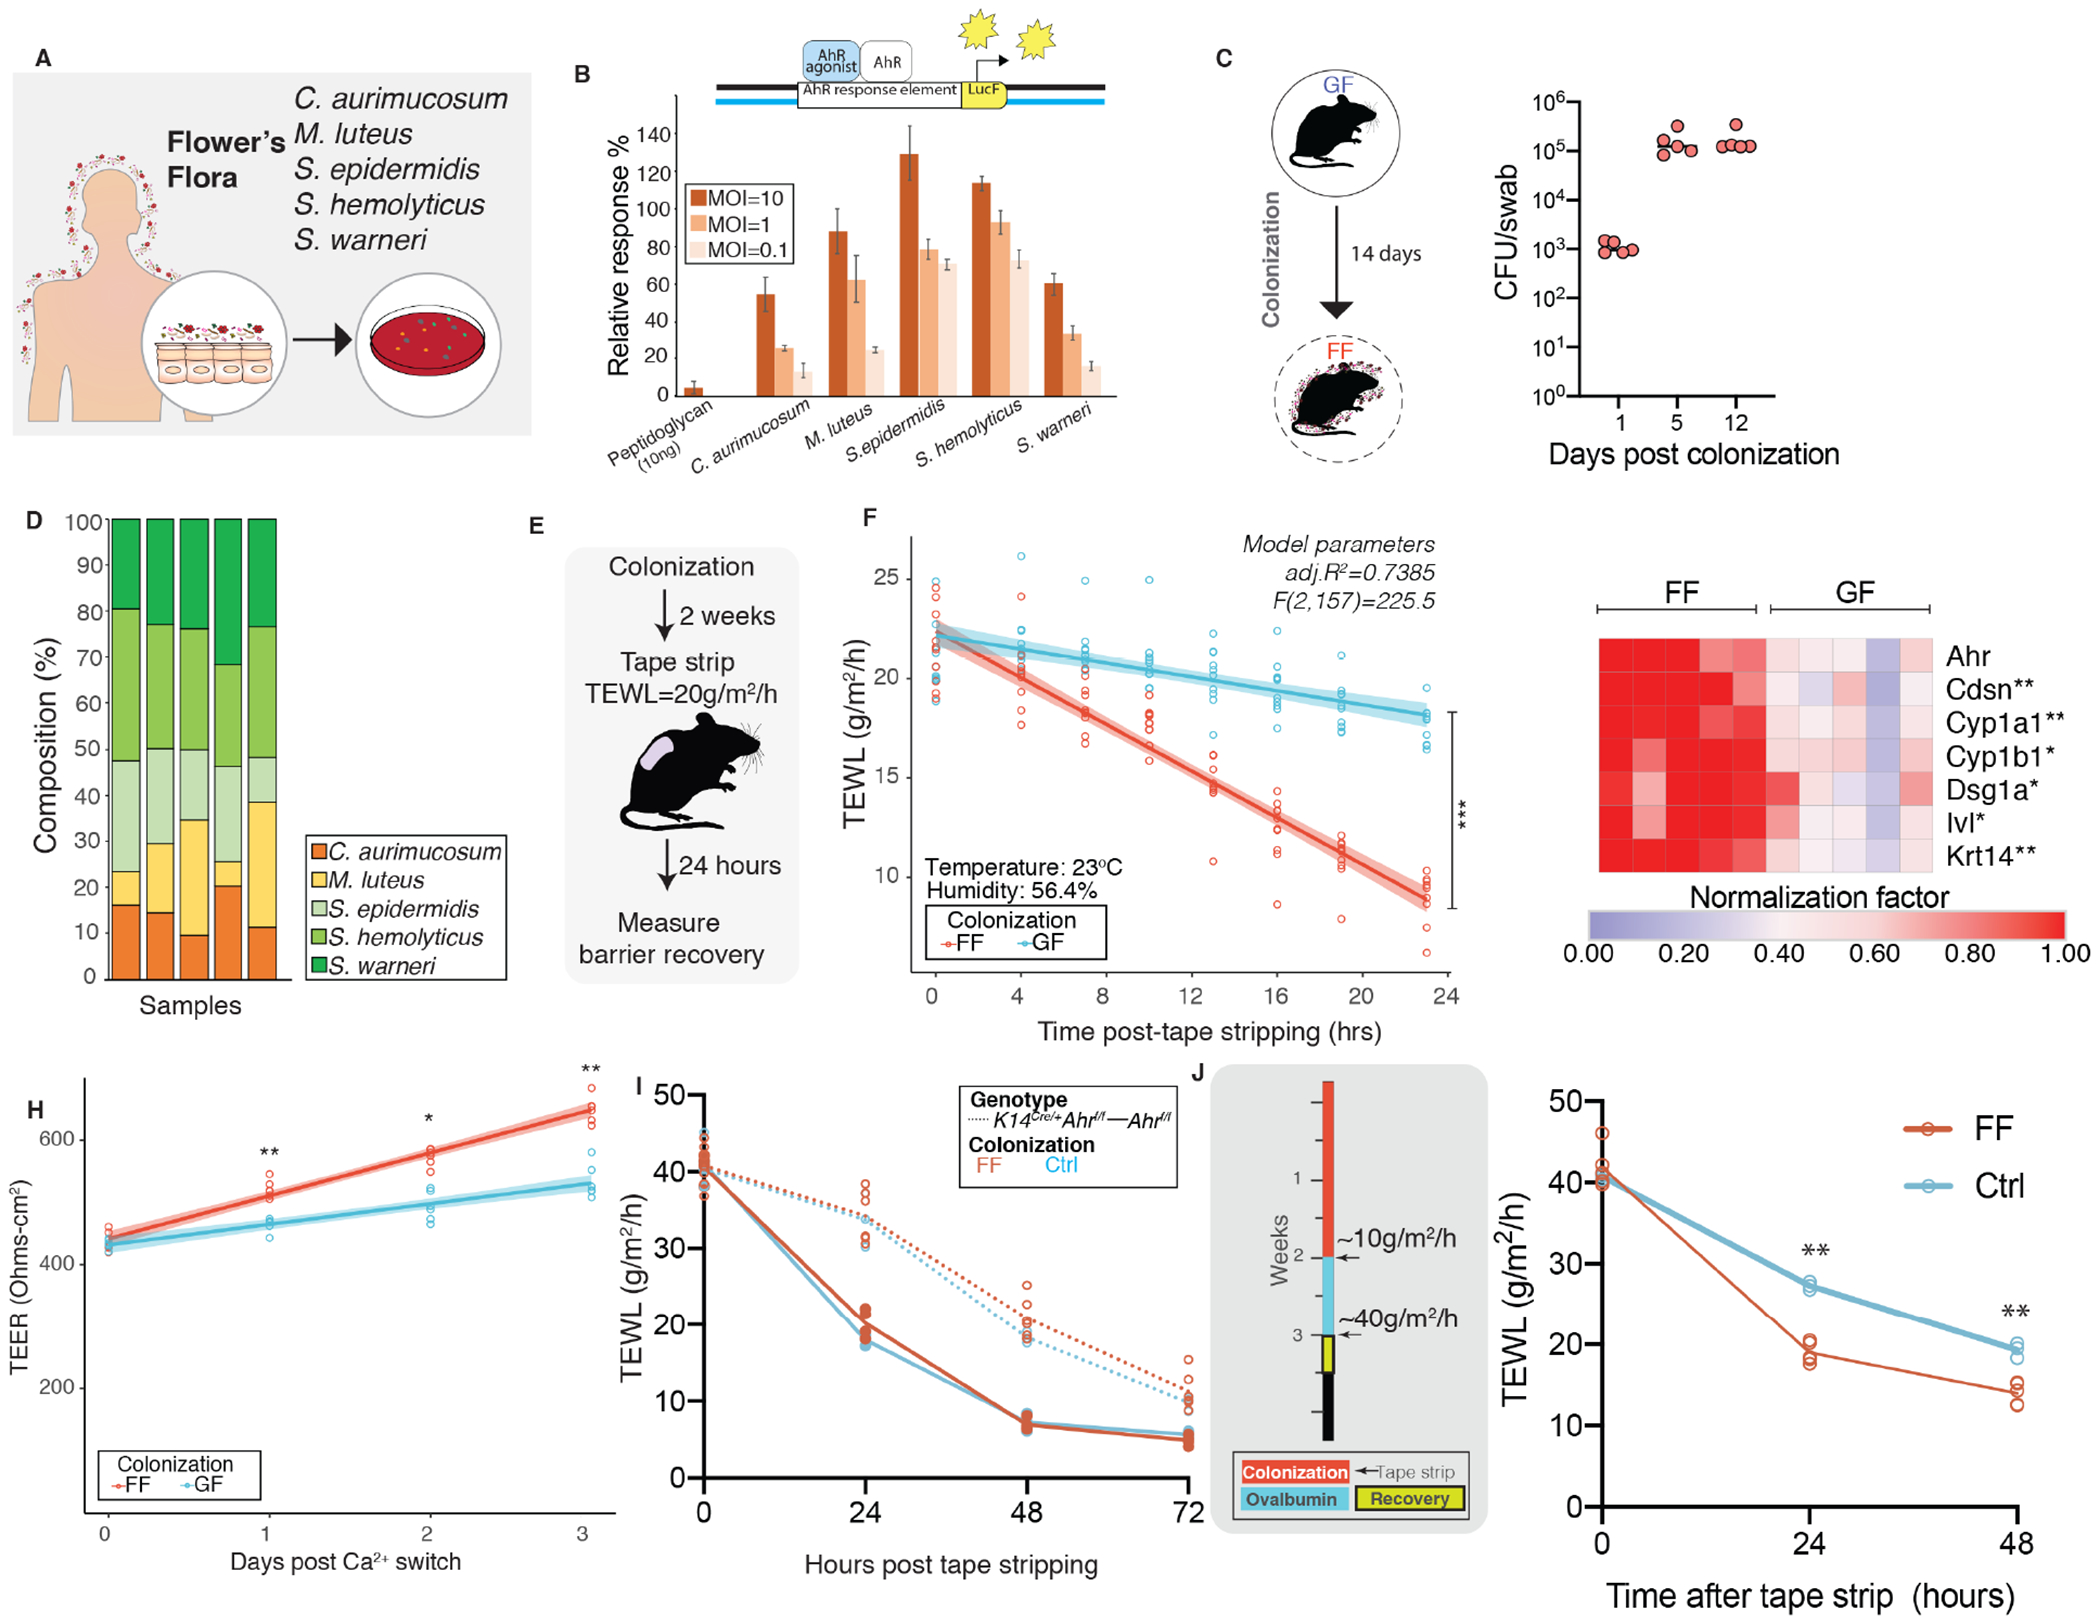
The epidermis forms a barrier that defends the body from desiccation and entry of harmful substances, while also sensing and integrating environmental signals. The tightly orchestrated cellular changes needed for the formation and maintenance of this epidermal barrier occur in the context of the skin microbiome. Using germ-free mice, we demonstrate the microbiota is necessary for proper differentiation and repair of the epidermal barrier. These effects are mediated by microbiota signaling through the aryl hydrocarbon receptor (AHR) in keratinocytes, a xenobiotic receptor also implicated in epidermal differentiation. Mice lacking keratinocyte AHR are more susceptible to barrier damage and infection, during steady-state and epicutaneous sensitization. Colonization with a defined consortium of human skin isolates restored barrier competence in an AHR-dependent manner. We reveal a fundamental mechanism whereby the microbiota regulates skin barrier formation and repair, which has far-reaching implications for the numerous skin disorders characterized by epidermal barrier dysfunction.

Keywords: aryl hydrocarbon receptor; epidermis; keratinocyte; microbiota; skin barrier; skin commensals; skin microbiome.


Conflict of interest statement

Declaration of interests The authors have no competing interests to declare.

Figures

Figure 1.
Figure 1.. Commensal microbiota regulates epithelial barrier genes.
(A) Three groups of mice were employed, specific pathogen free (SPF), germ free (GF), and germ-free mice colonized (COL) with SPF microbiota for 2 weeks [n=8 mice (4 female,4 male)/group]. (B) Skin microbiota composition determined by 16S rRNA gene sequencing. Y-axis indicates absolute read counts of most abundant phylum (by relative abundance in the dataset) for each mouse (x-axis). (C) RNA-seq workflow. (D) Overlap of differentially expressed genes when comparing groups of gnotobiotic mice. (E) Shown in white are the number of genes that were further analyzed for uniquely enriched gene ontology biological process terms for aforementioned DEGs. Shown on the y-axis are the uniquely enriched terms, with p-values indicated on the x-axis. P-values are based on Fisher’s exact test and FDR-adjusted under dependency using the “BY” method. (F) Genes involved in different facets of epithelial barrier. Shown are genes that were differentially expressed in the SPF vs GF subset (p<0.001). Horizontal bars represent the Log2 fold-change comparison (genes upregulated in SPF: log2FC> 0, downregulated in SPF: log2FC < 0). Error bars represent standard error estimate for the log2 fold-change. (G) Schematic depicting layers of (i) skin epidermis and (ii) stratum corneum to aid understanding of histopathological and ultrastructural analyses in panel H. (H) Structural analysis of dorsal skin from age-matched GF and SPF mice. Light microscopy of (i) Hematoxylin and Eosin and (ii) Electron microscopy (EM) of reduced osmium tetroxide-stained tissue. Black arrows indicate connections between peripheral ends of corneocytes. Inset (scale bar=100nm) shows a corneodesmosome attaching the ends of two corneocytes. In Panels (i-ii): SC = stratum corneum; C = corneocyte; CD = corneodesmosome (iii) Quantification of the number of cell layers in the stratum corneum depicted in panel (ii) (* p<0.05; ** p< 0.01; T-test). (I) Tail-skin from SPF and GF mice. Immunofluorescence-based detection of differentiation markers (i) loricrin (red) and (ii) keratin-10 (purple) and adhesion marker (iii) desmoglein-l(grey). Nuclei are counter-stained with Hoechst stain (blue). White dashed-line indicates boundary separating epithelial-stromal compartments. Scale bar (10μm) is indicated in white (bottom-right). Images were taken (n=6 mice) at constant light exposure and integrated density of signal was normalized to Hoechst signal. Each dot corresponds to average normalized signal across 10-12 random images for each mouse. Asterisk indicates statistical significance (p<0.05, T test, two-sided). See also Table S1, S2, S3, and Figure S1.
Figure 2.
Figure 2.. Commensal microbiota promotes skin barrier repair function.
(A) Schematic depicts (i) principle of measuring transepidermal water loss (TEWL) to assess barrier repair function in adult mice (6-8 weeks old) and (ii) experimental design for assessing barrier recovery. Effect of colonization of microbes was assessed by comparing age-matched germ-free (GF) and specific pathogen-free (SPF) mice (n=4 male mice per group) in (B) wild-type C57/BL6 mice [ANCOVA, F (1,69) =50.649, ***P<0.001)] and (C) Rag1−/− mice [ANCOVA, F (1,53) =188.1, ***P<0.001)]. (D) Primary mouse keratinocytes derived from wild-type GF (n=4) and SPF (n=4) C57/BL6 mice were terminally differentiated. (E) Expression of genes involved in differentiation and adherence were assessed by qRT-PCR. Each square represents average readings from keratinocytes (n= 4 technical replicates) derived from an individual mouse (n=4 mice per group). *P<0.01, ** P<0.001 by T-test adjusted by Bonferroni correction. (F) Primary keratinocytes were grown on transwells. Epithelial adhesion was assessed by measuring transepithelial electrical resistance (TEER) at indicated time points. Data from one experiment is represented for visualization (See Figure S2). One dot represents average TEER readings from technical replicates (n=3) derived from one individual mouse (n=4 mice per group). ***P<0.001 by two-way ANOVA adjusted for multiple experiments. (G) To decrease skin microbial burden, wild-type SPF mice were treated with antibiotic cocktail (n=5 male mice/group) or vehicle (n=6 male mice/group) for two weeks. (H) Mice were swabbed 14 days after treatment and colony forming units (CFU) were determined. (I) Genomic DNA was extracted from swabs collected at baseline (Day 0) and after one week of treatment (Day 7). The V1-V3 region of the 16S rRNA gene was sequenced and analyzed. Shown is abundance of read counts classified to different phyla in each sample. Phyla with total read count <1000 are grouped into ‘Other’. (See Figure S3) (J) At the end of two weeks mice were tape stripped and TEWL was measured and plotted against time [ANCOVA, F (1,41) =26.315, ***P<0.001)]. TEWL vs time readings were fitted by linear modeling (in B, C, F and J) and significance was assessed by ANCOVA. Modeling parameters (adjusted R2 and F-statistics) are indicated on top-right for each plot. Span (shaded area) represents 95% Cl. Temperature and humidity conditions during TEWL measurement are indicated for each experiment. Also see Figures S2 and S3.
Figure 3.
Figure 3.. Activation of AHR signaling in skin rescues barrier dysfunction in germ free mice.
(A) Differentially expressed genes (DEGs) in SPF vs GF mice from RNAseq were (i) mapped onto the AHR pathway and (ii) Log2FC of significant DEGs (P<0.01) in SPF mice are represented. (B) Schematic illustrating experimental design. TEWL vs time readings were fitted by linear modeling and covariance was assessed by ANCOVA. Barrier recovery was compared in (C) GF mice [F (1,47) =21.9, ***P<0.001)] and (D) SPF mice [F(1,57)=2.98, *P=0.0492] that were either treated with FICZ or vehicle. (E) Expression of genes was assessed by qRT-PCR in GF skin treated with FICZ or vehicle (4 mice per group). *P<0.05, by T-test adjusted by Bonferroni correction. (F) Primary human keratinocytes grown on transwells in presence of FICZ (0nM, 10nM and 100nM) for three days and TEER was measured. Cells from different donors are represented by different symbol. See Figure S4. (G) Primary human keratinocytes were treated as indicated with FICZ and/or AHR inhibitor at 100nM doses. TEER values at the end of three days of treatment are reported. ***P<0.001 by T-test for panels F and G.
Figure 4.
Figure 4.. Loss of AHR in keratinocytes impairs skin barrier in mice.
(A) Murine skin was treated with FICZ (1mg/Kg) and expression of genes involved in Ahr regulation and epithelial differentiation were assessed by qRT-PCR. **P<0.01, by T-test adjusted by Bonferroni correction. Each square represents average readings n= 3 technical replicates derived from an individual mouse (B) TEWL recovery curves were compared between Ahrf/f (n=5) and K14Cre Ahrf/f (n=6) mice [ANCOVA, F (1,96) =131.34, ***P<0.001)]. Primary mouse keratinocytes were derived from mice and polarized and (C) TEER was measured (**P<0.005, T-test). (D) Expression of genes involved in differentiation, adherence, and AHR downstream activation targets were assessed by qRT-PCR. Each square represents average readings from keratinocytes (n= 3 technical replicates) derived from an individual mouse (n=4 mice per group). ** P<0.01 by T-test adjusted by Bonferroni correction. (E) Ahrf/f (n=5) and K14Cre Ahrf/f (n=7) mice were tape-stripped (TEWL=20 g/m2/h) and 107 CFU S. aureus-tdTomato was applied to back skin. (F) 48 hours post-infection tissue was collected, weighed, homogenized and plated. S. aureus (visible as red colored colonies) and total bacterial colonies were counted (**P<0.005, T-test). (G) Ovalbumin epicutaneous sensitization model. At the end of final OVA treatment, mice were tape-stripped and 24 hours later (H) TEWL levels were assessed. (I) S. aureus was applied to back skin and CFUs were determined. Statistical significance in panels F, H and I were assessed using a 2-way ANOVA (**P<0.005, ***P<0.0005). (See Figure S4)
Figure 5.
Figure 5.. Commensal microbes curated from human skin restore skin barrier function via AHR activation.
(A) Curation of bacteria for Flowers’ Flora (FF) consortium. (B) Reporter assay to assess AHR-activation in HaCaT cells using Cyp1a-luciferase reporter. Transfected cells were treated with indicated bacteria at indicated multiplicity of infection (MOI) and luminescence was measured. Relative response compared to 10nM FICZ treatment (positive control) was computed as follows: [(experimental sample ratio)-(negative control ratio)]/ [(positive control ratio)-(negative control ratio)]. (C) Germ-free mice were colonized with FF daily for two weeks. Mice were swabbed at indicated days and CFUs were enumerated. (D) To determine whether individual bacteria of FF colonized skin, qPCR analysis was conducted on genomic DNA extracted from skin swabs collected at day 14 using species-specific primers and percentage composition relative to total 16S rRNA was determined. (E) Two-weeks post colonization mice (n=5 mice/group) that were either germ-free (GF) or colonized with FF were tape stripped and (F) barrier recovery was assessed by TEWL (ANCOVA, F(1,157)=181.25, P<0.0001). (G) Expression of indicated genes was assessed by qRT-PCR in skin treated with FF or vehicle (GF). *P<0.05 and **P<0.005 by T-test, Bonferroni correction. (H) Primary mouse keratinocytes were derived, terminally differentiated and TEER was measured (**P<0.005, T-test). (I) To test if improved barrier recovery via FF is mediated through AHR, K14CreAhrf/f(n=6) were pre-colonized as shown in Fig. 4F and compared to K14CreAhrf/f (n=3) that were treated with Control (Ctrl) [ANCOVA, F(1,61)=0.1191, P=0.73115]. Additionally, Ahrf/f mice that were colonized (n=4) and untreated (n=3) were included in comparisons. (J) Experimental design to test if pre-colonization with FF could improve barrier recovery in OVA epicutaneous sensitization model. Barrier recovery kinetics were significantly improved in FF colonized versus control (non-colonized) mice [ANOVA, **P<0.01]. (See Figures S5).

Comment in

References

    1. Alexander H, Paller AS, Traidl-Hoffmann C, Beck LA, De Benedetto A, Dhar S, Girolomoni G, Irvine AD, Spuls P, Su J, et al. (2020). The role of bacterial skin infections in atopic dermatitis: expert statement and review from the International Eczema Council Skin Infection Group. Br J Dermatol 182, 1331–1342. - PMC - PubMed
    1. Alexa A RJ, (2020). topGO: Enrichment Analysis for Gene Ontology. In R package version 2420.
    1. Andreola F, Fernandez-Salguero PM, Chiantore MV, Petkovich MP, Gonzalez FJ, and De Luca LM (1997). Aryl hydrocarbon receptor knockout mice (AHR−/−) exhibit liver retinoid accumulation and reduced retinoic acid metabolism. Cancer Res 57, 2835–2838. - PubMed
    1. Beco L, Guaguere E, Lorente Mendez C, Noli C, Nuttall T, and Vroom M (2013). Suggested guidelines for using systemic antimicrobials in bacterial skin infections: part 2-- antimicrobial choice, treatment regimens and compliance. Vet Rec 172, 156–160. - PMC - PubMed
    1. Belkaid Y, and Segre JA (2014). Dialogue between skin microbiota and immunity. Science 346, 954–959. - PubMed

Substances

LinkOut - more resources