. 2021 Oct;191(10):1805-1821.
doi: 10.1016/j.ajpath.2021.06.006. Epub 2021 Jun 29.

Photoreceptor Cell Calcium Dysregulation and Calpain Activation Promote Pathogenic Photoreceptor Oxidative Stress and Inflammation in Prodromal Diabetic Retinopathy

Affiliations

Photoreceptor Cell Calcium Dysregulation and Calpain Activation Promote Pathogenic Photoreceptor Oxidative Stress and Inflammation in Prodromal Diabetic Retinopathy

Aicha Saadane et al. Am J Pathol. 2021 Oct.

Abstract

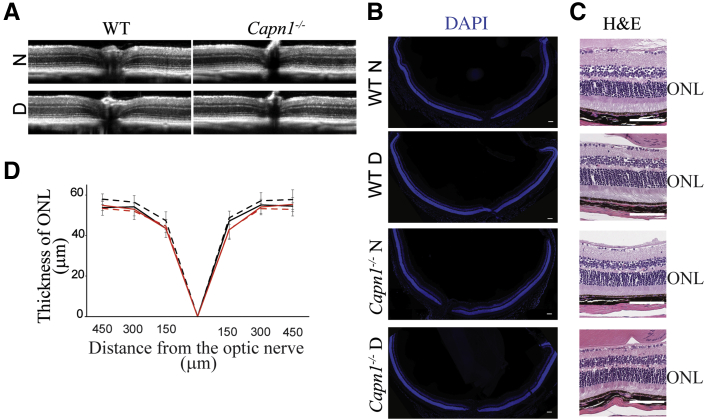
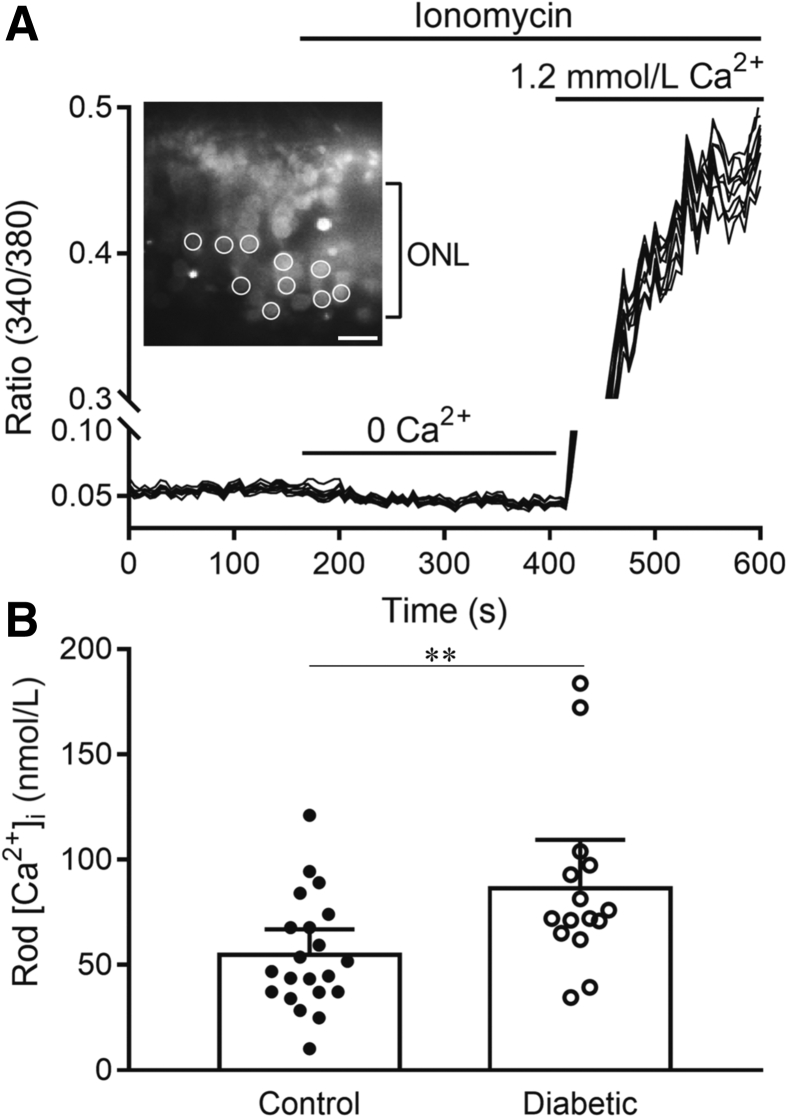
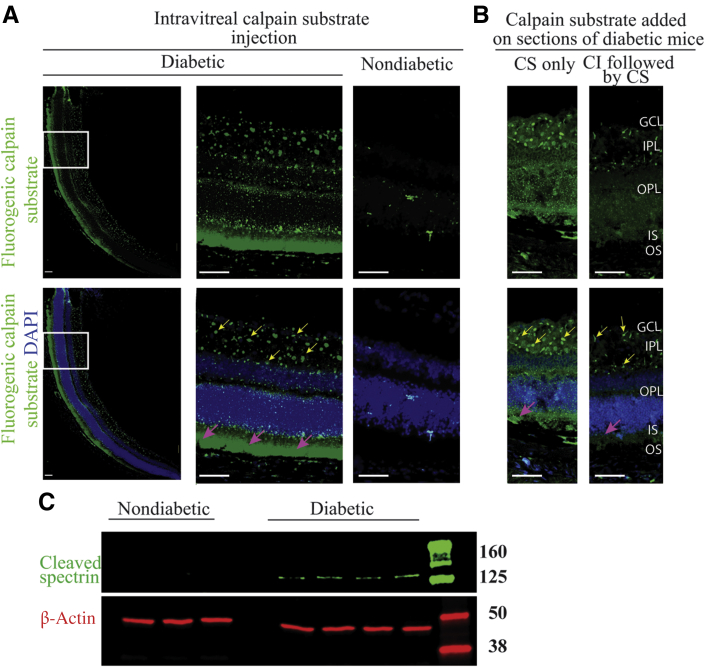
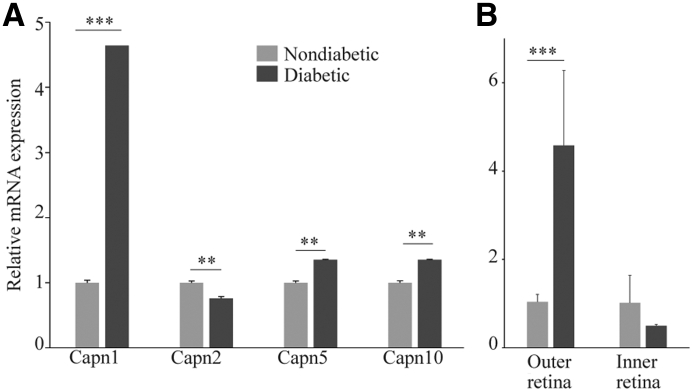
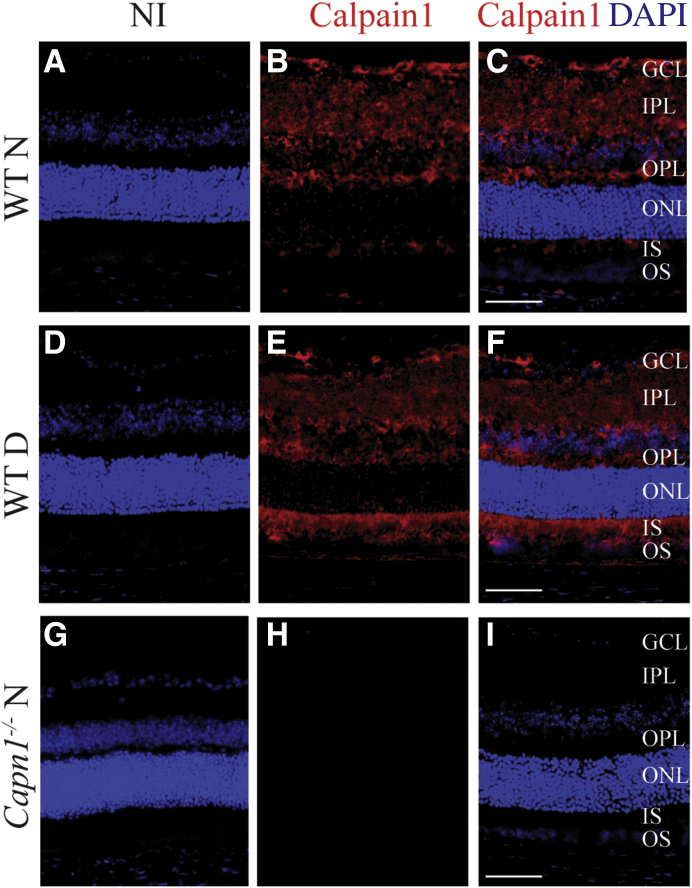
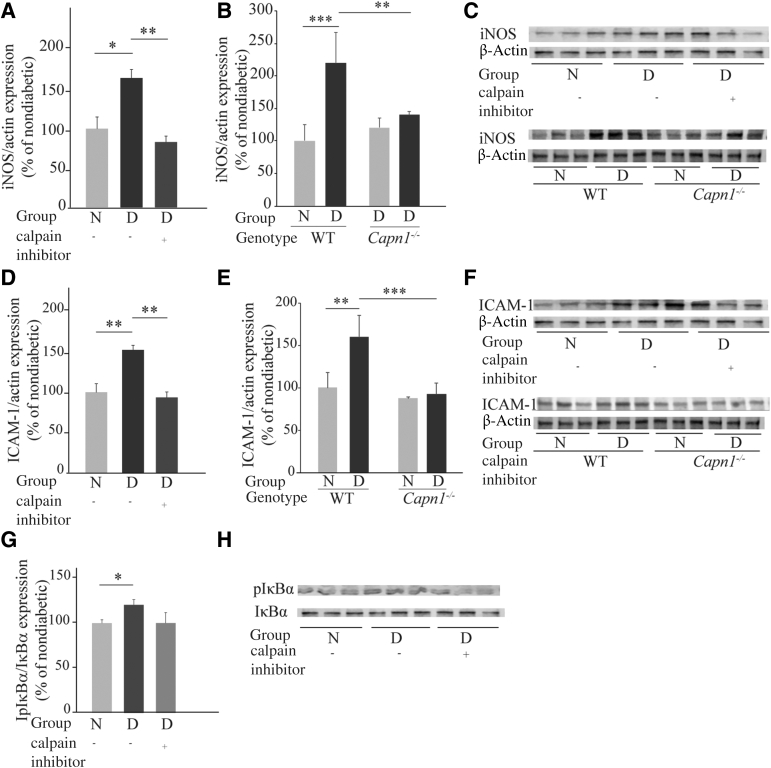
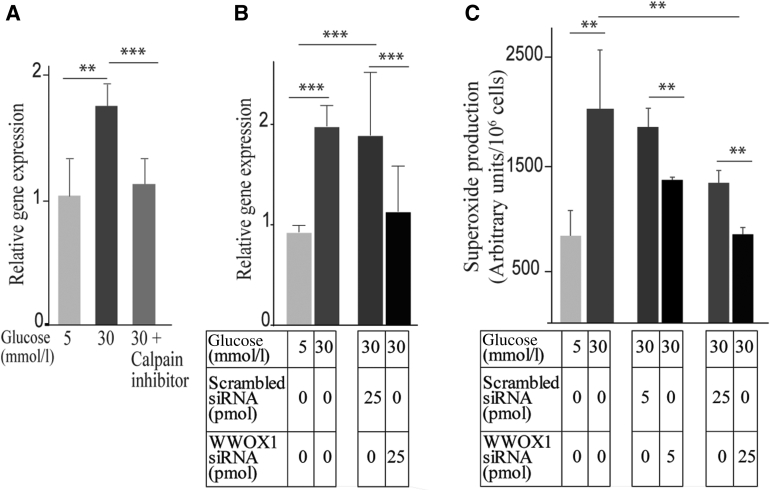
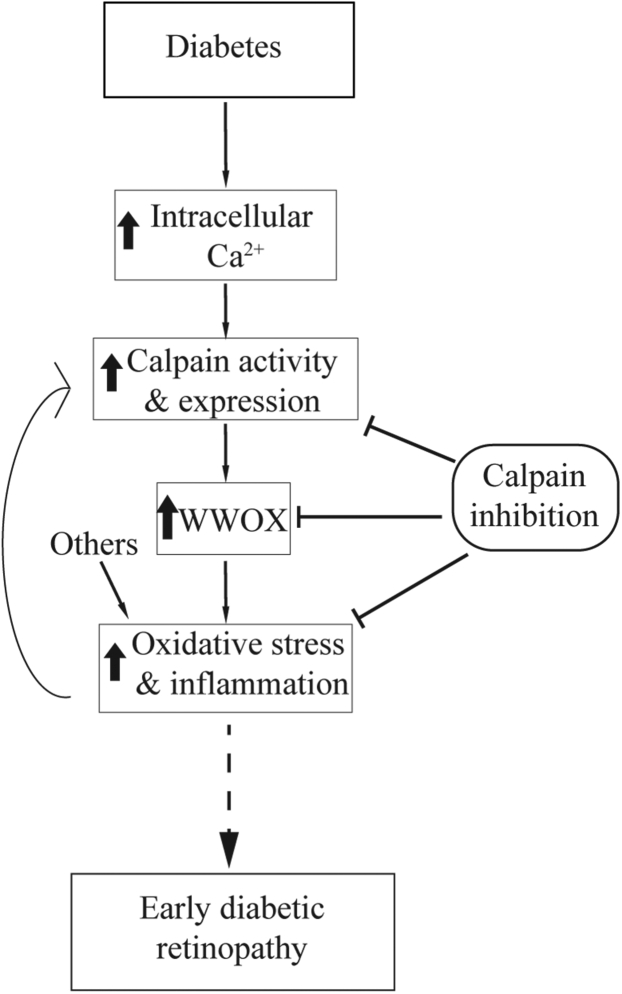
This study tested the hypothesis that diabetes promotes a greater than normal cytosolic calcium level in rod cells that activates a Ca2+-sensitive protease, calpain, resulting in oxidative stress and inflammation, two pathogenic factors of early diabetic retinopathy. Nondiabetic and 2-month diabetic C57Bl/6J and calpain1 knockout (Capn1-/-) mice were studied; subgroups were treated with a calpain inhibitor (CI). Ca2+ content was measured in photoreceptors using Fura-2. Retinal calpain expression was studied by quantitative RT-PCR and immunohistochemistry. Superoxide and expression of inflammatory proteins were measured using published methods. Proteomic analysis was conducted on photoreceptors isolated from untreated diabetic mice or treated daily with CI for 2 months. Cytosolic Ca2+ content was increased twofold in photoreceptors of diabetic mice as compared with nondiabetic mice. Capn1 expression increased fivefold in photoreceptor outer segments of diabetic mice. Pharmacologic inhibition or genetic deletion of Capn1 significantly suppressed diabetes-induced oxidative stress and expression of proinflammatory proteins in retina. Proteomics identified a protein (WW domain-containing oxidoreductase [WWOX]) whose expression was significantly increased in photoreceptors from mice diabetic for 2 months and was inhibited with CI. Knockdown of Wwox using specific siRNA in vitro inhibited increase in superoxide caused by the high glucose. These results suggest that reducing Ca2+ accumulation, suppressing calpain activation, and/or reducing Wwox up-regulation are novel targets for treating early diabetic retinopathy.


Figures

Figure 1
Figure 1
Retinal thickness is not affected by Capn1 deletion or diabetes. A and D: Spectral domain-optical coherence tomography images (A) and quantification of data (D) show that the deletion of Capn1 (solid red lines) alone or in conjunction with diabetes (dashed red lines) resulted in essentially no loss of retinal photoreceptors (ONL thickness) compared with nondiabetic (solid black lines) or diabetic (dashed black lines) mice. B and C: Histologic images of the entire retina (horizontal temporal-nasal orientation) stained with DAPI (B) or hematoxylin and eosin (H&E) (C) confirm a normal organization of the retinas in all four groups of mice. Data are expressed as means ± SD. n = 8 mice (16 retinas) per group (D). Scale bars: 100 μm. D, 2 months diabetic; N, nondiabetic; ONL, outer nuclear layer; WT, wild type.
Figure 2
Figure 2
Resting intracellular Ca2+ levels are elevated significantly in rod cells from diabetic mice. A: Illustration of the measurement protocol. The inset shows a section of retina from a control mouse labeled with Fura2 and excited by 380 nm light. In this example, measurements were made from regions of interest positioned on 10 rod somas (circles). After measuring basal Ca2+ levels for 2 minutes, ionomycin (10 mmol/L) was applied with a Ca2+-free solution to measure the minimum 340/380 ratio (Rmin). Ca2+ was then elevated to approximately 1.2 mmol/L by applying Ames' medium in the presence of ionomycin to measure Rmax. B: Average basal Ca2+ levels were measured. The individual data points represent average measurements made from 2 to 10 rods in each eye [n = 21 control eyes (12 mice), 15 diabetic eyes (10 mice)]. The two samples showed a statistically significant difference. Data are expressed as means with 95% CIs. n = 21 control eyes (from 12 mice) and 15 diabetic eyes (from 10 mice) (B). ∗∗P ≤ 0.01. ONL, outer nuclear layer.
Figure 3
Figure 3
Calpain activity in nondiabetic and diabetic mice. A and B: Fluorogenic calpain substrate was injected intravitreally (A) or added on fresh-frozen cryosections (B) of diabetic and nondiabetic mice. In A, the left panels represent a wide view of the retina (nasal), and the middle panels represent enlarged view of the boxed regions. Calpain activity is shown with green, and nuclei were stained with DAPI (blue). Calpain activity was predominantly localized to photoreceptors of diabetic retina (magenta arrows) as compared with nondiabetic retina. Focal deposits of staining was present in the IPL and the GCL (yellow arrows). In B, sections were pretreated with or without calpain inhibitor (CI) before the addition of calpain substrate (CS). The pretreatment of the sections with CI abolished the staining in photoreceptors, but not of the focal staining. C: Calpain activity was determined by the level of cleavage of spectrin. Protein lysates were subjected to Western blotting using anti-cleaved spectrin antibody (approximately 160 kDa) and β-actin antibody (approximately 42 kDa) as loading control. Scale bars: 100 μm. GCL, ganglion cell layer; IPL, inner plexiform layer; IS, photoreceptor outer segment; OPL, outer plexiform layer; OS, photoreceptor outer segment.
Figure 4
Figure 4
Diabetes induces calpain1 gene expression in photoreceptor cells. A: Whole retinas of diabetic and nondiabetic mice were subjected to quantitative RT-PCR (qRT-PCR) to evaluate the expression of different calpain isoforms, calpain1, 2, 5, and 10. The results showed that diabetes induced a fivefold increase of Capn1 in diabetic retinas. B: Retina from diabetic and nondiabetic mice were bisected into photoreceptors (outer retina) and inner retina using a vibratome, and then mRNA levels were measured using qRT-PCR. Data are expressed as means ± SD. n = 3 measurements, 2 retinas from each mouse were pooled (n = 3 to 4). ∗∗P ≤ 0.01, ∗∗∗P ≤ 0.001 (two-tailed unpaired t-test).
Figure 5
Figure 5
Immunolocalization of calpain1 in the retinas of nondiabetic (N) and 2-month diabetic mice (D). GI: Sections from Capn1−/− mice were used as negative control. A, D, and G: Control sections were treated with the serum from nonimmunized animals (NI). B, C, E, F, H, and I: Nuclei were stained with DAPI (in blue), and Capn1 (in red). All images are representative. n = 3 mice (approximately 5 months) and 1 retina from each mouse. Scale bars: 100 μm. GCL, ganglion cell layer; IPL, inner plexiform layer; IS, photoreceptors inner segment; ONL, outer nuclear layer; OPL, outer plexiform layer; OS, photoreceptors outer segment; WT, wild type.
Figure 6
Figure 6
Calpain inhibition (A) and deletion (B) mitigate diabetes-induced superoxide generation. Calpain inhibitor was administered daily (i.p. injections at a dose of 10 mg/kg). Duration of diabetes was 2 months at the time of this assay, and administration of the inhibitor began promptly after the initiation of diabetes. n = 4 to 8 per group. ∗∗∗P ≤ 0.001. D, diabetic; N, nondiabetic; WT, wild type.
Figure 7
Figure 7
Pharmacologic inhibition of calpain and genetic deletion of Capn1 mitigate diabetes-induced iNOS, ICAM-1 up-regulation, and pIκBα. A, D, and G: Calpain inhibitor was administered daily to diabetic mice (i.p. daily 10 mg/kg). B and E: Whole-body deletion of Capn1. Duration of diabetes was 2 months at the time of this assay, and administration of the inhibitor began promptly after the initiation of diabetes (n = 4 to 7 per group). C, F, and H: Representative immunoblots for iNOS, ICAM-1, β-actin, pIκBα, and IκBα. A, B, D, E, and G: Summary graph of data for iNOS, ICAM-1, and pIκBα expression determined by image analysis. Data are expressed relative to the expression of β-actin, a housekeeping protein, and IκBα in the. same lanes, for iNOS and ICAM, and for pIκBα, respectively. Data are expressed as a percentage of the value of nondiabetic controls. ∗P ≤ 0.05; ∗∗P ≤ 0.01; and ∗∗∗P ≤ 0.001. D, diabetic; ICAM-1, intercellular adhesion molecule 1; iNOS, inducible nitric oxide synthase; N, nondiabetic.
Figure 8
Figure 8
Physiologic testing on the effects of Capn1 deletion on retinal function. ERG response functions were recorded to evaluate the impact of Capn1 deletion and diabetes on retinal function under scotopic conditions; both a-wave (A), b-wave (B), and scotopic b-wave implicit time (C), and photopic b-wave for green (D) and blue (E) light. In WT mice, 2 months of diabetes significantly reduced scotopic b-wave and increased scotopic implicit time when compared with nondiabetic controls; the deletion of Capn1 significantly inhibited the reduction of scotopic b-wave and the increase of scotopic b-wave implicit time in diabetic Capn1−/− mice. Data are expressed as means ± SEM. n = 10 to 14 eyes. ∗P ≤ 0.05, ∗∗P ≤ 0.01. D, diabetic; ERG, electroretinographic; N, nondiabetic; WT, wild type.
Figure 9
Figure 9
WWOX is involved in superoxide generation by 661W cells incubated in nondiabetic (5 mmol/L) and diabetic (30 mmol/L) glucose. A:Wwox gene expression was increased twofold in the diabetic-like glucose concentration, and calpain inhibitor inhibited diabetes-induced Wwox expression. 66W1 photoreceptors were incubated in low glucose (5 mmol/L = normal glucose) or high glucose (30 mmol/L = diabetes-like glucose concentration) without or with calpain inhibitor (10 μmol/L). mRNA levels were performed using quantitative RT-PCR. B and C:Wwox knockdown using siRNA inhibited the glucose-induced increase Wwox gene expression (B) and superoxide generation (C) as compared with cells treated with scrambled-siRNA. Data are expressed as means ± SD. n = 2 replications of the results . ∗∗P ≤ 0.01, ∗∗∗P ≤ 0.001.
Figure 10
Figure 10
Postulated schematic relationship between dysregulation of intracellular Ca2+ and calpain activation in photoreceptor cells, the induction of oxidative stress and inflammation. Solid lines show confirmed pathways, and dotted lines show the pathway suggested.

References

    1. Arden G.B. The absence of diabetic retinopathy in patients with retinitis pigmentosa: implications for pathophysiology and possible treatment. Br J Ophthalmol. 2001;85:366–370. - PMC - PubMed
    1. Berkowitz B.A. Preventing diabetic retinopathy by mitigating subretinal space oxidative stress in vivo. Vis Neurosci. 2020;37:E002. - PMC - PubMed
    1. Kern T.S., Berkowitz B.A. Photoreceptors in diabetic retinopathy. J Diabetes Investig. 2015;6:371–380. - PMC - PubMed
    1. Berkowitz B.A., Bissig D., Patel P., Bhatia A., Roberts R. Acute systemic 11-cis-retinal intervention improves abnormal outer retinal ion channel closure in diabetic mice. Mol Vis. 2012;18:372–376. - PMC - PubMed
    1. Berkowitz B.A., Gradianu M., Schafer S., Jin Y., Porchia A., Iezzi R., Roberts R. Ionic dysregulatory phenotyping of pathologic retinal thinning with manganese-enhanced MRI. Invest Ophthalmol Vis Sci. 2008;49:3178–3184. - PMC - PubMed

Publication types

MeSH terms