Comparative Study
. 2021 Jul 2;21(1):639.
doi: 10.1186/s12879-021-06339-6.

Comparative cytokine profiling identifies common and unique serum cytokine responses in acute chikungunya and dengue virus infection

Affiliations
Comparative Study

Comparative cytokine profiling identifies common and unique serum cytokine responses in acute chikungunya and dengue virus infection

Rama Dhenni et al. BMC Infect Dis. .

Abstract

Background: Infection by chikungunya (CHIKV) and dengue virus (DENV) can cause a wide spectrum of clinical features, many of which are undifferentiated. Cytokines, which broadly also include chemokines and growth factors, have been shown to play a role in protective immunity as well as DENV and CHIKV pathogenesis. However, differences in cytokine response to both viruses remain poorly understood, especially in patients from countries where both viruses are endemic. Our study is therefore aimed to provide a comparative profiling of cytokine response induced by acute DENV and CHIKV infections in patients with similar disease stages and in experimental in vitro infections.

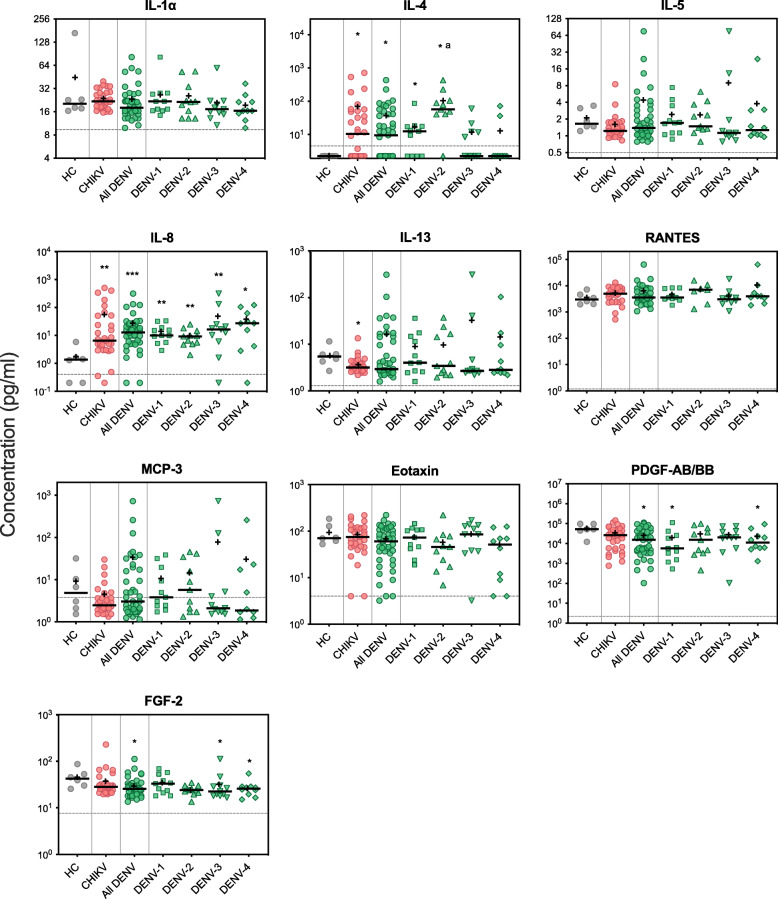
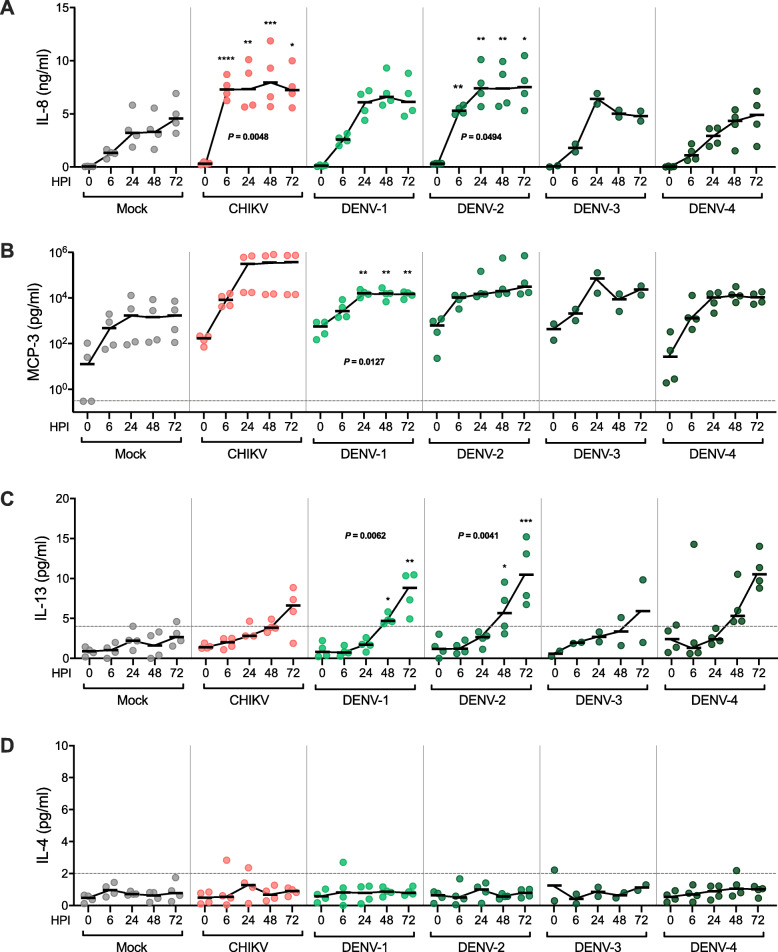
Methods: By using multiplex immunoassay, we compared host cytokine profiles between acute CHIKV and DENV infections by analysing serum cytokine levels of IL-1α, IL-4, IL-5, IL-8, IL-13, RANTES, MCP-3, eotaxin, PDGF-AB/BB, and FGF-2 from the sera of acute chikungunya and dengue fever patients. We further investigated the cytokine profile responses using experimental in vitro CHIKV and DENV infections of peripheral blood mononuclear cells (PBMCs).

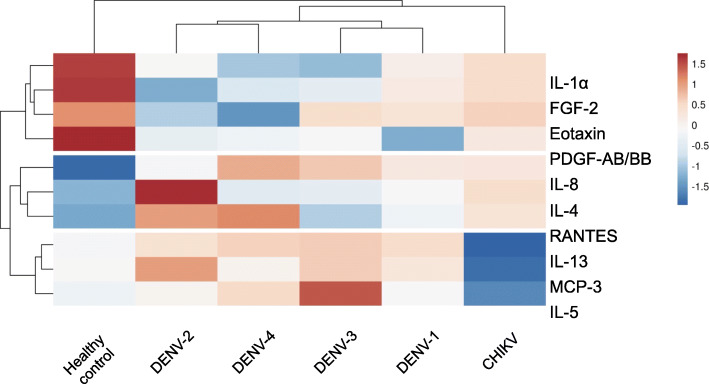
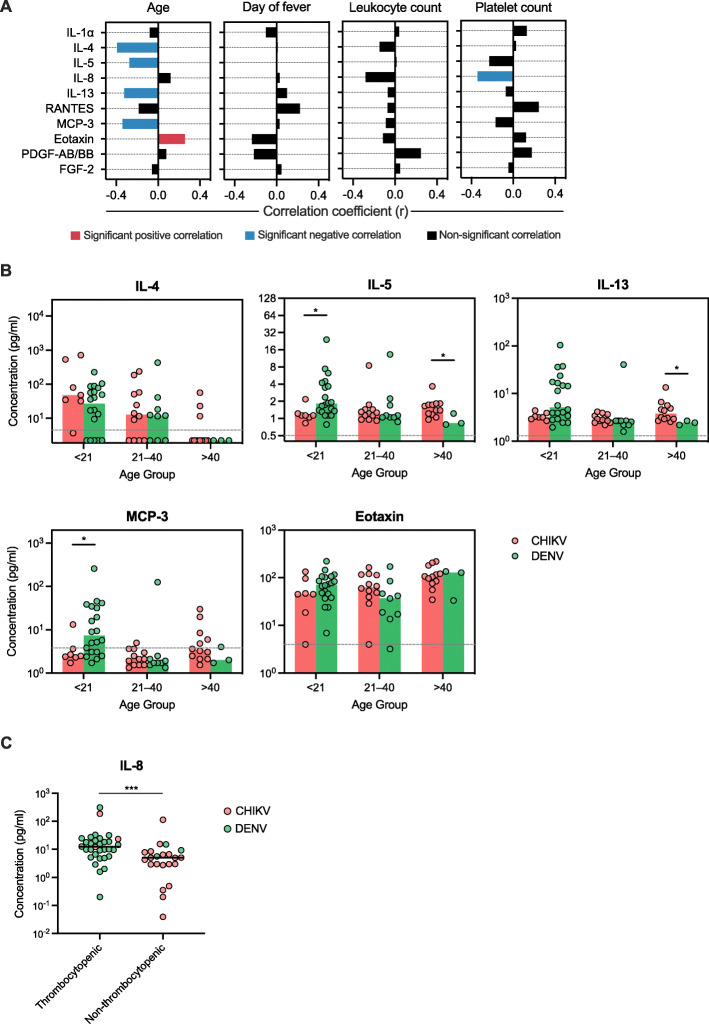
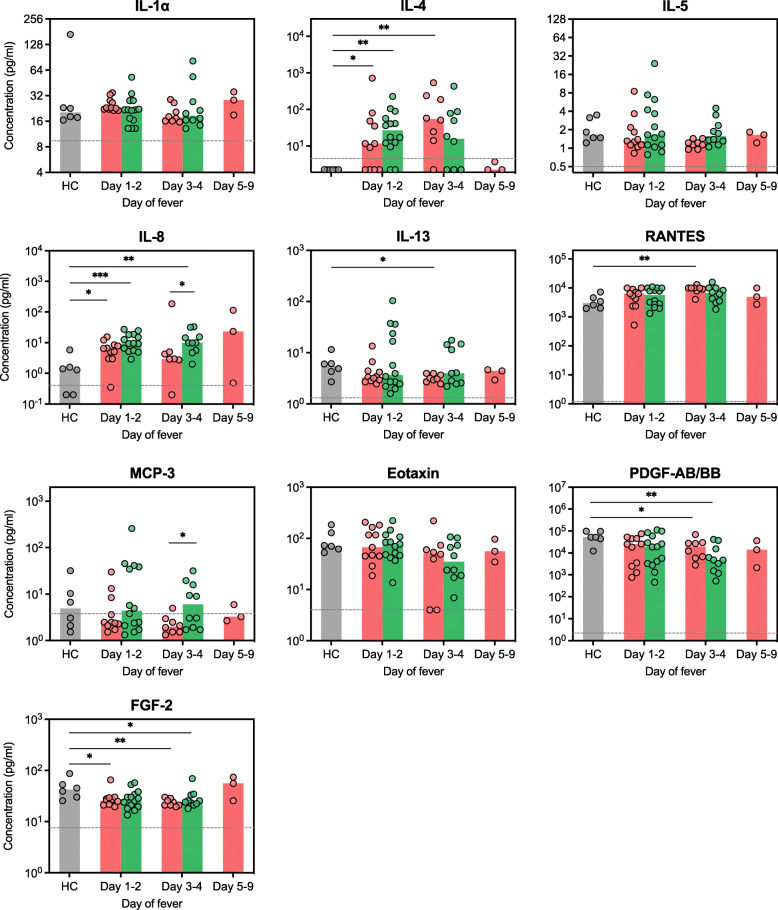
Results: We found that both CHIKV and DENV-infected patients had an upregulated level of IL-8 and IL-4, with the highest IL-4 level observed in DENV-2 infected patients. Higher IL-8 level was also correlated with lower platelet count in dengue patients. IL-13 and MCP-3 downregulation was observed only in chikungunya patients, while conversely PDGF-AB/BB and FGF-2 downregulation was unique in dengue patients. Age-associated differential expression of IL-13, MCP-3, and IL-5 was also observed, while distinct kinetics of IL-4, IL-8, and FGF-2 expression between CHIKV and DENV-infected patients were identified. Furthermore, the unique pattern of IL-8, IL-13 and MCP-3, but not IL-4 expression was also recapitulated using experimental in vitro infection in PBMCs.

Conclusions: Taken together, our study identified common cytokine response profile characterized by upregulation of IL-8 and IL-4 between CHIKV and DENV infection. Downregulation of IL-13 and MCP-3 was identified as a unique cytokine response profile of acute CHIKV infection, while distinct downregulation of PDGF-AB/BB and FGF-2 characterized the response from acute DENV infection. Our study provides an important overview of the host cytokine responses between CHIKV and DENV infection, which is important to further understand the mechanism and pathology of these diseases.

Keywords: Chikungunya; Cytokine; Dengue; Host response.


Conflict of interest statement

The authors declare that they have no competing interests.

Figures

Fig. 1
Fig. 1
Serum cytokine expression profile of acute CHIKV and DENV-infected patients. Cytokine levels were compared among the groups of 6 healthy controls (HC), 32 CHIKV-infected, and 43 DENV-infected patients, which comprised of 11 DENV-1, 11 DENV-2, 11 DENV-3, and 10 DENV-4 infected patients. Each dot represents the cytokine concentration of an individual. Horizontal bars and plus signs indicate group median and mean, respectively. Assay detection sensitivity limits are indicated by the grey dashed line. Black asterisks represent statistical significance by the Mann-Whitney test between corresponding groups compared to healthy control (*P < 0.05, **P < 0.01). a Denotes statistical significance between the corresponding groups compared to any other group
Fig. 2
Fig. 2
Hierarchical clustering analysis comparing cytokine production of acute CHIKV and DENV-infected patients revealed differential expression profiles between CHIKV and DENV as well as between DENV serotypes. Cytokines are ordered vertically by hierarchical clustering of the rows, which places cytokines with similar expression profiles closer together. Cytokine concentration of patients from the same group are collapsed by taking the mean inside each group and are ordered horizontally by hierarchical clustering so that groups with similar cytokine expression are closer to each other. Rows are centred and unit variance scaling is applied to rows. Therefore, cytokine concentrations are scaled such that a difference of 1 means that the values are one standard deviation away from the average of the row. Red, white, and blue indicates highest, middle, and lowest expression, respectively. Both rows and columns are clustered using Euclidean distance and average linkage
Fig. 3
Fig. 3
Associations between clinical characteristics and serum cytokine levels of acute CHIKV and DENV-infected patients. (A) Spearman analysis was used to test correlations between serum cytokine level and age, duration of fever, leukocyte count, and platelet count. Bars represent correlation coefficient (r) value with colours indicating statistical significance. (B) Comparison of IL-4, IL-5, IL-13, MCP-3, and eotaxin serum levels among different age groups between CHIKV and DENV-infected patients. Assay detection sensitivity limits are indicated by the grey dashed line. (C) Comparison of IL-8 serum levels between thrombocytopenic (platelet count < 150,000 cells/μl) and non-thrombocytopenic groups. In (B) and (C), each dot represents the cytokine concentration of an individual. Bars or horizontal lines indicate group median. Black asterisks represent statistical significance by the Mann-Whitney test (*P < 0.05, ***P < 0.001)
Fig. 4
Fig. 4
Serum cytokine expression profile in CHIKV and DENV-infected patients on indicated day of fever. Cytokine levels from CHIKV and DENV-infected patients with available day of fever data were segregated into day 1–2, 3–4, and 5–9 and compared with healthy control (HC) group as well as among other groups. Each dot represents the cytokine concentration of an individual. Bars indicate group median. Assay detection sensitivity limits are indicated by the grey dashed line. Black asterisks represent statistical significance by the Mann-Whitney test (*P < 0.05, **P < 0.01, ***P < 0.001)
Fig. 5
Fig. 5
In vitro CHIKV and DENV infection of PBMCs induced expression of IL-8, IL-13, and MCP-3, but not IL-4. PBMCs from healthy donors were isolated and infected with CHIKV, DENV-1, -2, -3, -4 (MOI if 1) or mock-infected, and supernatant was collected at 0, 6, 24, 48, and 72 h post infection (HPI). Levels of (A) IL-8, (B) MCP-3, (C) IL-13, and (D) IL-4 in supernatant were measured by cytokine-specific sandwich ELISA. Each dot represents the cytokine concentration of an individual donor. Horizontal black bars indicate the respective group median, which are connected with the continuous black line. ELISA kit detection sensitivities are indicated by the grey dashed line. Statistical significances of time and treatment effects comparing either CHIKV, DENV-1, -2, -3, or-4 infected with mock infected PBMCS were analysed by the two-way repeated measure ANOVA. P values from statistically significant results are shown, while black asterisks represent statistical significance via Bonferroni corrected post hoc test (*P < 0.05, **P < 0.01, ***P < 0.001, ****P < 0.0001)

References

    1. Stanaway JD, Shepard DS, Undurraga EA, Halasa YA, Coffeng LE, Brady OJ, Hay SI, Bedi N, Bensenor IM, Castañeda-Orjuela CA, Chuang TW, Gibney KB, Memish ZA, Rafay A, Ukwaja KN, Yonemoto N, Murray CJL. The global burden of dengue: an analysis from the global burden of disease study 2013. Lancet Infect Dis. 2016;16(6):712–723. doi: 10.1016/S1473-3099(16)00026-8. - DOI - PMC - PubMed
    1. Staples JE, Breiman RF, Powers AM. Chikungunya fever: an epidemiological review of a re-emerging infectious disease. Clin Infect Dis. 2009;49(6):942–948. doi: 10.1086/605496. - DOI - PubMed
    1. Shahid U, Farooqi JQ, Barr KL, Mahmoodid SF, Jamil B, Imitaz K, et al. Comparison of clinical presentation and out-comes of Chikungunya and dengue virus infections in patients with acute undifferentiated febrile illness from the Sindh region of Pakistan. PLoS Negl Trop Dis. 2020;14(3):1–13. doi: 10.1371/journal.pntd.0008086. - DOI - PMC - PubMed
    1. Sasmono RT, Perkasa A, Yohan B, Haryanto S, Yudhaputri FA, Hayati RF, et al. Chikungunya detection during dengue outbreak in Sumatra, Indonesia: clinical manifestations and virological profile. Am J Trop Med Hyg. 2017;97(5):1393–1398. doi: 10.4269/ajtmh.16-0935. - DOI - PMC - PubMed
    1. Chipwaza B, Mugasa JP, Selemani M, Amuri M, Mosha F, Ngatunga SD, et al. Dengue and chikungunya fever among viral diseases in outpatient febrile children in Kilosa district hospital, Tanzania. PLoS Negl Trop Dis. 2014;8. - PMC - PubMed

Publication types

MeSH terms