. 2021 Jul 2;21(1):765.
doi: 10.1186/s12885-021-08482-4.

CD36 promotes vasculogenic mimicry in melanoma by mediating adhesion to the extracellular matrix

Affiliations

CD36 promotes vasculogenic mimicry in melanoma by mediating adhesion to the extracellular matrix

Carmela Martini et al. BMC Cancer. .

Abstract

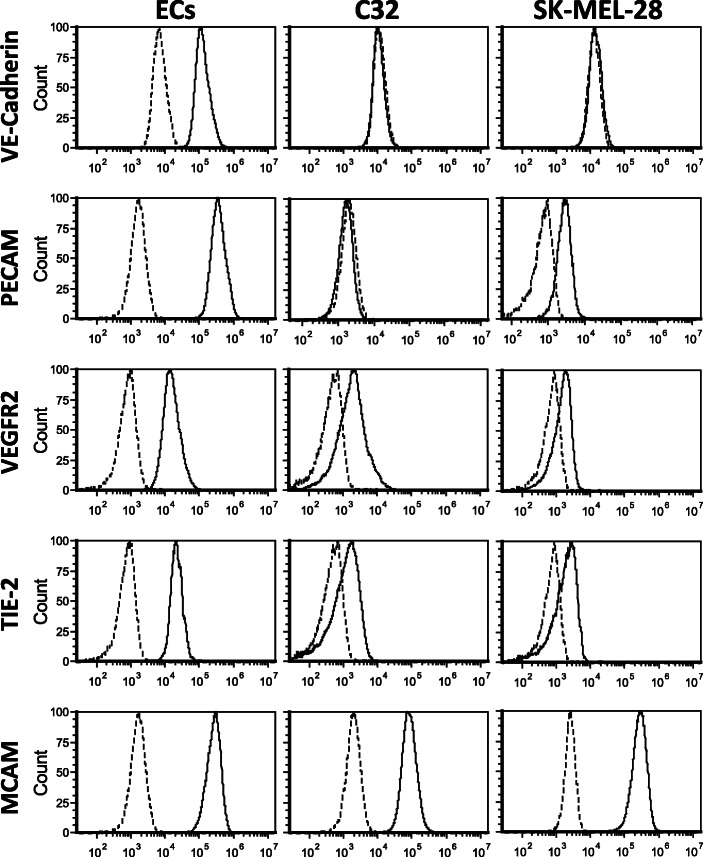
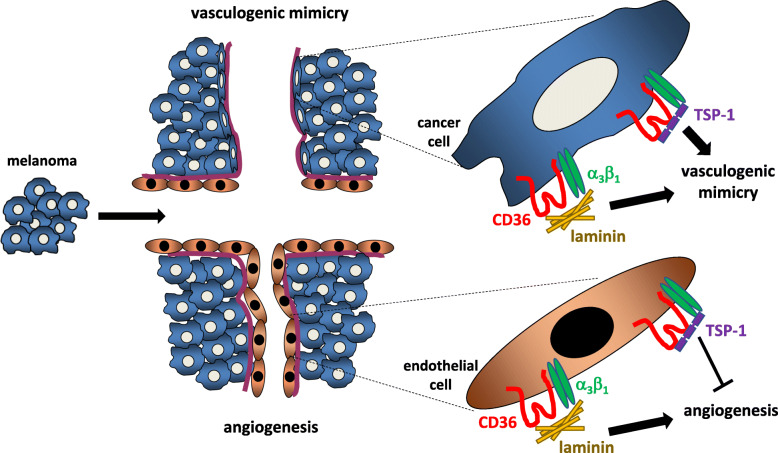
Background: The formation of blood vessels within solid tumors directly contributes to cancer growth and metastasis. Until recently, tumor vasculature was thought to occur exclusively via endothelial cell (EC) lined structures (i.e. angiogenesis), but a second source of tumor vasculature arises from the cancer cells themselves, a process known as vasculogenic mimicry (VM). While it is generally understood that the function of VM vessels is the same as that of EC-lined vessels (i.e. to supply oxygen and nutrients to the proliferating cancer cells), the molecular mechanisms underpinning VM are yet to be fully elucidated.

Methods: Human VM-competent melanoma cell lines were examined for their VM potential using the in vitro angiogenesis assays (Matrigel), together with inhibition studies using small interfering RNA and blocking monoclonal antibodies. Invasion assays and adhesion assays were used to examine cancer cell function.

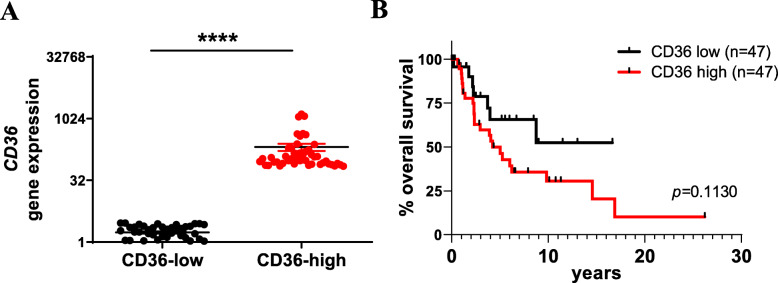
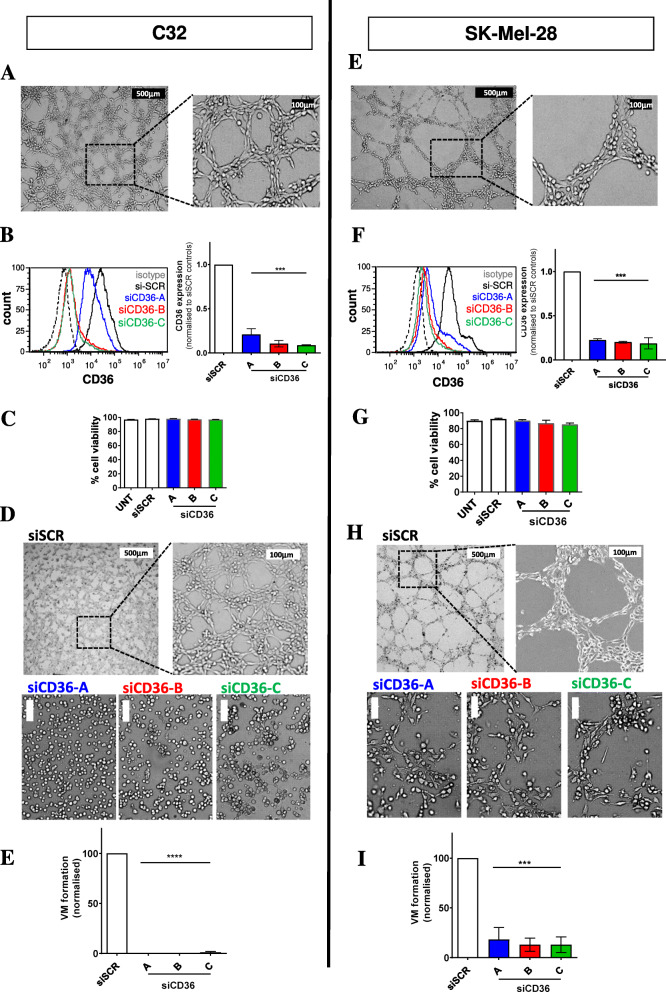
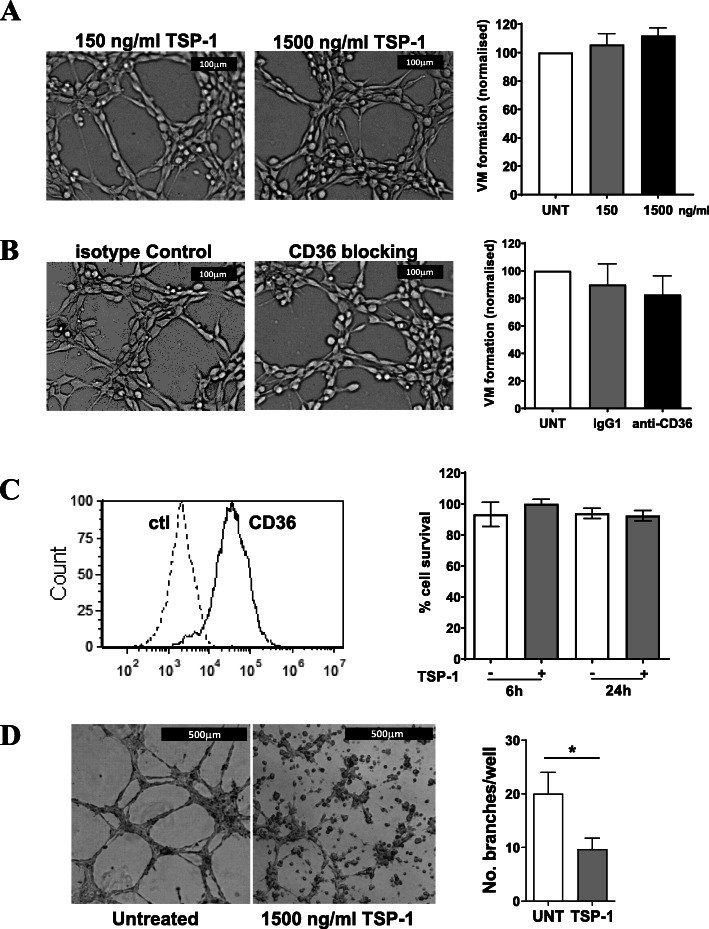
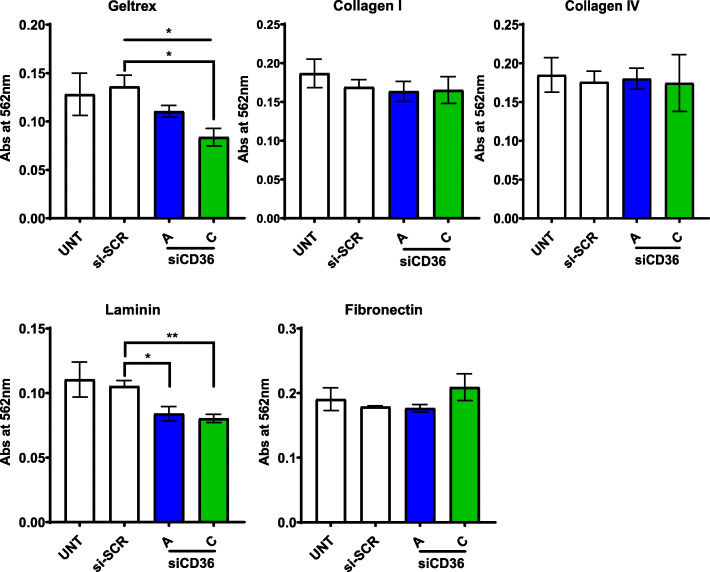
Results: Herein we demonstrate that CD36, a cell surface glycoprotein known to promote angiogenesis by ECs, also supports VM formation by human melanoma cancer cells. In silico analysis of CD36 expression within the melanoma cohort of The Cancer Genome Atlas suggests that melanoma patients with high expression of CD36 have a poorer clinical outcome. Using in vitro 'angiogenesis' assays and CD36-knockdown approaches, we reveal that CD36 supports VM formation by human melanoma cells as well as adhesion to, and invasion through, a cancer derived extracellular matrix substrate. Interestingly, thrombospondin-1 (TSP-1), a ligand for CD36 on ECs that inhibits angiogenesis, has no effect on VM formation. Further investigation revealed a role for laminin, but not collagen or fibronectin, as ligands for CD36 expressing melanoma cells.

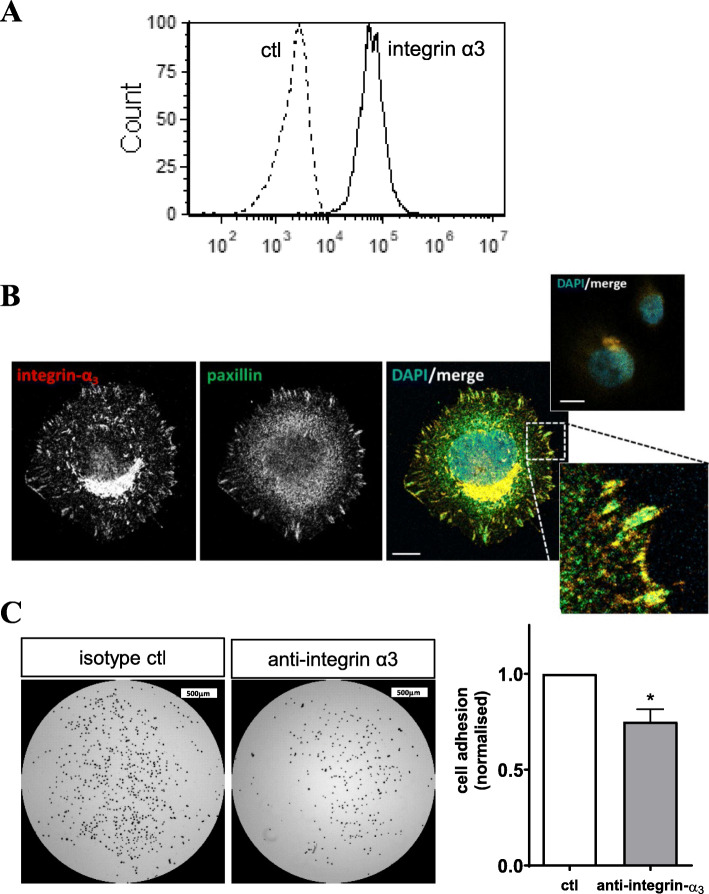
Conclusions: Taken together, this study suggests that CD36 is a novel regulator of VM by melanoma cancer cells that is facilitated, at least in part, via integrin-α3 and laminin. Unlike angiogenesis, VM is not perturbed by the presence of TSP-1, thus providing new information on differences between these two processes of tumor vascularization which may be exploited to combat cancer progression.

Keywords: CD36; Integrin; Laminin; Melanoma; Thrombospondin; Tumor microenvironment; Vasculogenic mimicry.


Conflict of interest statement

The authors declare no conflict of interest.

Figures

Fig. 1
Fig. 1
Association of clinical outcome in melanoma patients with high CD36 expression. (A) Patient data accessed from the TCGA-SKCM project (n = 470) was categorized into the top and bottom 10% of CD36 gene expression (CD36-high (red) and CD36-low (black), respectively), ****p < 0.0001, unpaired t-test. (B) From the data in A, a Kaplan-Meier analysis was conducted between the CD36-high and CD36-low populations (n = 47 per group)
Fig. 2
Fig. 2
CD36 inhibition by siRNA attenuates VM by melanoma cells in vitro. (A, E) Representative images of C32 and SK-Mel-28 human melanoma cells undergoing VM. For each cell line, the left image depicts VM with low magnification (scale bar = 500 μm) and the right image is a zoomed in view of the same well using higher magnification (scale bar = 100 μm). (B, F) Left panels, flow cytometric histograms of CD36 expression on C32 and SK-Mel-28 cells with isotype control (dotted line), CD36 (solid black line), and siCD36 knockdown cells (A, blue line; B, red line and C, green line). Right panels, bar graphs of flow data quantified from experimental repeats, siCD36 (constructs A-C) normalized to scrambled siRNA (siSCR) controls. Data are expressed as mean ± SEM from n = 3 experiments.***p < 0.001 vs siSCR control, one-way ANOVA. (C, G) Cell viability without and with CD36 knockdown. Data are expressed as mean ± SEM from n = 3 experiments. (D, H) Top panels are representative images of C32 and SK-Mel-28 melanoma cells undergoing VM without or with siCD36 knockdown. For each cell line, the left image depicts VM with low magnification (scale bar = 500 μm) and the right image is a zoomed in view of the same well using higher magnification (scale bar = 100 μm). Lower panels illustrate the VM formation following CD36 knockdown for constructs RNAi A-C. (scale bar = 100 μm) (E, I) Quantitation of VM formation by the cancer cells, normalized to si-SCR control within each experiment. Data are expressed as mean ± SEM from n = 3 experiments. ***p < 0.001 vs si-SCR control, one-way ANOVA
Fig. 3
Fig. 3
Surface expression profiling of ECs, C32 and SK-Mel-28 cells. The histograms show one representative experiment from n ≥ 3 replicates for each of the cell types with the dotted lines identifying isotype control stained cells and the solid lines representing cells stained for VE-cadherin, PECAM, VEGFR2, Tie-2 or MCAM
Fig. 4
Fig. 4
Blocking CD36:TSP-1 interactions does not inhibit VM by melanoma cells. (A) VM formation by C32 melanoma cells assessed following treatment with 150 and 1500 ng/ml TSP-1. Microscopy images are representative of VM with TSP-1 treatments (scale bar = 100 μm). Right bar graph, number of VM normalized to untreated (UNT) controls. Data are mean ± SEM from n = 3 experiments. (B) VM formation by C32 melanoma cells assessed following administration of anti-CD36 mAb (10 μg/ml) or isotype IgG1 control (10 μg/ml) prior to cell seeding for VM assay. Microscopy images are representative of VM (scale bar = 100 μm). Right bar graph, number of VM normalized to untreated (UNT) controls. Data are mean ± SEM from n = 3 experiments. (C) Left histogram, flow cytometric analysis of CD36 expression on HMVEC cells with isotype control (dotted line) and CD36 (solid line). Right bar graph, survival of HMVECs assessed without or with 1500 ng/ml TSP-1 for 6 h. Data are mean ± SEM from n = 3 experiments. (D) HMVEC angiogenesis without and with 1500 ng/ml TSP-1. Microscopy images are representative of EC angiogenesis (scale bar = 500 μm). Right bar graph is number of EC branches per well normalized to untreated (UNT) controls. Data are mean ± SEM from n = 3 experiments. *p < 0.05, t-test
Fig. 5
Fig. 5
CD36 facilitates the migration of melanoma cells. (A) Left panel, quantitated data of the distance travelled by C32 melanoma cells towards 10% FBS with siCD36 (siRNA A or C) or siRNA control (Scrambled). Right panel, quantitated data of total number of invading cells normalized to control (si-SCR). Data are mean ± SEM from n = 3 experiments. ****p < 0.0001 vs si-SCR, one-way ANOVA. (B) Left confocal images are representatives taken at a distance of 100 μm from the Transwell membrane start point for si-SCR control or siCD36 (A and C). Images were captured via a 20x objective on a Zeiss LSM 700 confocal microscope. Right panel, quantitated data of the number of cells at 100 μm from the Transwell membrane start point. Data are mean ± SEM from n = 3 experiments. ** p < 0.01 vs si-SCR, one-way ANOVA
Fig. 6
Fig. 6
CD36 aids selective adhesion by melanoma cells to components of the ECM. Rose Bengal staining of C32 melanoma cells, without and with siCD36 knockdown (untreated (UNT), siRNA control (si-SCR), and CD36-targeting siRNA (siCD36 A and C)) following 90 min exposure to plates coated with Geltrex, Collagen I, Collagen IV, Laminin or Fibronectin. Data are mean ± SEM from n = 3 experiments. * p < 0.05, **p < 0.01, one-way ANOVA
Fig. 7
Fig. 7
Integrin-α3 supports melanoma cell adhesion to laminin. (A) Flow cytometric analysis of integrin-α3 expression on C32 melanoma cells with isotype control (dotted line) and integrin-α3 (solid line). (B) Adhesion of C32 melanoma cells on to laminin coated coverslips for 60 min prior to staining for integrin-α3 (left panel), paxillin (middle panel) and a nuclear stain (DAPI, colored merged image). Dual stained focal contacts shown in high magnification insert (bottom right). Isotype control stains shown in the top insert. Scale bar = 10 μm. (C) Adhesion of C32 melanoma cells treated with an anti-integrin-α3 antibody or isotype control onto tissue culture plates coated with 50 μg/ml laminin. Microscopy images (left) illustrate the density of adherent cells on each well surface. Scale bar = 500 μm. Bar graph (right), quantification of C32 melanoma cell adhesion to laminin as assessed following treatment with a blocking anti-integrin-α3 antibody or isotype control. Results are normalized to control (ctl) wells and are mean ± SEM from n = 3 experiments. *p < 0.05, t-test
Fig. 8
Fig. 8
Schematic concept of CD36 in VM formation and cancer progression. Solid tumor growth is underpinned by angiogenesis and VM. We hypothesize that CD36 expression by tumor ECs and the cancer cells themselves interacts with integrin-α3 to promote adhesion to the tumor ECM (particularly laminin) thus facilitating tumor vascularization (i.e. angiogenesis and VM) and cancer progression. Thrombospondin (TSP-1) is a ligand for CD36 and inhibits EC-lined angiogenesis. By contrast, VM by highly malignant melanoma cells is unperturbed when TSP-1 binds CD36. This schematic was conceptualized and crafted by CSB using Microsoft PowerPoint

References

    1. El Hallani S, Boisselier B, Peglion F, Rousseau A, Colin C, Idbaih A, Marie Y, Mokhtari K, Thomas JL, Eichmann A, et al. A new alternative mechanism in glioblastoma vascularization: tubular vasculogenic mimicry. Brain. 2010;133(Pt 4):973–982. doi: 10.1093/brain/awq044. - DOI - PMC - PubMed
    1. Wang SY, Ke YQ, Lu GH, Song ZH, Yu L, Xiao S, Sun XL, Jiang XD, Yang ZL, Hu CC. Vasculogenic mimicry is a prognostic factor for postoperative survival in patients with glioblastoma. J Neuro-Oncol. 2013;112(3):339–345. doi: 10.1007/s11060-013-1077-7. - DOI - PubMed
    1. Ricci-Vitiani L, Pallini R, Biffoni M, Todaro M, Invernici G, Cenci T, Maira G, Parati EA, Stassi G, Larocca LM, de Maria R. Tumour vascularization via endothelial differentiation of glioblastoma stem-like cells. Nature. 2010;468(7325):824–828. doi: 10.1038/nature09557. - DOI - PubMed
    1. Baeten CI, Hillen F, Pauwels P, de Bruine AP, Baeten CG. Prognostic role of vasculogenic mimicry in colorectal cancer. Dis Colon Rectum. 2009;52(12):2028–2035. doi: 10.1007/DCR.0b013e3181beb4ff. - DOI - PubMed
    1. Li W, Zong S, Shi Q, Li H, Xu J, Hou F. Hypoxia-induced vasculogenic mimicry formation in human colorectal cancer cells: involvement of HIF-1a, Claudin-4, and E-cadherin and vimentin. Sci Rep. 2016;6(1):37534. doi: 10.1038/srep37534. - DOI - PMC - PubMed

LinkOut - more resources