Review
. 2021 Jul 2;9(1):52.
doi: 10.1186/s40364-021-00306-8.

Imaging biomarkers for evaluating tumor response: RECIST and beyond

Affiliations
Review

Imaging biomarkers for evaluating tumor response: RECIST and beyond

Ching-Chung Ko et al. Biomark Res. .

Abstract

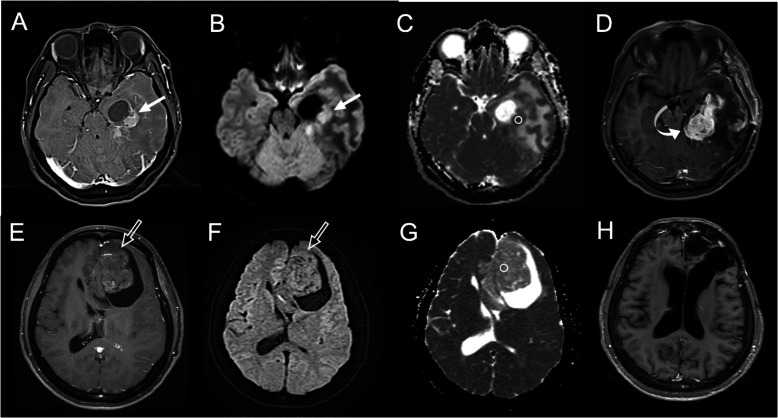
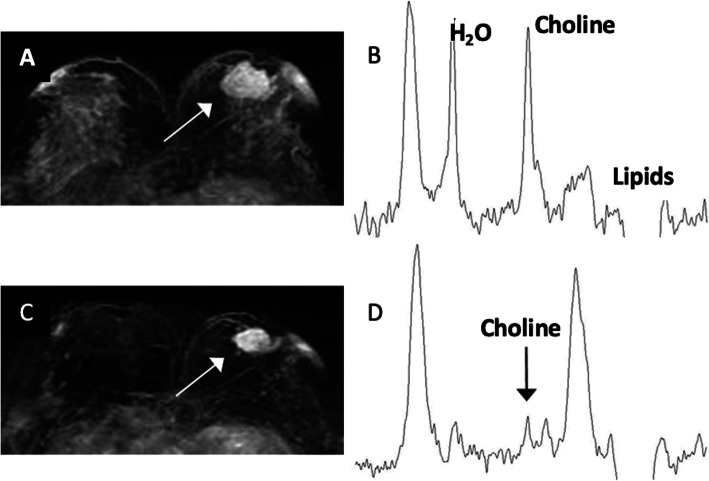
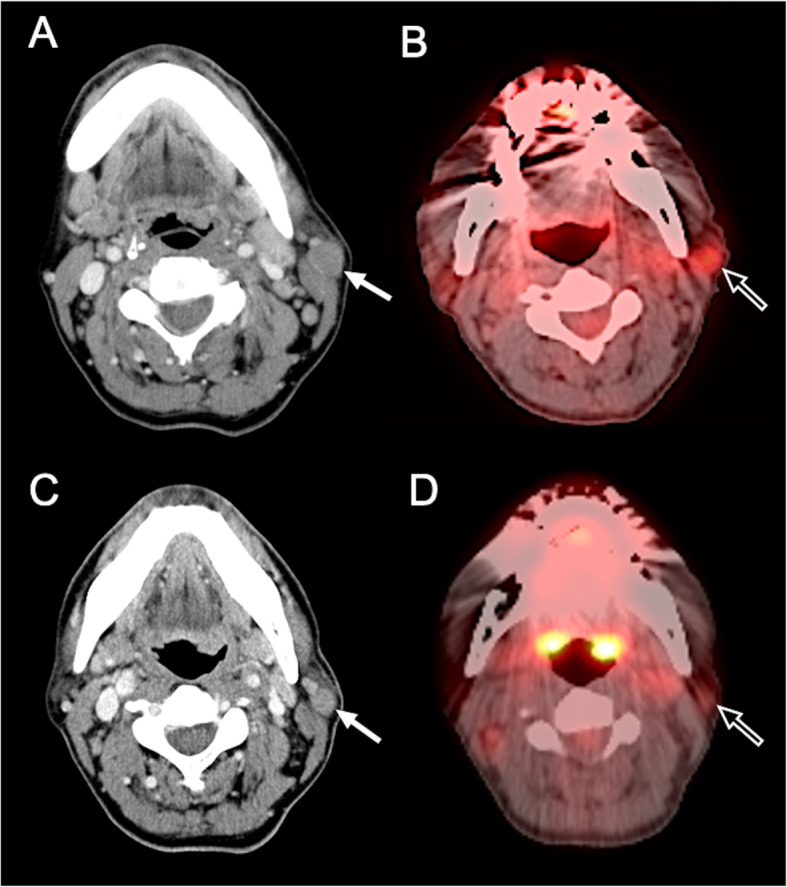
Response Evaluation Criteria in Solid Tumors (RECIST) is the gold standard for assessment of treatment response in solid tumors. Morphologic change of tumor size evaluated by RECIST is often correlated with survival length and has been considered as a surrogate endpoint of therapeutic efficacy. However, the detection of morphologic change alone may not be sufficient for assessing response to new anti-cancer medication in all solid tumors. During the past fifteen years, several molecular-targeted therapies and immunotherapies have emerged in cancer treatment which work by disrupting signaling pathways and inhibited cell growth. Tumor necrosis or lack of tumor progression is associated with a good therapeutic response even in the absence of tumor shrinkage. Therefore, the use of unmodified RECIST criteria to estimate morphological changes of tumor alone may not be sufficient to estimate tumor response for these new anti-cancer drugs. Several studies have reported the low reliability of RECIST in evaluating treatment response in different tumors such as hepatocellular carcinoma, lung cancer, prostate cancer, brain glioma, bone metastasis, and lymphoma. There is an increased need for new medical imaging biomarkers, considering the changes in tumor viability, metabolic activity, and attenuation, which are related to early tumor response. Promising imaging techniques, beyond RECIST, include dynamic contrast-enhanced computed tomography (CT) or magnetic resonance imaging (MRI), diffusion-weight imaging (DWI), magnetic resonance spectroscopy (MRS), and 18 F-fluorodeoxyglucose (FDG) positron emission tomography (PET). This review outlines the current RECIST with their limitations and the new emerging concepts of imaging biomarkers in oncology.

Keywords: Imaging biomarker; RECIST; Tumor response.


Conflict of interest statement

The authors declare that they have no competing interests.

Figures

Fig. 1
Fig. 1
Application of modified Response Evaluation Criteria in Solid Tumors (mRECIST) for hepatocellular carcinoma (HCC). A Measurement of the longest overall target tumor diameter (41 mm) according to conventional RECIST. B Measurement of the longest viable tumor diameter (30 mm) based on tumor enhancement area on arterial-phase CT imaging according to mRECIST for HCC
Fig. 2
Fig. 2
Bone density changes suggest tumor response in bone metastases. A 42-year-old man was diagnosed with lung adenocarcinoma and bone metastases. Pretreatment axial CT scan in the bone window shows two osteolytic metastases (both lesions with diameters of 10 mm) (white arrows) in thoracic vertebrae. B, C The osseous lesions have not significantly changed in the sum of longest diameters according to RECIST 1.1 but show osteosclerotic reaction (white arrows) in 6 months (B) and 10 months (C) after targeted therapy with afatinib, an epidermal growth factor receptor (EGFR) - tyrosine kinase inhibitor (TKI), representing good response. D, E Skeletal scintigraphy shows significantly decreased uptake of radiotracer after comparison between pretreatment (D) and posttreatment (E) images, which confirmed good therapeutic response
Fig. 3
Fig. 3
Measurement of tumor thickness for tumor burden assessment in malignant pleural mesothelioma (MPM) according to modified RECIST. The tumor thickness is measured perpendicularly to the chest wall (arrows) or mediastinum, not measuring the tumor longest diameter. The sum of six measured values from two different positions on three different levels is used as modified RECIST in MPM
Fig. 4
Fig. 4
Tumor necrosis indicates early good response in non-small cell lung cancer (NSCLC) receiving targeted therapy. A 53-year-old man diagnosed with NSCLC (positive EGFR exon 20 insertion mutations) and received afatinib therapy. A Pretreatment contrast-enhanced (CE) axial CT scan shows an enhancing tumor (arrow), with diameter of 64 mm. B, C Pseudo-progression with increased tumor size (arrow) was observed in 3 months (B) (67 mm in tumor diameter) and 8 months (C) (74 mm in tumor diameter) after targeted therapy. Simultaneously, the progression of focal tumor necrosis (arrowheads in figure B) to diffuse tumor necrosis (C) was also observed. D Shrinkage of tumor mass (50 mm in diameter) was observed 15 months after therapy
Fig. 5
Fig. 5
Illustration depicting the target lesion measurement in NSCLC by RECIST and Lee’s criteria. According to RECIST criteria, the size of the target lesion in lung cancer is measured by including both solid and ground-glass opacity (GGO) components (a). According to Lee’s criteria, the size of the target lesion is measured by solid component alone on soft tissue window imaging (b). If the target lesion has intratumoral cavitation, the size of the target lesion is measured by including only the soft-tissue component and excluding the air component (subtraction of cavity diameter from the longest diameter of tumor mass) (b - c)
Fig. 6
Fig. 6
Comparison between RECIST and Lee’s criteria in NSCLC. A 51-year-old man was diagnosed with NSCLC. A Pretreatment CE axial CT scan in lung window shows a 92-mm-sized tumor, including both solid and GGO components (black arrows). B After targeted therapy with afatinib, posttreatment CE CT scan shows no significant decrease in tumor size (84 mm in diameter, 9 % reduction) (black arrows), suggesting stable disease according to RECIST 1.1. C According to Lee’s criteria, the size of the target lesion (white arrows) is measured on pretreatment CE axial CT by solid component alone (79 mm in diameter) on soft tissue window imaging. D After targeted therapy, the size of the target lesion is measured by including only soft-tissue tumor (white arrows) (77 mm in diameter) and excluding necrotic air cavitation (asterisk) (49 mm in diameter), thus the tumor size is 28mm (65 % reduction), suggesting good tumor response according to Lee’s criteria
Fig. 7
Fig. 7
Application of Choi criteria in the gastrointestinal stromal tumor (GIST) after targeted therapy with imatinib. A 49-year-old man was diagnosed with GIST. A Pretreatment CE axial CT scan shows an 88-mm-sized enhancing tumor (arrow) arising from the stomach. The measured CT number on the region of interest (ROI) is 36.1 Hounsfield units (HU). B After targeted therapy with imatinib, posttreatment CE CT scan shows no significantly decreased in tumor size (87 mm in diameter) (arrow) but markedly decreased attenuation (22.6 HU, 37 % reduction), suggesting tumor response according to Choi criteria
Fig. 8
Fig. 8
MRI-dynamic contrast-enhanced (DCE) kinetic curve can be used to predict chemotherapy response. A - C The upper panel shows a woman with breast cancer in the right breast. The tumor responded very well to chemotherapy. After one cycle of Adriamycin and Cyclophosphamide (AC), and 4 cycles of AC or taxane, the tumor size was remarkably reduced (white arrows). D Note the change of the DCE kinetic curves, acquired from the pretreatment MRI (blue) and after 1 cycle of AC (red), from washout pattern to more flattened pattern, indicating the malignant cells were being eliminated. E - G The lower panel is a woman of non-responder. The breast cancer in the left breast was not reduced in size following chemotherapy (red arrows). H Note the DCE kinetic curve acquired from MRI after 1 cycle of AC (red), became more apparently a washout pattern compared with the pre-treatment curve (blue)
Fig. 9
Fig. 9
Low apparent diffusion coefficient (ADC) value on diffusion-weighted imaging (DWI) can predict worse therapeutic response in brain glioblastoma. A Pretreatment CE axial T1-weighted imaging (T1WI) shows a 40-mm-sized enhancing glioblastoma (arrow) with the cystic component in the left temporal lobe. B The DWI shows hyperintensity in the solid part of the tumor (arrow), indicating a diffusion restriction phenomenon. C The measured ADC value (b = 1000 s/mm2) on ROI is 0.72 × 10− 3 mm2/sec. (D) Rapid tumor recurrence (tumor diameter of 54 mm) (curved arrow) was observed 3 months after surgical resection. E Pretreatment CE axial T1WI shows another 65-mm-sized enhancing glioblastoma (open arrow) with a cystic component in the left frontal lobe. F DWI shows isointensity (no diffusion restriction) in the solid part of the tumor (open arrow). G The measured ADC value on ROI is 1.42 × 10− 3 mm2/sec. (H) No tumor recurrence was observed 72 months after surgical resection
Fig. 10
Fig. 10
Proton magnetic resonance spectroscopy (MRS) can early predict chemotherapy response. A A woman with 34 mm breast cancer in the left breast (white arrow). B The pretreatment MRS shows a choline peak of 2.33 mmol/kg. C After one cycle of Adriamycin and Cyclophosphamide, the tumor was 26 mm (white arrow), showing a 24 % reduction in size. According to the RECIST 1.1, this is a non-responder. D However, posttreatment MRS shows much more sensitive evidence of tumor response with a 51 % reduction of total choline level (from 2.33 mmol/kg to 1.15 mmol/kg) (black arrow)
Fig. 11
Fig. 11
18 F-fluorodeoxyglucose (FDG) positron emission tomography (PET) can predict early response in targeted therapy. A 53-year-old man was diagnosed with Hodgkin lymphoma at the left parotid gland. A Pretreatment CE axial CT imaging shows a 16 mm tumor mass at the left parotid gland (white arrow). B The SUVmax value of 3.0 in the target lesion (open arrow) was detected on a pretreatment PET-CT scan. C After five cycles of brentuximab vedotin, a tumor size of 13.5 mm (white arrow) was observed, showing a 16 % reduction in size. According to the RECIST 1.1, this is a non-responder. D However, posttreatment PET-CT scan shows good tumor response with 50 % reduction of SUVmax value (from 3.0 to 1.5) (open arrow)

References

    1. O’Connor JP, Aboagye EO, Adams JE, Aerts HJ, Barrington SF, Beer AJ, et al. Imaging biomarker roadmap for cancer studies. Nat Rev Clin Oncol. 2017;14(3):169–86. doi: 10.1038/nrclinonc.2016.162. - DOI - PMC - PubMed
    1. Wang YX, Deng M. Medical imaging in new drug clinical development. J Thorac Dis. 2010;2(4):245–52. - PMC - PubMed
    1. Therasse P, Arbuck SG, Eisenhauer EA, Wanders J, Kaplan RS, Rubinstein L, et al. New guidelines to evaluate the response to treatment in solid tumors. European Organization for Research and Treatment of Cancer, National Cancer Institute of the United States, National Cancer Institute of Canada. J Natl Cancer Inst. 2000;92(3):205–16. doi: 10.1093/jnci/92.3.205. - DOI - PubMed
    1. Eisenhauer EA, Therasse P, Bogaerts J, Schwartz LH, Sargent D, Ford R, et al. New response evaluation criteria in solid tumours: revised RECIST guideline (version 1.1) Eur J Cancer. 2009;45(2):228–47. doi: 10.1016/j.ejca.2008.10.026. - DOI - PubMed
    1. Saini S. Radiologic measurement of tumor size in clinical trials: past, present, and future. AJR American journal of roentgenology. 2001;176(2):333–4. doi: 10.2214/ajr.176.2.1760333. - DOI - PubMed

LinkOut - more resources