. 2021 Jul 15:467:188-200.
doi: 10.1016/j.neuroscience.2021.01.036. Epub 2021 May 21.

Extracellular Protons Mediate Presynaptic Homeostatic Potentiation at the Mouse Neuromuscular Junction

Affiliations

Extracellular Protons Mediate Presynaptic Homeostatic Potentiation at the Mouse Neuromuscular Junction

Yiyang Zhu et al. Neuroscience. .

Abstract

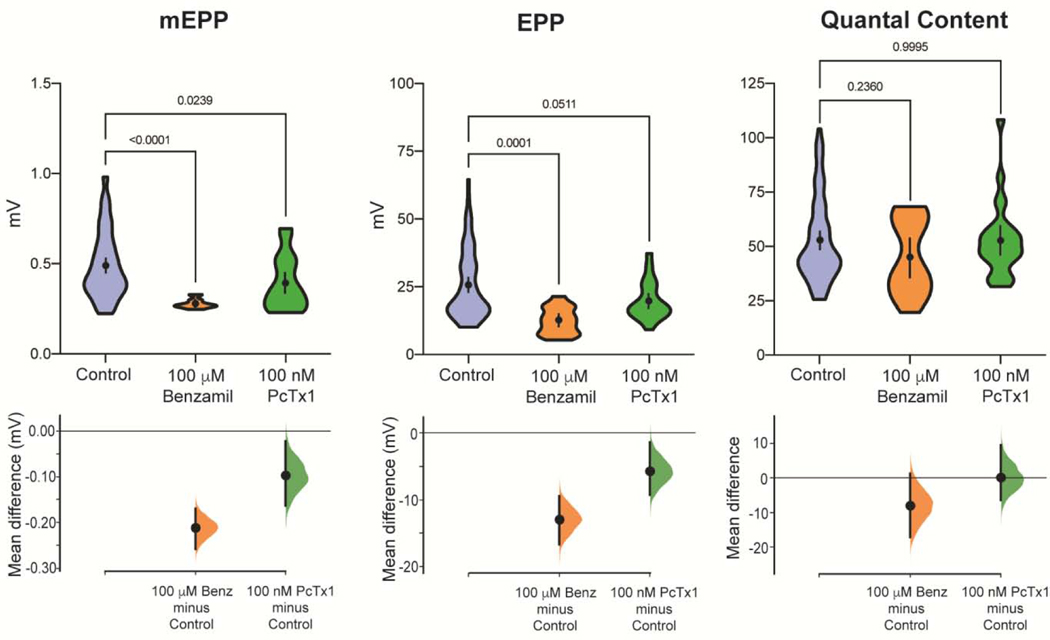
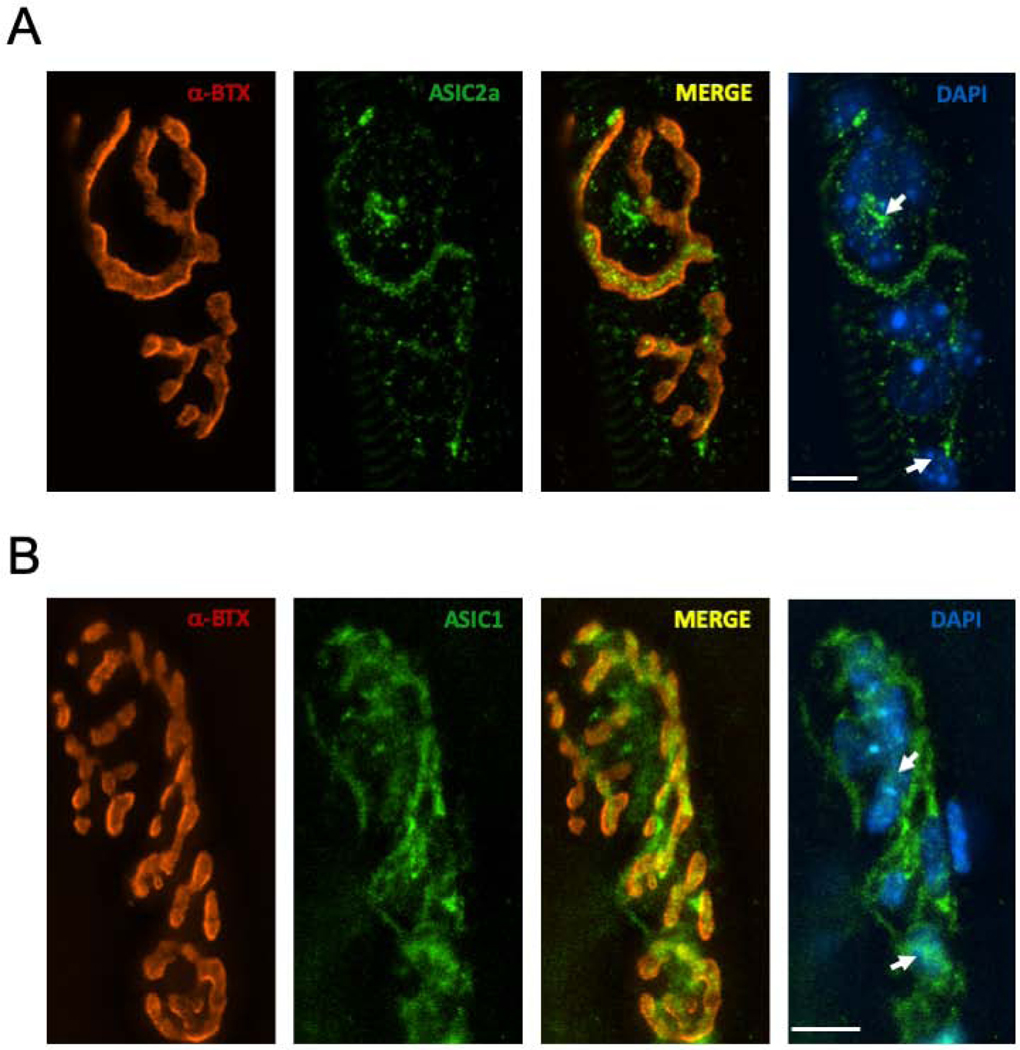
At the vertebrate neuromuscular junction (NMJ), presynaptic homeostatic potentiation (PHP) refers to the upregulation of neurotransmitter release via an increase in quantal content (QC) when the postsynaptic nicotinic acetylcholine receptors (nAChRs) are partially blocked. The mechanism of PHP has not been completely worked out. In particular, the identity of the presumed retrograde signal is still a mystery. We investigated the role of acid-sensing ion channels (ASICs) and extracellular protons in mediating PHP at the mouse NMJ. We found that blocking AISCs using benzamil, psalmotoxin-1 (PcTx1), or mambalgin-3 (Mamb3) prevented PHP. Likewise, extracellular acidification from pH 7.4 to 7.2 triggered a significant, reversable increase in QC and this increase could be prevented by PcTx1. Interestingly, an acidic saline (pH 7.2) also precluded the subsequent induction of PHP. Using immunofluorescence we observed ASIC2a and ASIC1 subunits at the NMJ. Our results indicate that protons and ASIC channels are involved in activating PHP at the mouse NMJ. We speculate that the partial blockade of nAChRs leads to a modest decrease in the pH of the synaptic cleft (∼0.2 pH units) and this activates ASIC channels on the presynaptic nerve terminal.

Keywords: ASIC; homeostatic; plasticity; proton; synaptic.


Figures

Fig. 1.
Fig. 1.
D-Tubocurarine (d-TC) induces presynaptic homeostatic potentiation (PHP) and this is blocked by ASIC inhibitors. A. mEPPs and EPPs were measured before and after a 10 min incubation in d-TC (n = 75 NMJs, 15 mice). Quantal Content (QC) was estimated from corrected EPP and mEPP amplitudes. The data are presented as violin plots, which show the probability density of the data at different values. The mean differences are shown as estimation plots (see Experimental Procedure: Statistical Analysis.) The insets are sample traces of EPPs and mEPPs before (black line) and after (grey line) d-TC. Each trace is the average of 10 measurements. Calibration bars indicate 0.2 mv, 2 ms for the mEPPs and 5 mv, 2 ms for the EPPs. B. QC was calculated from corrected mEPP and EPP amplitudes in the presence of 50 μM benzamil (n=25, 5 mice), 100 μM benzamil (n=15, 3 mice), 50 nM PcTx1 (n=73, 10 mice), 100 nM PcTx1 (n=25, 5 mice), and 50 nM Mamb3 (n=20, 4 mice) before and after a 10 min incubation in d-TC. For each condition, the ratios of QC after vs. before dTC were calculated and plotted as violin plots. The mean differences are shown as estimation plots. In both A and B, means are depicted as black dots; 95% confidence intervals are indicated by the ends of vertical error bars. In all figures, p values are indicated and were calculated from an ordinary one-way ANOVA.
Fig. 2.
Fig. 2.
High concentrations of the ASIC inhibitors Benzamil and PcTx1 reduce mEPP and EPP amplitude. MEPPs, EPPs and Quantal Content are plotted from NMJs incubated in either control saline (n=75, same data show in 1A), 100 μM benzamil (n=15, 3 mice), and 100 nM PcTx1 (n=25, 5 mice). Data are plotted as in Fig. 1. P values are indicated and were calculated from Student’s t-test or ordinary one-way ANOVA.
Fig. 3.
Fig. 3.
The Effect of Lowering extracellular pH on QC. A, mEPPs and EPPs were measured and QC estimated in pH 7.4 saline, after a 7 min incubation in pH 7.0 saline, and after a 20 min reapplication of pH 7.4 saline (n=25, 5 mice). The data are presented in the upper axes as violin plots, which show the probability density of the data at different values. Mean differences are plotted on the lower axes as bootstrap sampling distributions. Means are depicted as black dots; 95% confidence intervals are indicated by the ends of vertical error bars. B, mEPPs and EPPs were measured and QC estimated in pH 7.4 saline, after a 7 min incubation in pH 7.2 saline, and after a 20 min reapplication of pH 7.4 saline (n = 25, 5 mice). The data are presented as in 1A. In all figures, p values are indicated and were calculated from an ordinary one-way ANOVA.
Fig.4.
Fig.4.
Lowering extracellular pH underlies the upregulation of QC triggered by d-TC. A. mEPPs and EPPs were measured and QC estimated before and after a 10 min incubation in pH 7.2 saline with 100nM PcTx1 present throughout (n=25, 5 mice). The data for mEPPs, EPPs and QC are presented as violin plots. The plot on the far right includes the data from Fig. 3B to depicts the effect of pH 7.2 saline under control conditions vs. in the presence of 100 nM PcTx1. The Mean differences are plotted as a bootstrap sampling distribution. Means are depicted as black dots; 95% confidence intervals are indicated by the ends of vertical error bars. In all figures, p values are indicated and were calculated from an ordinary one-way ANOVA. B. mEPPs and EPPs were measured and QC was estimated in pH 7.4 saline, after a 7 min incubation in pH 7.2 saline, and then after a 15 min incubation with d-TC, still in pH 7.2 saline (n = 5 mice). Although dTC had its normal effects on mEPP and EPP amplitude (compare to Fig. 1A), dTC did not alter QC when compared to pH 7.2 saline. The data is plotted as in panel A. C. The ratio of QC after application of dTC compared to before dTC was applied (post/pre dTC) is shown for pH 7.4 saline (this is the same data presented in Fig 1B, Control) and for pH 7.2 saline (the same data presented in Fig. 4B).
Fig. 5.
Fig. 5.
ASIC1 and ASIC2a are located at the mouse NMJ. A. All of the images shown are maximum projections of 16 images collected at 0.5 μm increments vertically through the field containing the NMJ. α-bungarotoxin (α -BTX) is shown in Red. ASIC2a antibodies are in Green. Arrows point to clusters of ASIC2a staining that are outside the area defining the motor nerve terminal but near perisynaptic Schwann cell nuclei, indicated by the DAPI stain (Blue). Calibration bar, 10 μm. B. All of the images shown are maximum projections of 18 images collected at 0.5 μm increments vertically through the field containing the NMJ. α-bungarotoxin (α -BTX) is shown in Red. ASIC1 antibodies are in Green. Arrows point to clusters of ASIC2a staining that are outside the area defining the motor nerve terminal but near perisynaptic Schwann cell nuclei, indicated by the DAPI stain (Blue). Calibration bar, 10 μm.

Comment in

References

    1. Baron A, Diochot S, Salinas M, Deval E, Noël J, Lingueglia E (2013) Venom toxins in the exploration of molecular, physiological and pathophysiological functions of acid-sensing ion channels. Toxicon 75:187–204. - PubMed
    1. Beckwith-Cohen B, Holzhausen LC, Wang T-M, Rajappa R, Kramer RH (2019) Localizing Proton-Mediated Inhibitory Feedback at the Retinal Horizontal Cell–Cone Synapse with Genetically-Encoded pH Probes. J Neurosci 39:651–662. - PMC - PubMed
    1. Boscardin E, Alijevic O, Hummler E, Frateschi S, Kellenberger S (2016) The function and regulation of acid‐sensing ion channels (ASICs) and the epithelial Na+ channel (ENaC): IUPHAR Review 19. Brit J Pharmacol 173:2671–2701. - PMC - PubMed
    1. Caldwell L, Harries P, Sydlik S, Schwiening CJ (2013) Presynaptic pH and vesicle fusion in Drosophila larvae neurones. Synapse 67:729–740. - PMC - PubMed
    1. Chen X, Kalbacher H, Gründer S (2006) Interaction of Acid-sensing Ion Channel (ASIC) 1 with the Tarantula Toxin Psalmotoxin 1 is State Dependent. J Gen Physiology 127:267–276. - PMC - PubMed

Publication types