. 2021 Jul 2;7(27):eabf1973.
doi: 10.1126/sciadv.abf1973. Print 2021 Jul.

Adhesion dynamics in the neocortex determine the start of migration and the post-migratory orientation of neurons

Affiliations

Adhesion dynamics in the neocortex determine the start of migration and the post-migratory orientation of neurons

Ekaterina Epifanova et al. Sci Adv. .

Abstract

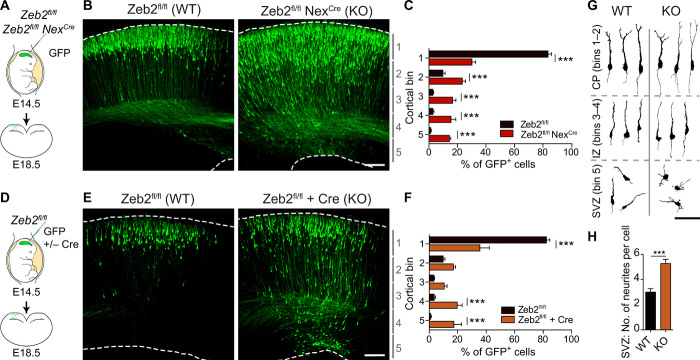
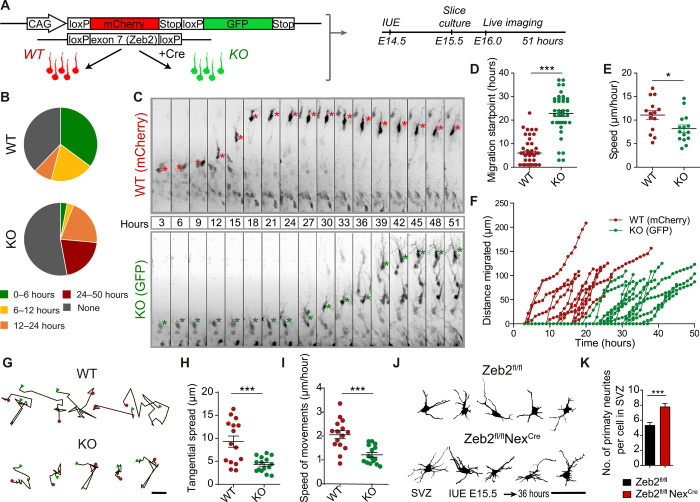
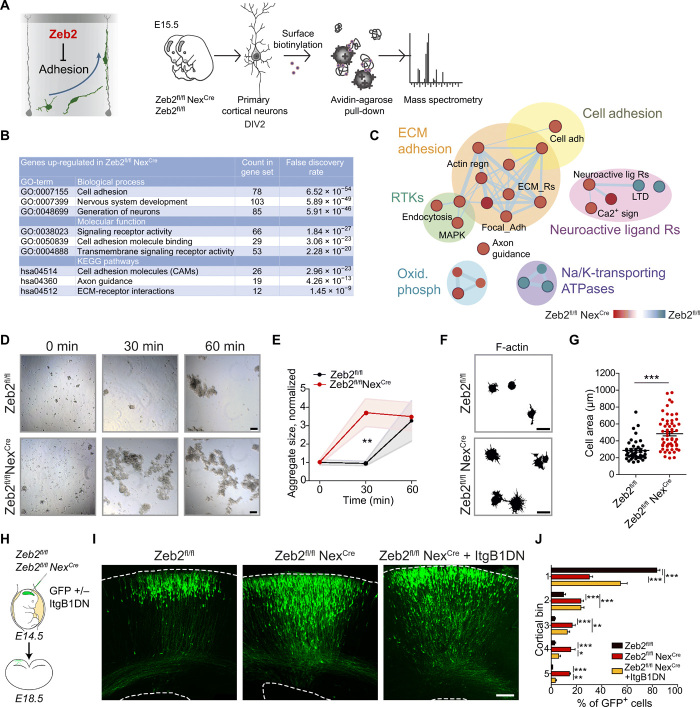
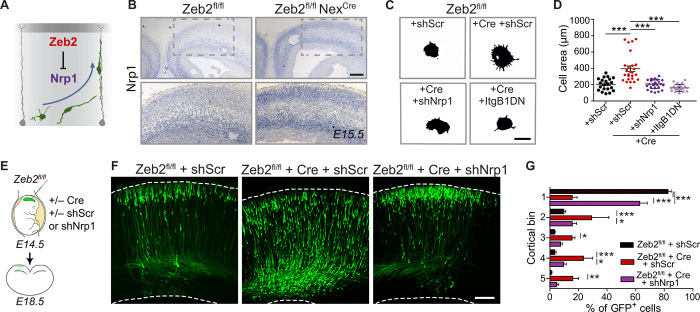
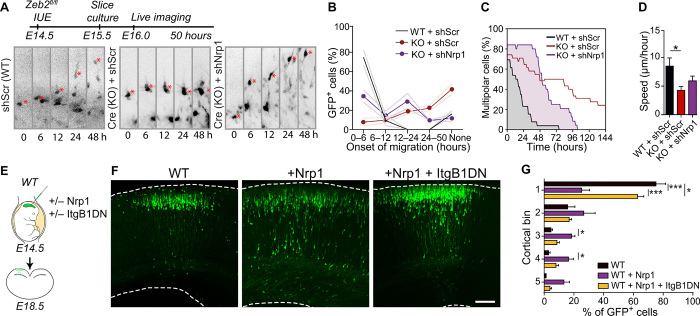
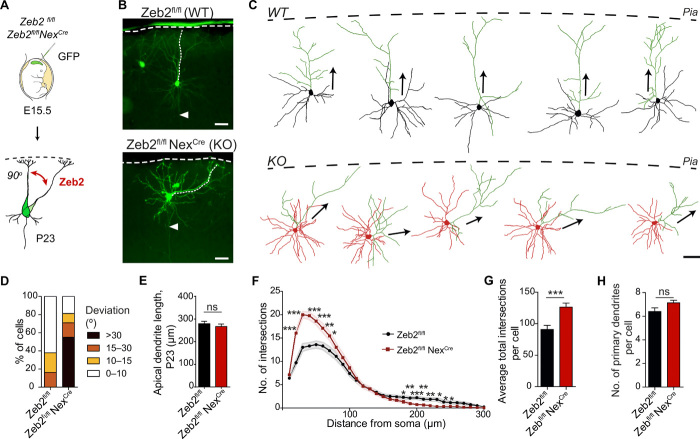
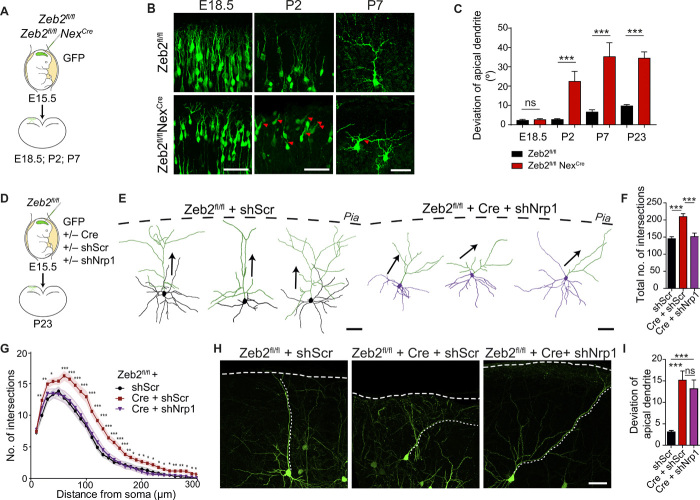
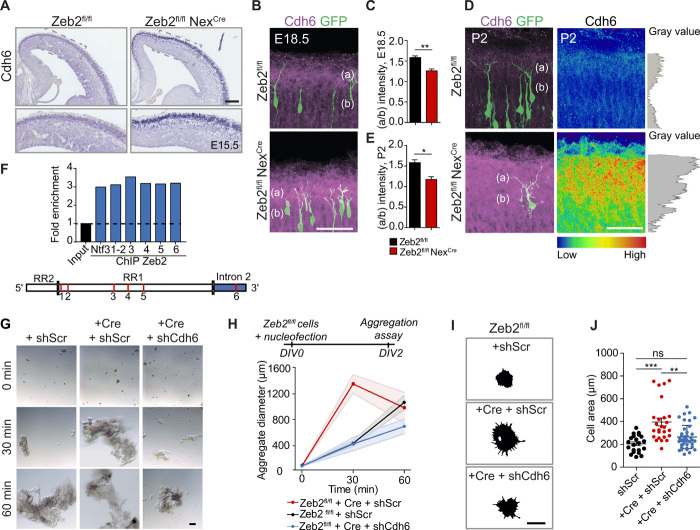
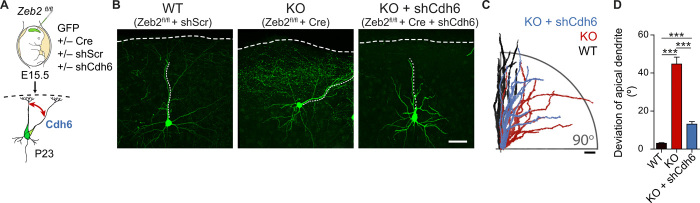
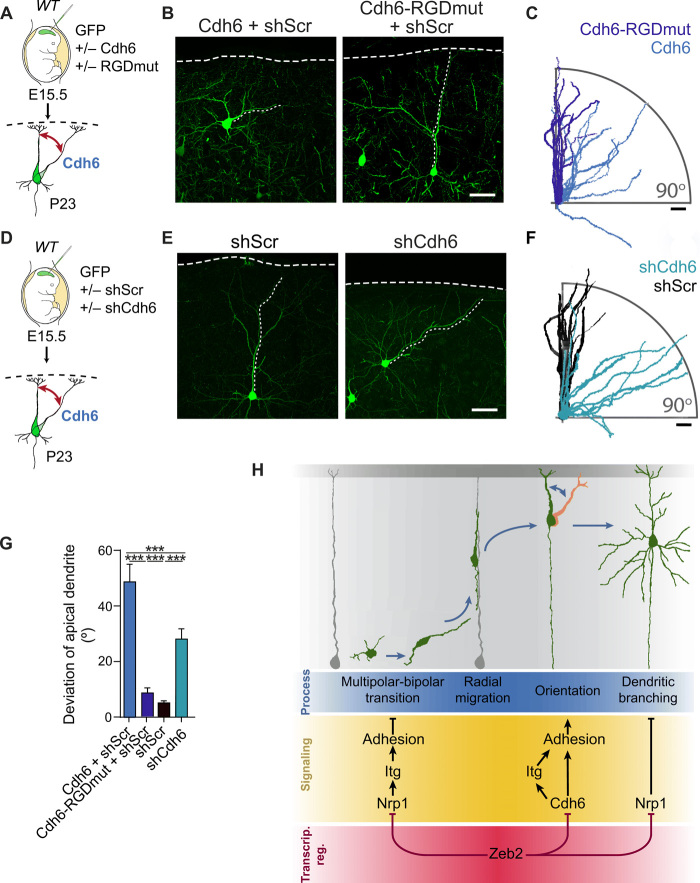
The neocortex is stereotypically organized into layers of excitatory neurons arranged in a precise parallel orientation. Here we show that dynamic adhesion both preceding and following radial migration is essential for this organization. Neuronal adhesion is regulated by the Mowat-Wilson syndrome-associated transcription factor Zeb2 (Sip1/Zfhx1b) through direct repression of independent adhesion pathways controlled by Neuropilin-1 (Nrp1) and Cadherin-6 (Cdh6). We reveal that to initiate radial migration, neurons must first suppress adhesion to the extracellular matrix. Zeb2 regulates the multipolar stage by transcriptional repression of Nrp1 and thereby downstream inhibition of integrin signaling. Upon completion of migration, neurons undergo an orientation process that is independent of migration. The parallel organization of neurons within the neocortex is controlled by Cdh6 through atypical regulation of integrin signaling via its RGD motif. Our data shed light on the mechanisms that regulate initiation of radial migration and the postmigratory orientation of neurons during neocortical development.


Figures

Fig. 1
Fig. 1. Zeb2 promotes the onset of radial migration.
(A to C) Loss of Zeb2 causes laminar displacement of UL neurons. (A) Control (Zeb2fl/fl) and Zeb2-deficient (Zeb2fl/fl NexCre) littermate animals were in utero electroporated at E14.5 with a GFP expression construct and analyzed at E18.5. (B) Representative images of GFP+ neurons in neocortical slices. Scale bar, 100 μm. (C) Laminar distribution of GFP+ cells in each cortical bin. The division of the neocortex into five equally sized bins is shown on the right. N = 12 Zeb2fl/fl and 5 Zeb2fl/fl NexCre animals. Two-way analysis of variance (ANOVA) with Bonferroni post hoc test. (D to F) Zeb2 regulates laminar position in a cell-intrinsic fashion. (D) Zeb2fl/fl animals were in utero electroporated at E14.5 with GFP in the presence or absence of Cre recombinase expressed under the postmitotic promoter Neurod1 (Cre) and analyzed at E18.5. (E) Representative images of GFP+ neurons in neocortical slices. Scale bar, 100 μm. (F) Laminar distribution of GFP+ neurons in vivo. N = 11 control and 6 Cre-expressing brains. Two-way ANOVA with Bonferroni post hoc test. (G) Morphology of GFP+ neurons in the CP, intermediate zone (IZ), or SVZ as indicated, at E18.5. Scale bar, 100 μm. (H) Number of neurites per cell for GFP+ neurons in the SVZ at E18.5. N = 15 per condition. Unpaired t test. KO, knockout; WT, wild type.
Fig. 2
Fig. 2. Zeb2 regulates the multipolar stage.
(A to I) Zeb2 regulates onset of radial migration and restricts tangential movement of multipolar cells. (A) E14.5 Zeb2fl/fl animals were in utero electroporated with a flox-mCherry-Stop-flox-GFP reporter and limiting amounts of Cre. Cre recombination excises Zeb2 and enables GFP expression (KO). Unrecombined cells express mCherry (WT). Brain slices were imaged for 51 hours, 1 day after IUE. (B) Distribution of radial migration onset. N = 37 mCherry+ and 34 GFP+ cells. (C) Clips from a time-lapse movie showing migration of WT and KO cells. Asterisks mark the soma. Migration onset (D) and speed (E) of neurons undergoing migration. N = 46 mCherry+ and 41 GFP+ cells. Mann-Whitney and unpaired t test. (F) Traces of individual neurons undergoing migration. (G) Movement of multipolar cells in the SVZ (0 to 20 hours). Scale bar, 5 μm. A red dot marks the start and a green triangle marks the end position. Tangential spread (H) and speed (I) of neurons in the SVZ. N = 15 WT and KO cells. Unpaired t test. (J and K) Zeb2 regulates multipolar morphology. (J) Zeb2fl/fl and Zeb2fl/fl NexCre animals were in utero electroporated at E15.5 with GFP and their morphology in the SVZ was analyzed 36 hours later. Scale bar, 50 μm. (K) Number of primary neurites per cell. N = 20 Zeb2fl/fl and Zeb2fl/fl NexCre cells. Unpaired t test.
Fig. 3
Fig. 3. Zeb2 represses cell adhesion.
(A to C) Zeb2 represses neuronal adhesion. (A) Surface proteins on Zeb2fl/fl NexCre and Zeb2fl/fl cortical neurons prepared from E15.5 embryos were identified by biotin-linked mass spectrometry. DIV, days in vitro. (B) Top Gene Ontology (GO) terms for surface proteins up-regulated ≥1.5× upon loss of Zeb2. ECM, extracellular matrix; KEGG, Kyoto Encyclopedia of Genes and Genomes. (C) GO of surface-expressed proteins. Red nodes are up-regulated in Zeb2fl/fl NexCre and blue nodes are up-regulated in Zeb2fl/fl animals. ATPase, adenosine triphosphatase; MAPK, mitogen-activated protein kinase; RTK, receptor tyrosine kinase. (D and E) Zeb2 suppresses neuronal aggregation. (D) Aggregation of single-cell suspensions over time. Scale bars, 100 μm. (E) Average cell aggregate size. N = 15, 10, and 7 Zeb2fl/fl and 12, 12, and 15 Zeb2fl/fl NexCre aggregates at 0, 30, and 60 min, respectively. One-way ANOVA with Kruskal-Wallis test. (F and G) Zeb2 inhibits adhesion to the extracellular matrix. (F) Attachment of neuronal suspensions to laminin-coated surfaces after 2 hours. Scale bars, 15 μm. (G) Lamellipodial spreading of attached cells. N = 42 Zeb2fl/fl and 56 Zeb2fl/fl NexCre cells. Mann-Whitney test. (H to J) Zeb2 regulates radial migration through suppression of integrin signaling. (H) IUE of GFP and ItgB1DN into Zeb2fl/fl and Zeb2fl/fl NexCre E14.5 littermate animals. (I) GFP+ neurons at E18.5. Scale bar, 100 μm. (J) Laminar distribution of GFP+ neurons. N = 12 Zeb2fl/fl, 5 Zeb2fl/fl NexCre, and 5 Zeb2fl/fl NexCre + ItgB1DN animals. Two-way ANOVA with Bonferroni post hoc test.
Fig. 4
Fig. 4. Nrp1, a novel Zeb2-target, regulates the laminar position of UL neurons.
(A) Zeb2 represses Nrp1 expression. (B) ISH for Nrp1 in Zeb2fl/fl and Zeb2fl/fl NexCre animals at E15.5. Scale bar, 50 μm. (C and D) Nrp1 and integrins mediate enhanced adhesion of Zeb2-deficient neurons. (C) Adherence of Zeb2fl/fl primary cortical neurons transfected with scrambled short hairpin–mediated RNA (shScr), an Nrp1 shRNA (shNrp1) or ItgB1DN, and Cre as indicated to laminin-coated surfaces for 2 hours. Scale bar, 15 μm. (D) Lamellipodial spreading. N = 21 Zeb2fl/fl + shScr, 26 Zeb2fl/fl + Cre + shScr, 26 Zeb2fl/fl Cre + shNrp1, and 22 Zeb2fl/fl + Cre + ItgB1DN. One-way ANOVA (Kruskal-Wallis test) with Dunn’s multiple comparison test. (E to G) Zeb2 regulates laminar position through repression of Nrp1. (E) Zeb2fl/fl animals were in utero electroporated at E14.5 with shScr, shNrp1, and Cre as indicated and analyzed at E18.5. (F) GFP+ neurons in the neocortex. Scale bar, 100 μm. (G) Laminar distribution of GFP+ neurons at E18.5. N = 11 Zeb2fl/fl + shScr, 5 Zeb2fl/fl + shScr and Cre, and 7 Zeb2fl/fl + Cre + shNrp1 animals. Two-way ANOVA with Bonferroni post hoc test.
Fig. 5
Fig. 5. Nrp1 controls the onset of migration in an integrin-dependent manner.
(A to D) Nrp1 regulates migration onset downstream of Zeb2. (A) Littermate Zeb2fl/fl animals were in utero electroporated at E14.5 with GFP, shScr, shNrp1, or Cre as indicated. Selected clips from the 50-hour time-lapse movie are shown. (B) Percentage of GFP+ cells starting migration during the indicated time windows. None = cells that do not initiate migration during imaging. N = 3 animals per condition. Two-way ANOVA with Bonferroni post hoc tests. (C) Proportion of multipolar GFP+ cells at different time points. N = 29 cells, 3 brains for WT; 33 cells, 3 brains for KO; and 25 cells, 3 brains KO + shNrp1. (D) Speed of radial migration. N = 9 WT + shScr, 9 KO + shScr, and 19 KO + shNrp1. One-way ANOVA (Kruskal-Wallis) with Dunn’s multiple comparison test. (E to G) Nrp1 induces laminar displacement through integrins. (E) WT animals were in utero electroporated at E14.5 with an internal ribosomal entry site–driven GFP construct, the same construct containing Nrp1 or with ItgB1DN as indicated. (F) GFP+ neurons in brain sections at E18.5. Scale bar, 100 μm. (G) Laminar distribution of GFP+ neurons. N = 7 control WT, 7 WT + Nrp1, and 9 WT + Nrp1 + ItgB1DN animals.
Fig. 6
Fig. 6. Zeb2 regulates the orientation and dendritic arborization of UL neurons.
(A) Zeb2fl/fl and littermate Zeb2fl/fl NexCre animals were in utero electroporated at E15.5 with GFP. (B) Representative images of GFP+ UL neurons showing the orientation of the dendritic tree with respect to the pia (marked by a dashed line) at P23. Arrowheads mark the axon. Scale bars, 50 μm. (C) Tracings of P23 GFP+ WT and KO neurons. The dashed line indicates the position of the pia. Apical dendrites are shaded green. Arrows indicate orientation of the apical dendrite. Scale bar, 50 μm. (D) Proportion of cells with aberrant orientation at P23. N = 65 cells per condition. (E) Average length of the apical dendrite at P23. N = 65 cells per condition. Welch’s t test. (F to H) Sholl analysis of the complexity of the dendritic arbor of WT (Zeb2fl/fl) and KO (Zeb2fl/fl NexCre) neurons at P23. (F) Sholl curve showing the number of dendritic intersections at increasing distance from the soma. N = 30 neurons, 10 neurons from three different animals per condition. Unpaired t test with Welch’s correction. (G) Average number of dendritic intersections per cell. Mann-Whitney test. (H) Average number of primary dendrites per cell. Unpaired t test with Welch’s correction.
Fig. 7
Fig. 7. Zeb2 regulates neuronal orientation independently of Nrp1.
(A and B) Zeb2 regulates neuronal orientation from P2. (A) IUE of Zeb2fl/fl and Zeb2fl/fl NexCre littermate animals with GFP at E15.5. (B) GFP+ neurons were analyzed at different time points. Arrowheads indicate aberrantly oriented neurons. Scale bars, 50 μm. (C) Deviation of the apical dendrite. N = 40, 36, 33, and 65 Zeb2fl/fl and 33, 56, 22, and 65 Zeb2fl/fl NexCre neurons at E18.5, P2, P7, and P23, respectively. Mann-Whitney test. (D to I) Nrp1 regulates dendritic complexity but not neuronal orientation. (D) IUE of Zeb2fl/fl animals at E15.5 with shScr, Cre, or shNrp1 as indicated. (E) Traces of GFP+ neurons at P23. Apical dendrites are shaded green. Arrows indicate orientation of the apical dendrite. Scale bars, 50 μm. (F and G) Sholl analysis at P23. N = 30 Zeb2fl/fl + shScr cells (from five animals), 39 Zeb2fl/fl + Cre + shScr (six animals), and 30 Zeb2fl/fl + Cre + shNrp1 (seven animals). (F) Average number of dendritic intersections per cell. One-way ANOVA with Bonferroni’s multiple comparison test. (G) Dendritic complexity at P23. Unpaired Student’s t test. (H) Representative GFP+ neurons at P23. (I) Deviation of the apical dendrite. N = 143 Zeb2fl/fl + shScr (five animals), 49 Zeb2fl/fl + Cre + shScr (six animals), and 64 Zeb2fl/fl + Cre + shNrp1 neurons (seven animals). One-way ANOVA (Kruskal-Wallis) with Dunn’s multiple comparison tests.
Fig. 8
Fig. 8. Cdh6 regulates adhesion downstream of Zeb2.
(A) ISH for Cdh6 in E15.5 Zeb2fl/fl and Zeb2fl/fl NexCre brains. Scale bar, 50 μm. (B to E) Up-regulation and redistribution of Cdh6 protein upon loss of Zeb2. E14.5 Zeb2fl/fl and Zeb2fl/fl NexCre animals were in utero electroporated with GFP and stained for Cdh6 (magenta) at E18.5 (B) and P2 (D). Cdh6 intensity at P2 is shown as a heatmap and gray plot. Scale bar, 50 μm. (C and E) Ratio of Cdh6 in layer I (a) versus CP (b) at E18.5 (C) and P2 (E). N = 3 brains per condition. Unpaired t test. (F) ChIP from E15.5 neocortex shows Zeb2 occupancy at Cdh6 regulatory regions. Red lines mark analyzed sites. Positive control = Ntf3 (fig. S9). (G and H) Cdh6 promotes cell adhesion downstream of Zeb2. (G) Aggregation of E15.5 Zeb2fl/fl and Zeb2fl/fl NexCre neurons transfected with shScr, shCdh6, and Cre as indicated. Scale bar, 100 μm. (H) Average aggregate size. N = 15, 10, and 7 Zeb2fl/fl + shScr; 12, 12, and 15 Zeb2fl/fl NexCre + shScr; and 9, 7, and 4 Zeb2fl/fl NexCre + shCdh6 aggregates at 0, 30, and 60 min. (I and J) Cdh6 regulates adhesion to the extracellular matrix downstream of Zeb2. (I) Attachment of Zeb2fl/fl neurons, transfected with shScr, shCdh6, or Cre as indicated, to laminin-coated surfaces. Adhering cells were visualized after 2 hours by F-actin staining. Scale bar, 15 μm. (J) Lamellipodial spreading. N = 21 Zeb2fl/fl + shScr, 36 Zeb2fl/fl NexCre + shScr, and 41 Zeb2fl/fl NexCre + shCdh6 cells. One-way ANOVA (Kruskal-Wallis test) with Dunn’s multiple comparison test (H and J).
Fig. 9
Fig. 9. Cdh6 regulates apical dendrite orientation downstream of Zeb2.
(A) Zeb2fl/fl animals were in utero electroporated at E15.5 with GFP, Cre, shScr, or shCdh6 as indicated. (B) Representative images of GFP+ neurons in brain slices at P23. The apical dendrite is marked by a fine parallel tracing; the pia is marked by a thicker dashed line. Scale bar, 50 μm. (C) Tracings of 10 apical dendrites per condition showing their orientation with respect to the pia. Apical dendrites were superimposed so that all deviations face the right-hand side of the image. Scale bar, 50 μm. (D) Average deviation of the apical dendrite. N = 143 Zeb2fl/fl + shScr cells (seven animals), 57 Zeb2fl/fl NexCre + Cre cells (five animals), and 85 Zeb2fl/fl NexCre + shCdh6 cells (four animals). One-way ANOVA (Kruskal-Wallis test) with Dunn’s multiple comparison test.
Fig. 10
Fig. 10. A balance of Cdh6 signaling regulates neuronal orientation.
(A to C) Cdh6 regulates neuronal orientation through its RGD motif. (A) WT E15.5 animals were in utero electroporated with Cdh6 or an RGD mutant of Cdh6 (Cdh6-RGDmut). (B) GFP+ neurons at P23. Scale bar, 50 μm. (C) Tracings of 10 apical dendrites showing their orientation with respect to the pia. Apical dendrites were superimposed to face the right-hand side of the image. Scale bar, 50 μm. (D to F) Cdh6 is necessary for neuronal orientation. (D) E15.5 WT animals were in utero electroporated with shScr or shCdh6. (E) GFP+ neurons at P23. Scale bar, 50 μm. (F) Tracings of 10 apical dendrites per condition. Scale bar, 50 μm. (G) Average deviation of the apical dendrite for experiments (A to F). N = 25 Cdh6 + shScr cells (from three animals), 53 Cdh6-RGDmut + shScr cells (four animals), 31 shScr cells (seven animals), and 66 shCdh6 cells (five animals). One-way ANOVA (Kruskal-Wallis test) with Dunn’s multiple comparison test. (H) Zeb2 shapes neocortical cytoarchitecture by regulating adhesion at distinct time points of development through repression of Nrp1 and Cdh6. Repression of Nrp1 and downstream integrin signaling by Zeb2 promotes multipolar-bipolar transition and initiation of radial migration. Following migration, Zeb2 regulates Cdh6 expression for correct neuronal orientation. Subsequently, Zeb2 determines dendritic complexity through repression of Nrp1.

References

    1. Petreanu L., Mao T., Sternson S. M., Svoboda K., The subcellular organization of neocortical excitatory connections. Nature 457, 1142–1145 (2009). - PMC - PubMed
    1. Schuster S., Rivalan M., Strauss U., Stoenica L., Trimbuch T., Rademacher N., Parthasarathy S., Lajkó D., Rosenmund C., Shoichet S. A., Winter Y., Tarabykin V., Rosário M., NOMA-GAP/ARHGAP33 regulates synapse development and autistic-like behavior in the mouse. Mol. Psychiatry 20, 1120–1131 (2015). - PubMed
    1. Rosario M., Schuster S., Juttner R., Parthasarathy S., Tarabykin V., Birchmeier W., Neocortical dendritic complexity is controlled during development by NOMA-GAP-dependent inhibition of Cdc42 and activation of cofilin. Genes Dev. 26, 1743–1757 (2012). - PMC - PubMed
    1. Kaufmann W. E., Moser H. W., Dendritic anomalies in disorders associated with mental retardation. Cereb. Cortex 10, 981–991 (2000). - PubMed
    1. Nadarajah B., Brunstrom J. E., Grutzendler J., Wong R. O., Pearlman A. L., Two modes of radial migration in early development of the cerebral cortex. Nat. Neurosci. 4, 143–150 (2001). - PubMed