. 2021 Jul 2;11(7):e048874.
doi: 10.1136/bmjopen-2021-048874.

India's pragmatic vaccination strategy against COVID-19: a mathematical modelling-based analysis

Affiliations

India's pragmatic vaccination strategy against COVID-19: a mathematical modelling-based analysis

Sandip Mandal et al. BMJ Open. .

Abstract

Objectives: To investigate the impact of targeted vaccination strategies on morbidity and mortality due to COVID-19, as well as on the incidence of SARS-CoV-2, in India.

Design: Mathematical modelling.

Settings: Indian epidemic of COVID-19 and vulnerable population.

Data sources: Country-specific and age-segregated pattern of social contact, case fatality rate and demographic data obtained from peer-reviewed literature and public domain.

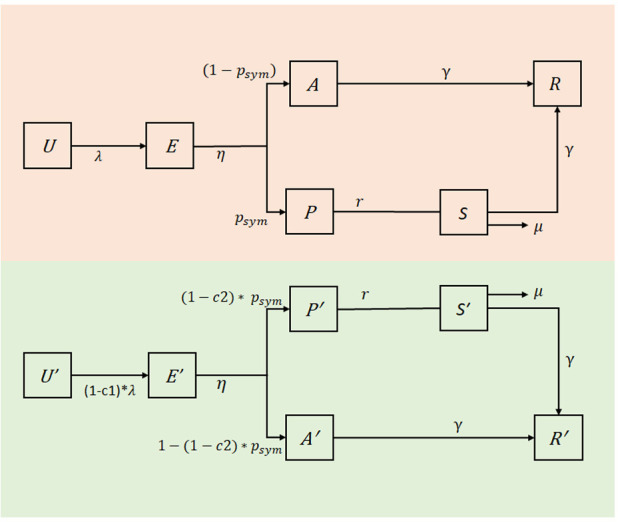
Model: An age-structured dynamical model describing SARS-CoV-2 transmission in India incorporating uncertainty in natural history parameters was constructed.

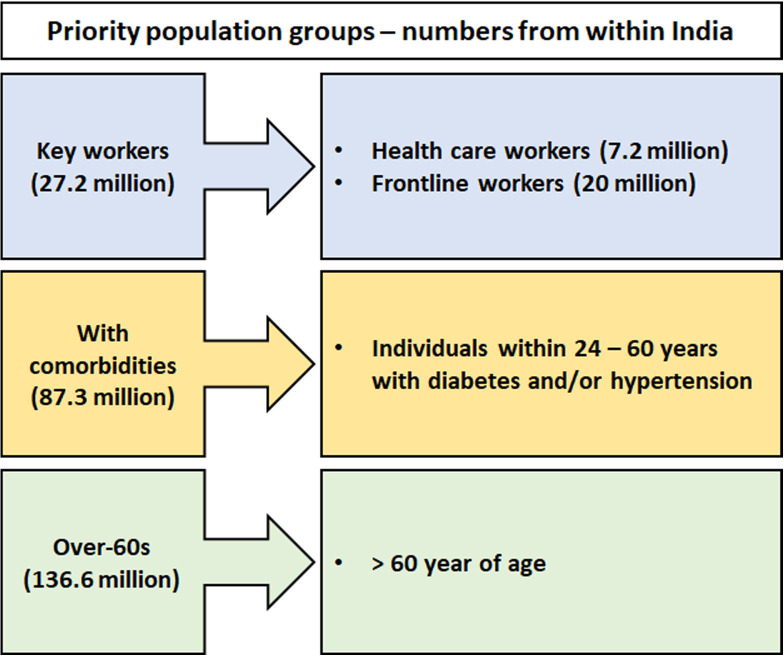
Interventions: Comparison of different vaccine strategies by targeting priority groups such as keyworkers including healthcare professionals, individuals with comorbidities (24-60 years old) and all above 60.

Main outcome measures: Incidence reduction and averted deaths in different scenarios, assuming that the current restrictions are fully lifted as vaccination is implemented.

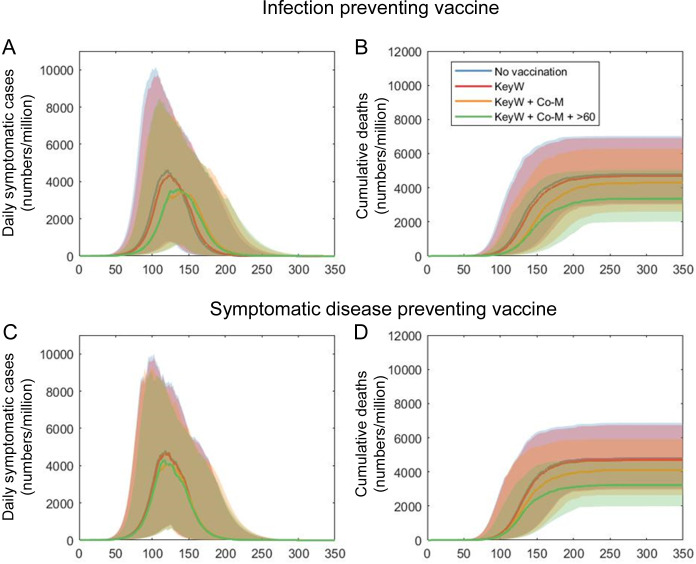
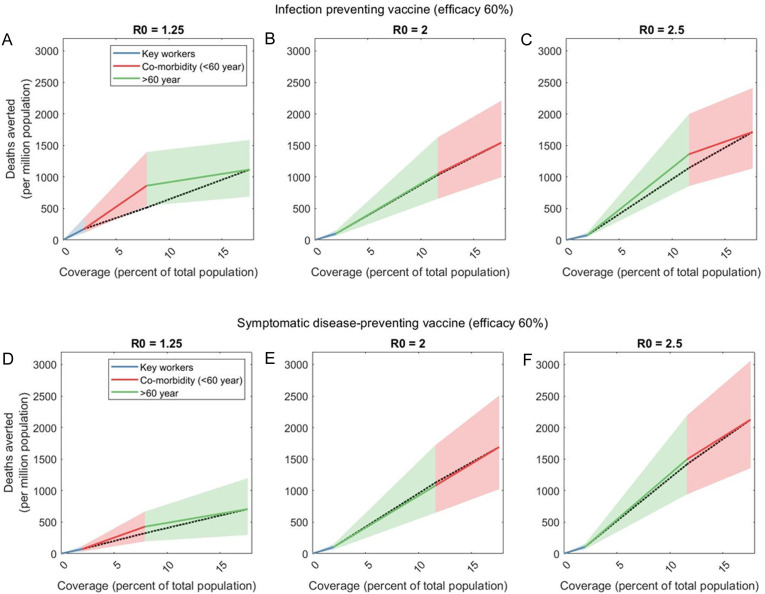
Results: The priority groups together account for about 18% of India's population. An infection-preventing vaccine with 60% efficacy covering all these groups would reduce peak symptomatic incidence by 20.6% (95% uncertainty intervals (UI) 16.7-25.4) and cumulative mortality by 29.7% (95% CrI 25.8-33.8). A similar vaccine with ability to prevent symptoms (but not infection) will reduce peak incidence of symptomatic cases by 10.4% (95% CrI 8.4-13.0) and cumulative mortality by 32.9% (95% CrI 28.6-37.3). In the event of insufficient vaccine supply to cover all priority groups, model projections suggest that after keyworkers, vaccine strategy should prioritise all who are >60 and subsequently individuals with comorbidities. In settings with weakest transmission, such as sparsely populated rural areas, those with comorbidities should be prioritised after keyworkers.

Conclusions: An appropriately targeted vaccination strategy would witness substantial mitigation of impact of COVID-19 in a country like India with wide heterogeneity. 'Smart vaccination', based on public health considerations, rather than mass vaccination, appears prudent.

Keywords: COVID-19; epidemiology; health policy; public health.


Conflict of interest statement

Competing interests: None declared.

Figures

Figure 1
Figure 1
Priority groups of people in three different scenarios. Sources: healthcare workers (HCWs), frontline workers, those with diabetes and hypertension as comorbidities and those over 60 years of age. As described in the main text, when modelling vaccination coverage among essential workers, our focus is on the epidemiological impact of doing so (we do not address, eg, the potential impacts for healthcare continuity and of vaccination coverage in HCWs).
Figure 2
Figure 2
Illustration of the compartmental model structure. The top and bottom halves of the figure show unvaccinated and vaccinated subpopulations, respectively. Boxes represent compartments, and arrows represent flows between different stages of the clinical course of infection. Compartments are as follows: uninfected (U), exposed (E), asymptomatic but infectious (A), presymptomatic (P), symptomatic (S) and recovered and immune (R). The terms c1,c2 represent effectiveness of, respectively, an infection-preventing and symptomatic-disease-preventing vaccine. The term μ represents the per capita hazard of mortality; see online supplemental table 2 for a list of all other model parameters. This model structure is further stratified by age groups and by presence/absence of comorbidities.
Figure 3
Figure 3
Illustration of vaccine impact in each of the priority groups listed in figure 1. Scenarios are shown in the example of R0=2, assuming that vaccine coverage is completed at the same time as current restrictions being fully lifted. The upper row shows results for an infection-preventing vaccine, while the lower row shows results from a symptomatic-disease-preventing vaccine. Scenarios show vaccination coverage in different combinations of priority groups: keyworkers (‘KeyW’); additionally, including those with comorbidities (‘Co-M’); and, additionally, including those over 60 years of age (‘>60’). All horizontal axes show days after vaccination and restrictions being lifted. Solid lines show central (median) estimates, while shaded areas show 95% uncertainty intervals as estimated by sampling uniformly from the ranges shown in online supplemental table 2. The overall impact of vaccination in each of these scenarios is summarised in table 1, together with the amount of vaccines needed.
Figure 4
Figure 4
Optimal prioritisation strategies for an infection-preventing vaccine (A–C) and for a symptomatic-disease-preventing vaccine (D–F). For reference, dotted black lines in all plots show a ‘uniform’ strategy where available vaccines are allocated proportionately among the two risk groups, rather than prioritising one over the other (for clarity, uncertainty intervals are not shown for this scenario). For the plots (A–C), we assume deployment of a vaccine having 60% efficacy in reducing susceptibility to infection but no effect on development of symptoms following infection. Assuming keyworkers receive first priority, online supplemental figures 1 and 2 in the supporting information show different strategies for subsequently prioritising those over 60 years old versus those with comorbidities. Here, we show those strategies that are optimal for minimising the overall mortality, under different levels of vaccine coverage, and for different values of R0. For example, in the case R0=2, if initial vaccine supply is only enough to cover 10% of the population, then after covering keyworkers, these vaccines should be deployed preferentially among the over-60s (in green). If there is enough vaccine supply to cover 20% of the population, the optimal strategy would be to vaccinate the over-60s after keyworkers and spending any remaining vaccine supply among those with comorbidities. Similar priorities apply for R0=2.5. However, for low-transmission settings (R0=1.25), those with comorbidities would be prioritised over the elderly. For the plots (D–F), we assume deployment of a vaccine having 60% efficacy in reducing symptoms and mortality following infection but no preventive effect on acquiring infection. For such a vaccine, optimal prioritisation strategies are similar to those shown in the plots (A–C).

References

    1. Barclay W, Openshaw P. The 1918 influenza pandemic: one hundred years of progress, but where now? Lancet Respir Med 2018;6:588–9. 10.1016/S2213-2600(18)30272-8 - DOI - PubMed
    1. Alwan NA, Burgess RA, Ashworth S, et al. . Scientific consensus on the COVID-19 pandemic: we need to act now. Lancet 2020;396:e71–2. 10.1016/S0140-6736(20)32153-X - DOI - PMC - PubMed
    1. Gurdasani D, Bear L, Bogaert D, et al. . The UK needs a sustainable strategy for COVID-19. Lancet 2020;396:1800–1. 10.1016/S0140-6736(20)32350-3 - DOI - PMC - PubMed
    1. Burki TK. Double threat of COVID-19 and influenza. Lancet Respir Med 2020;8:e97. 10.1016/S2213-2600(20)30508-7 - DOI - PMC - PubMed
    1. Paterlini M. Covid:19: Italy has wasted the sacrifices of the first wave, say experts. BMJ 2020;371:m4279. 10.1136/bmj.m4279 - DOI - PubMed