. 2021 Sep 1;81(17):4499-4513.
doi: 10.1158/0008-5472.CAN-20-4016. Epub 2021 Jul 2.

Nonsense-Mediated RNA Decay Is a Unique Vulnerability of Cancer Cells Harboring SF3B1 or U2AF1 Mutations

Affiliations

Nonsense-Mediated RNA Decay Is a Unique Vulnerability of Cancer Cells Harboring SF3B1 or U2AF1 Mutations

Abigael Cheruiyot et al. Cancer Res. .

Abstract

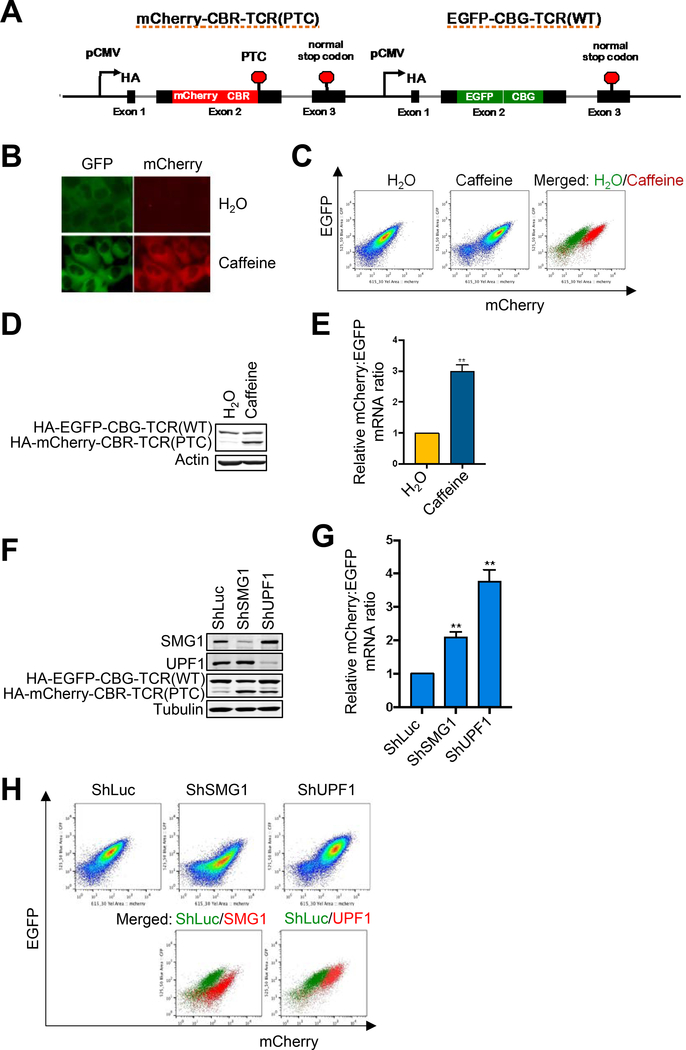
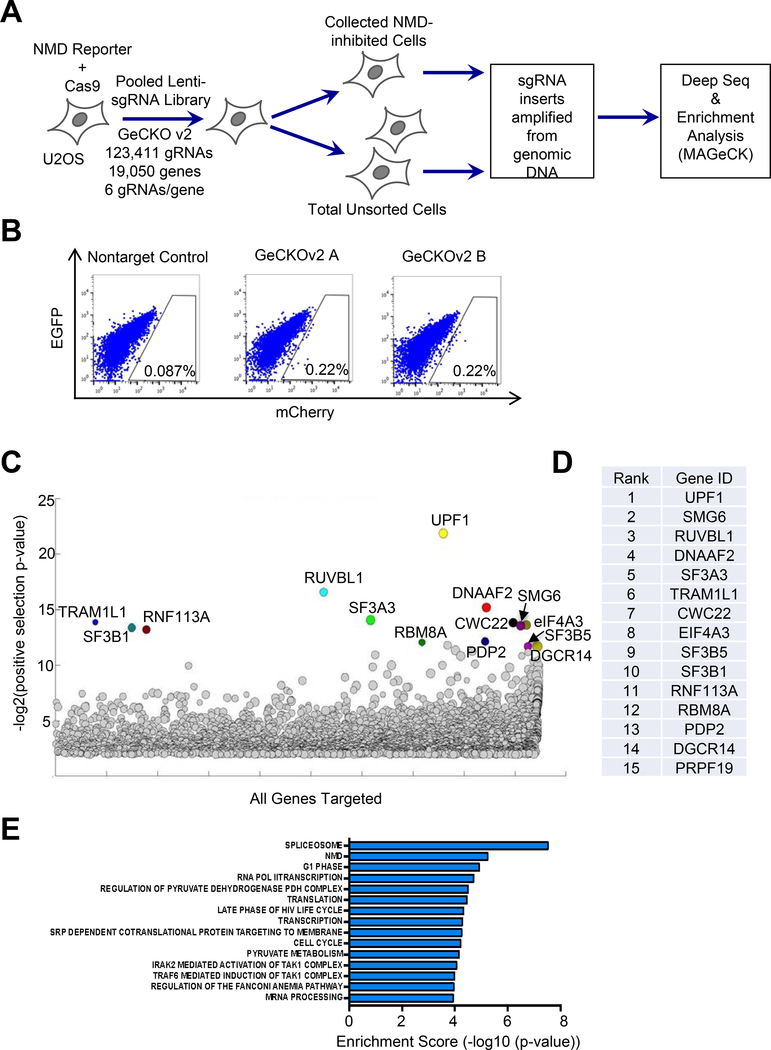
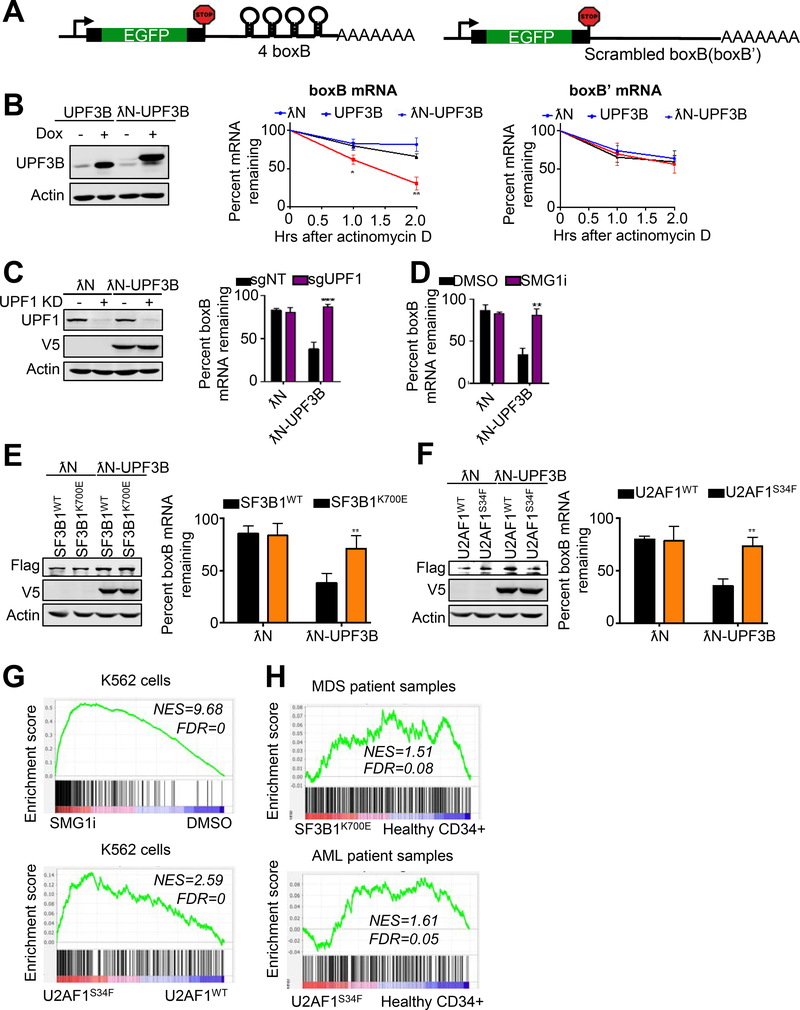
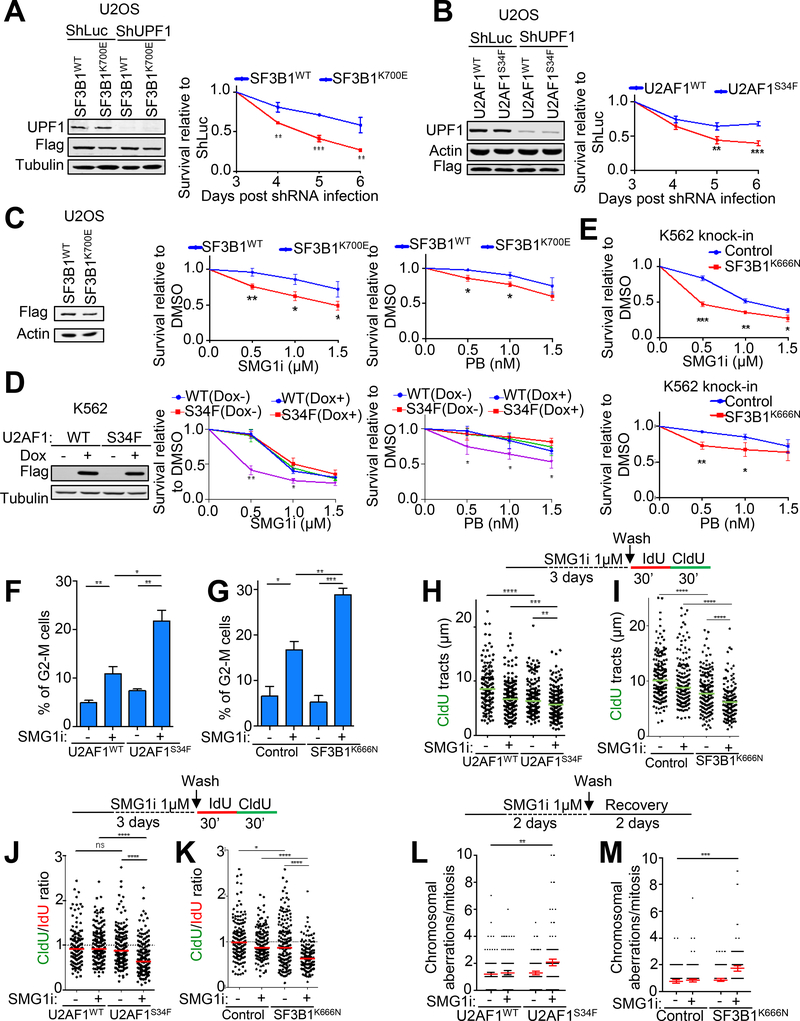
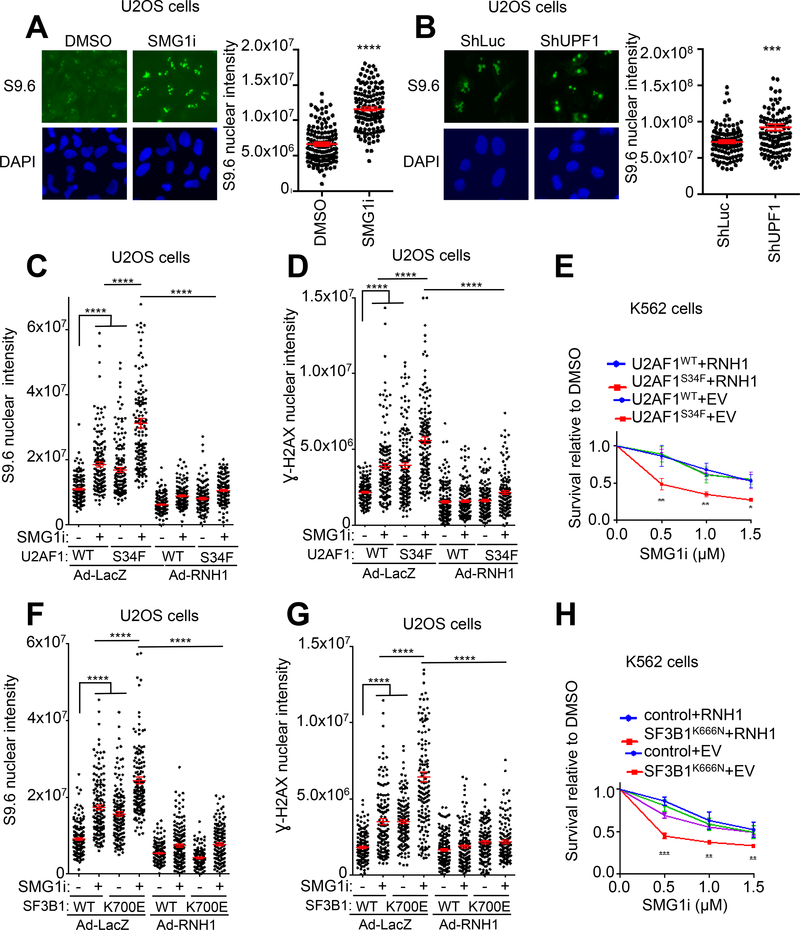
Nonsense-mediated RNA decay (NMD) is recognized as an RNA surveillance pathway that targets aberrant mRNAs with premature translation termination codons (PTC) for degradation, however, its molecular mechanisms and roles in health and disease remain incompletely understood. In this study, we developed a novel reporter system to accurately measure NMD activity in individual cells. A genome-wide CRISPR-Cas9 knockout screen using this reporter system identified novel NMD-promoting factors, including multiple components of the SF3B complex and other U2 spliceosome factors. Interestingly, cells with mutations in the spliceosome genes SF3B1 and U2AF1, which are commonly found in myelodysplastic syndrome (MDS) and cancers, have overall attenuated NMD activity. Compared with wild-type (WT) cells, SF3B1- and U2AF1-mutant cells were more sensitive to NMD inhibition, a phenotype that is accompanied by elevated DNA replication obstruction, DNA damage, and chromosomal instability. Remarkably, the sensitivity of spliceosome mutant cells to NMD inhibition was rescued by overexpression of RNase H1, which removes R-loops in the genome. Together, these findings shed new light on the functional interplay between NMD and RNA splicing and suggest a novel synthetic lethal strategy for the treatment of MDS and cancers with spliceosome mutations. SIGNIFICANCE: This study has developed a novel NMD reporter system and identified a potential therapeutic approach of targeting the NMD pathway to treat cancer with spliceosome gene mutations.


Conflict of interest statement

Conflict of interest statement: The authors declare no competing financial interests. JMB is an employee of, and holds stock in, Amgen, Inc.

Figures

Figure 1.
Figure 1.. A new reporter system for analyzing NMD in individual human cells.
A. Schematic diagram of a multicolored, fluorescence- and bioluminescence-based NMD reporter. B. Fluorescence imaging of the NMD reporter in U2OS reporter cells after treatment with H2O or caffeine (10 mM) for 24 hrs. C. FACS analysis of U2OS reporter cells treated with H2O or caffeine (10 mM) for 24 hrs. In the merged panel, green dots are H2O-treated cells whereas red dots are caffeine-treated cells. D. Western blot of the protein products (HA-tagged) of the NMD reporter after 24-hr treatment of U2OS reporter cells with H2O or caffeine (10 mM). E. Ratios of mCherry-containing reporter mRNA to EGFP-containing reporter mRNA in U2OS reporter cells treated with H2O or caffeine (10 mM) for 24 hrs. The mCherry/EGFP mRNA ratio of the H2O control was normalized to 1. Data represent the mean ± SD of three independent experiments. **p ≤ 0.01 (paired t-test). F. Western blot of the protein products of the NMD reporter in U2OS reporter cells after shRNA-mediated knockdown of SMG1 or UPF1. G. Ratio of mCherry-containing reporter mRNA to EGFP-containing reporter mRNA in U2OS reporter cells after shRNA-mediated knockdown of SMG1 or UPF1. The mCherry/EGFP mRNA ratio of the shLuc control was normalized to 1. Data represent the mean ± SD of three independent experiments. **p ≤ 0.01 (paired t-test). H. FACS analysis of U2OS reporter cells after shRNA-mediated knockdown of SMG1 or UPF1. In the merged figure, green dots represent control shLuc cells, and red dots represent shSMG1 or shUPF1 samples.
Figure 2.
Figure 2.. A genome-wide CRISPR/Cas9 knockout screen to identify novel NMD factors and regulators.
A. Workflow of the CRISPR/Cas9 knockout screen. B. FACS analysis of Cas9-expressing U2OS reporter cells infected with the two GeCKOv2 sgRNA sub-libraries, or a non-targeting sgRNA control. The gating represents the collected cell population with attenuated NMD activity. C. A bubble plot showing results of gene enrichment analysis obtained from MAGeCK analysis. The bubble size represents the number of gRNAs enriched for the target gene. D. The list of top 15 gene hits as ranked by MAGeCK analysis. E. Gene Set Enrichment Analysis (GSEA) analysis of the ranked gene list.
Figure 3.
Figure 3.. NMD activity is attenuated in cells with SF3B1 and U2AF1 mutations
A. A schematic of a tethering reporter that recapitulates NMD in human cells. The 3’ UTR of the reporter construct contains 4 boxB sites. A reporter with scrambled boxB (boxB’) sequences in the 3’ UTR was used as a control. B. Left, western blot analysis of UPF3B or λN-UPF3B proteins (both V5-tagged) after induction with doxycycline (1 ug/ml). Right, stability of EGFP-boxB or EGFP-boxB’ reporter mRNA in cells expressing λN, UPF3B, or λN-UPF3B. RNA decay analysis was performed by measuring RNA before and after actinomycin D treatment. Percent mRNA remaining was calculated as the mRNA remaining as a percent of RNA before actinomycin D treatment. Data represent the mean ± SD of three independent experiments. **p ≤ 0.01, *p ≤ 0.05 (unpaired t-test). C. Left, western blot analysis of UPF1 knockdown and λN-UPF3B induction in cells expressing the boxB reporter mRNA. Right, effects of UPF1 knockdown on the stability of EGFP-boxB reporter mRNA in cells expressing λN or λN-UPF3B. Percent mRNA remaining was calculated as the mRNA remaining as a percent of RNA before the 2-hour actinomycin D treatment. Data represent the mean ± SD of three independent experiments. ***p ≤ 0.001 (unpaired t-test). D. RNA decay analysis of EGFP-boxB reporter mRNA in λN- or λN-UPF3B expressing cells after treatment with DMSO or SMG1i (1 μM). Percent mRNA remaining was calculated as the mRNA remaining as a percent of RNA before the 2-hour actinomycin D treatment. Data represent the mean ± SD of three independent experiments. **p ≤ 0.01 (unpaired t-test). E-F. Left, western blot analysis of λN-UPF3B in EGFP-boxB reporter cells expressing Flag-tagged SF3B1WT/K700E (E) or U2AF1WT/S34F (F). Right, effects of SF3B1WT/K700E or U2AF1WT/S34F overexpression on the stability of EGFP-boxB reporter mRNA in cells in the presence of λN-UPF3B. Percent mRNA remaining was calculated as the mRNA remaining as a percent of RNA before the 2-hour actinomycin D treatment. Data represent the mean ± SD of three independent experiments. **p ≤ 0.01 (unpaired t-test). G. Gene Set Enrichment Analysis (GSEA) enrichment score plots for NMD target genes that are upregulated by UPF1 knockdown. We curated a list of NMD target genes that were upregulated following UPF1 knockdown in Longman et al. (40) The NMD target genes were upregulated in K562 cells treated with a SMG1 inhibitor (top) or K562 cells expressing mutant U2AF1(S34F) (bottom). Individual genes in the NMD target gene set are represented by a black vertical bar at the bottom of the plot H. Gene Set Enrichment Analysis (GSEA) enrichment score plots for NMD target genes that are upregulated by UPF1 knockdown. The NMD target genes curated based on the effects of UPF1 knockdown were upregulated in MDS patient samples expressing mutant SF3B1(K700E) (top, analysis of MDS data in Pellagatti et al. (39)) and AML patient samples expressing mutant U2AF1(S34F) (bottom). Individual genes in the NMD target gene set are represented by a black vertical bar at the bottom of the plot.
Figure 4.
Figure 4.. Cells expressing mutant spliceosome factors are sensitive to NMD inhibition.
A-B. Left, western blot analysis of UPF1 knockdown in U2OS cells expressing Flag-tagged SF3B1WT/K700E (A) or U2AF1WT/S34F (B). Right, effects of UPF1 knockdown on the viability of U2OS cells expressing SF3B1WT/K700E (A) or U2AF1WT/S34F (B). Data represent the mean ± SD of three independent experiments. ***p ≤ 0.001; **p ≤ 0.01 (unpaired t-test). C. Left, western blot analysis of Flag-tagged SF3B1WT or SF3B1K700E overexpression in U2OS cells. Middle and right, effects of SMG1i or PB treatment (3 days) on the viability of U2OS cells expressing SF3B1WT or SF3B1K700E. Data represent the mean ± SD of three independent experiments. **p ≤ 0.01; *p ≤ 0.05 (unpaired t-test). D. Left, western blot analysis of inducible expression of Flag-tagged U2AF1WT or U2AF1S34F in K562 cells. Middle and right, effects of SMG1i or PB treatment (3 days) on the viability of K562 cells expressing U2AF1WT or U2AF1S34F. Data represent the mean ± SD of three independent experiments. **p ≤ 0.01; *p ≤ 0.05 (unpaired t-test). E. Effects of SMG1i (top) or PB treatment (bottom) (3 days) on the viability of K562 cells with or without SF3B1K666N knock-in mutation. Data represent the mean ± SD of three independent experiments. ***p ≤ 0.001; **p ≤ 0.01; *p ≤ 0.05 (unpaired t-test). F-G. Effects of SMG1i treatment (1 μM, 3 days) on the G2-M population of the K562 cells expressing U2AF1WT/S34F (F) or K562 cells with or without SF3B1K666N knock-in mutation (G). Data represent the mean ± S.E.M of three independent experiments. ***p ≤ 0.001; **p ≤ 0.01; *p ≤ 0.05 (unpaired t-test). H-K. Effects of SMG1i treatment (1 μM, 3 days) on DNA replication speed (H, I) or fork progression (J, K) in K562 cells expressing U2AF1WT/S34F (H, J) or K562 cells with or without SF3B1K666N knock-in mutation (I, K). Upper, experimental scheme for DNA fiber assay. Lower, distribution of CldU tract lengths or CIdU/IdU ratio. Green or red bars represent the median ± S.E.M of two independent experiments. A total of 150 tracts analyzed per sample. ****p ≤ 0.0001; ***p ≤ 0.001; **p ≤ 0.01 (Mann Whitney test). L-M. Effects of SMG1i treatment (1 μM, 2 days followed by 2 days of recovery) on chromosomal integrity in K562 cells expressing U2AF1WT/S34F (L) or K562 cells with or without SF3B1K666N knock-in mutation (M). Upper, experimental scheme. Lower, distribution of chromosomal aberrations per mitosis. Red bars represent the mean ± S.E.M of two independent experiments. A total of 150 metaphases analyzed per sample. **p ≤ 0.01 (Mann Whitney test).
Figure 5.
Figure 5.. Elevated R-loop formation is a major underlying mechanism for the hypersensitivity of spliceosome mutant cells to NMD inhibition
A. Effects of SMG1i treatment on R-loops. U2OS cells were treated with SMG1i (5 μM) for 24 hours and then immunofluorescence was performed to detect nuclear S9.6 signal. Left, representative images showing nuclear signal of S9.6. Right, Quantification of nuclear S9.6 signal. Red bars represent the mean ± S.E.M of two independent experiments. A total of 130 nuclei analyzed per sample. ****p ≤ 0.0001 (Mann Whitney test). B. Effects of shRNA-mediated knockdown of UPF1 on R-loops. U2OS cells were infected with shLuc- or shUPF1-expressing lentiviruses and then incubated for 5 days. R-loops in the nucleus were detected by immunofluorescence staining using the S9.6 antibody. Left, representative images showing nuclear signal of S9.6. Right, Quantification of nuclear S9.6 signal. Red bars represent the mean ± S.E.M of two independent experiments. A total of 130 nuclei analyzed per sample. ***p ≤ 0.001 (Mann Whitney test). C. Effects of RNH1 expression on R-loops in SMG1i-treated cells expressing U2AF1WT or U2AF1S34F. U2OS cells stably expressing U2AF1WT or U2AF1S34F were infected with adenovirus expressing LacZ control or RNH1 and then treated with SMG1i (1 μM) for 3 days. R-loops in the nucleus were detected by immunofluorescence staining using the S9.6 antibody. Red bars represent the mean ± S.E.M of two independent experiments. A total of 150 nuclei analyzed per sample. ****p ≤ 0.0001 (Mann Whitney test). D. Effects of SMG1i treatment on γH2AX in cells expressing U2AF1WT or U2AF1S34F. U2OS stably expressing U2AF1WT or U2AF1S34F Cells were infected with adenovirus expressing lacZ control or RNH1 and then treated with SMG1i (1 μM) for 3 days. γH2AX levels were detected by immunofluorescence staining. Red bars represent the mean ± S.E.M of two independent experiments. A total of 150 nuclei analyzed per sample. ****p ≤ 0.0001 (Mann Whitney test). E. Effects of SMG1i treatment (3 days) on the viability of K562 cells stably expressing empty vector (EV)/RNH1 after induction of U2AF1WT or U2AF1S34F. Data represent the mean ± SD of three independent experiments. **p ≤ 0.01; *p ≤ 0.05 (unpaired t-test). F. Effects of RNH1 expression on R-loops in SMG1i-treated cells expressing SF3B1WT or SF3B1K700E. U2OS cells stably expressing SF3B1WT or SF3B1K700E were infected with adenovirus expressing lacZ control or RNH1 and then treated with SMG1i (1 μM) for 3 days. R-loops in the nucleus were detected by immunofluorescence staining using the S9.6 antibody. Red bars represent the mean ± S.E.M of two independent experiments. A total of 150 nuclei analyzed per sample. ****p ≤ 0.0001 (Mann Whitney test). G. Effects of RNH1 expression on γH2AX in SMG1i-treated cells expressing SF3B1WT or SF3B1K700E. U2OS cells stably expressing SF3B1WT or SF3B1K700E were infected with adenovirus expressing lacZ control or RNH1 and then treated with SMG1i (1 μM) for 3 days. γH2AX levels were detected by immunofluorescence staining. Red bars represent the mean ± S.E.M of two independent experiments. A total of 130 nuclei analyzed per sample. ****p ≤ 0.0001 (Mann Whitney test). H. Effects of RNH1 expression on the viability of wild type or SF3B1K666N knock-in K562 cells treated with SMG1i. Wild type or SF3B1K666N knock-in K562 cells were infected with lentiviruses expressing empty vector (EV) control or RNH1 and then treated with SMG1i for 3 days. Data represent the mean ± SD of three independent experiments. ***p ≤ 0.001; **p ≤ 0.01; *p ≤ 0.05 (unpaired t-test).

References

    1. Keren H, Lev-Maor G, Ast G. Alternative splicing and evolution: diversification, exon definition and function. Nat Rev Genet 2010;11:345–55. - PubMed
    1. Wang ET, Sandberg R, Luo S, Khrebtukova I, Zhang L, Mayr C, et al.Alternative isoform regulation in human tissue transcriptomes. Nature 2008;456:470–6. - PMC - PubMed
    1. Maquat LE, Kinniburgh AJ, Beach LR, Honig GR, Lazerson J, Ershler WB, et al.Processing of human beta-globin mRNA precursor to mRNA is defective in three patients with beta+-thalassemia. Proc Natl Acad Sci U S A 1980;77:4287–91. - PMC - PubMed
    1. Busslinger M, Moschonas N, Flavell RA. Beta + thalassemia: aberrant splicing results from a single point mutation in an intron. Cell 1981;27:289–98. - PubMed
    1. Niblock M, Gallo J-M. Tau alternative splicing in familial and sporadic tauopathies. Biochem Soc Trans 2012;40:677–80. - PubMed

Publication types