. 2021 Aug 15;81(16):4205-4217.
doi: 10.1158/0008-5472.CAN-21-0086. Epub 2021 Jul 2.

Genetic Determinants of Somatic Selection of Mutational Processes in 3,566 Human Cancers

Affiliations

Genetic Determinants of Somatic Selection of Mutational Processes in 3,566 Human Cancers

Jintao Guo et al. Cancer Res. .

Abstract

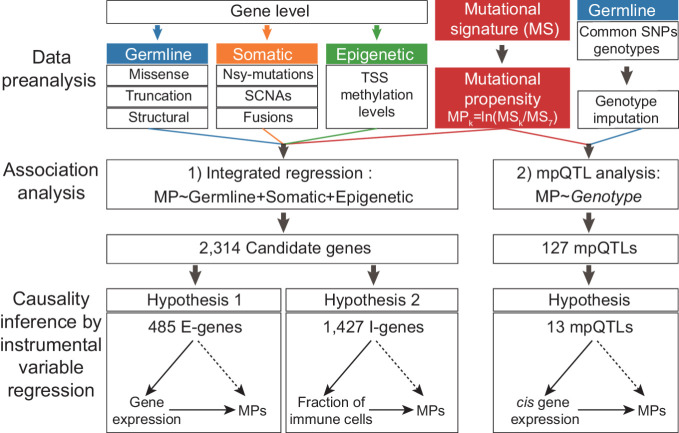
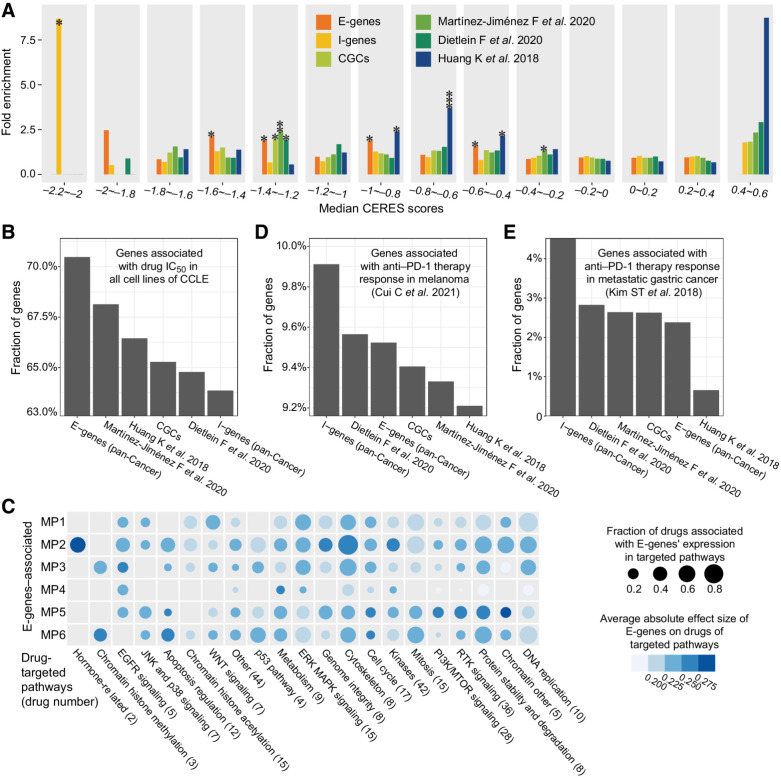
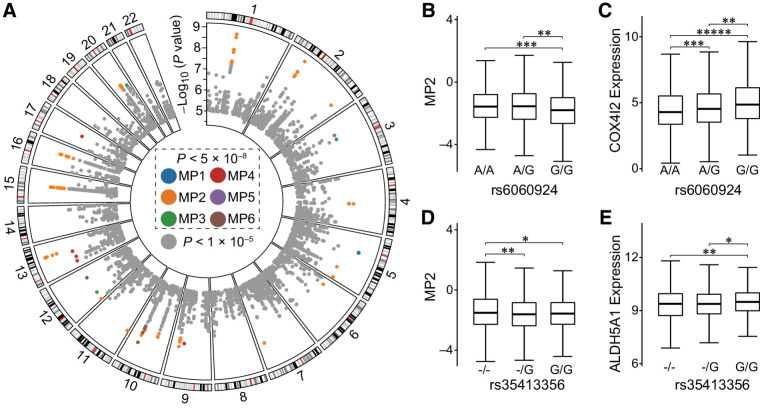
The somatic landscape of the cancer genome results from different mutational processes represented by distinct "mutational signatures." Although several mutagenic mechanisms are known to cause specific mutational signatures in cell lines, the variation of somatic mutational activities in patients, which is mostly attributed to somatic selection, is still poorly explained. Here, we introduce a quantitative trait, mutational propensity (MP), and describe an integrated method to infer genetic determinants of variations in the mutational processes in 3,566 cancers with specific underlying mechanisms. As a result, we report 2,314 candidate determinants with both significant germline and somatic effects on somatic selection of mutational processes, of which, 485 act via cancer gene expression and 1,427 act through the tumor-immune microenvironment. These data demonstrate that the genetic determinants of MPs provide complementary information to known cancer driver genes, clonal evolution, and clinical biomarkers. SIGNIFICANCE: The genetic determinants of the somatic mutational processes in cancer elucidate the biology underlying somatic selection and evolution of cancers and demonstrate complementary predictive power across cancer types.


Figures

Figure 1. The schematic view of this study. In this study, we introduced the quantitative trait of MP, which is tethered to the relative activity between a given signature and a reference signature. Then, we described a regression model integrating evidences from both germline and somatic levels to identify the genetic determinants of somatic selection of mutational processes and also performed mpQTL analysis for MP-associated loci. In addition, we inferred the causal biological mechanisms for the candidate determinants of the mutational processes via cancer gene expression and TIME.
Figure 1.
The schematic view of this study. In this study, we introduced the quantitative trait of MP, which is tethered to the relative activity between a given signature and a reference signature. Then, we described a regression model integrating evidences from both germline and somatic levels to identify the genetic determinants of somatic selection of mutational processes and also performed mpQTL analysis for MP-associated loci. In addition, we inferred the causal biological mechanisms for the candidate determinants of the mutational processes via cancer gene expression and TIME.
Figure 2. The mutational propensities in thirteen cancer types. A, The conserved MSs based on 5-nucleotide context are correlated with COMISC single-base substitution signatures. B, The quantile–quantile plot shows the abnormal distribution of the MSs at pan-cancer level. C, The quantile–quantile plot shows the quasi-normal distribution of the MPs at pan-cancer level. D, The MPs of each individual in different TCGA cancer types. Each bar represents an individual. The cancer types are ranked from left to right in the order of increased median TMB. In each cancer type, the individuals are ranked from left to the right in the order of decreased activities of the MS7. Different colors represent different MPs. E, The MP and the MS activities show consistent effects (Spearman correlation) on TMB. The effect sizes are calculated as Spearman rho between MP or MS and TMB. F, The MP and the MS activities show consistent effects (Spearman correlation) on ITH. The effect sizes are calculated as Spearman rho between MP or MS and TMB. G, The MPs are highly consistent between TCGA cancer tissues and CCLE cancer cell lines representing the same cancer types.
Figure 2.
The mutational propensities in thirteen cancer types. A, The conserved MSs based on 5-nucleotide context are correlated with COMISC single-base substitution signatures. B, The quantile–quantile plot shows the abnormal distribution of the MSs at pan-cancer level. C, The quantile–quantile plot shows the quasi-normal distribution of the MPs at pan-cancer level. D, The MPs of each individual in different TCGA cancer types. Each bar represents an individual. The cancer types are ranked from left to right in the order of increased median TMB. In each cancer type, the individuals are ranked from left to the right in the order of decreased activities of the MS7. Different colors represent different MPs. E, The MP and the MS activities show consistent effects (Spearman correlation) on TMB. The effect sizes are calculated as Spearman rho between MP or MS and TMB. F, The MP and the MS activities show consistent effects (Spearman correlation) on ITH. The effect sizes are calculated as Spearman rho between MP or MS and TMB. G, The MPs are highly consistent between TCGA cancer tissues and CCLE cancer cell lines representing the same cancer types.
Figure 3. Genes' genetic statuses influence the mutational propensities. A, The fraction of variance (adjusted R2) of 6 MPs explained by different statuses of genes (FDR < 0.1), including three types of germline variations (missense, truncated, structural), four types of somatic alterations (somatic nsy-mutation, SCNA, fusion), and epigenetic stats (TSS-methylation). The benchmark genes with different colors are the known cancer driver genes, of which, germline or somatic mutations are associated with the certain MSs. B, The Upset plot shows the overlaps among the gene sets, each of which is significantly associated with the MPs by a distinct genetic status. The black bar shows the total 2,314 unique genes, which are considered as candidate genes, of which, germline genetic burden and somatic or epigenetic status are simultaneously significantly associated with the same MP (FDR < 0.1). C, The number of significant genes, of which, genetic statuses impact the MPs at pan-cancer level or cancer-specific level. D, The number of significant genes, of which, genetic statuses associate with one or multiple MPs.
Figure 3.
Genes' genetic statuses influence the mutational propensities. A, The fraction of variance (adjusted R2) of 6 MPs explained by different statuses of genes (FDR < 0.1), including three types of germline variations (missense, truncated, structural), four types of somatic alterations (somatic nsy-mutation, SCNA, fusion), and epigenetic stats (TSS-methylation). The benchmark genes with different colors are the known cancer driver genes, of which, germline or somatic mutations are associated with the certain MSs. B, The Upset plot shows the overlaps among the gene sets, each of which is significantly associated with the MPs by a distinct genetic status. The black bar shows the total 2,314 unique genes, which are considered as candidate genes, of which, germline genetic burden and somatic or epigenetic status are simultaneously significantly associated with the same MP (FDR < 0.1). C, The number of significant genes, of which, genetic statuses impact the MPs at pan-cancer level or cancer-specific level. D, The number of significant genes, of which, genetic statuses associate with one or multiple MPs.
Figure 4. The E-genes and I-genes influence the mutational propensities. A, The Upset plot shows the overlap between the E-genes, I-genes, COSMIC CGCs, and another three published benchmark cancer gene sets. B, The E-genes and I-genes are enriched for determinants of different MPs at the pan-cancer level based on the background of 2,314 candidate genes. The dot color represents the −log10 (FDR). The dot size represents the OR of enrichment based on the background of 2,314 candidate genes. C, The pathways enriched in E-genes and I-genes. The dot color represents the −log10 (FDR). The dot size represents the OR of enrichment. D, The I-genes impact on the MPs through different immune cell activities in TIME.
Figure 4.
The E-genes and I-genes influence the mutational propensities. A, The Upset plot shows the overlap between the E-genes, I-genes, COSMIC CGCs, and another three published benchmark cancer gene sets. B, The E-genes and I-genes are enriched for determinants of different MPs at the pan-cancer level based on the background of 2,314 candidate genes. The dot color represents the −log10 (FDR). The dot size represents the OR of enrichment based on the background of 2,314 candidate genes. C, The pathways enriched in E-genes and I-genes. The dot color represents the −log10 (FDR). The dot size represents the OR of enrichment. D, The I-genes impact on the MPs through different immune cell activities in TIME.
Figure 5. The carcinogenesis and cancer therapy of E-genes and I-genes. A, The genetic determinants of the MPs enrich for genes to which cancer cells manifest strong genetic dependency. B, Comparison fractions of genes significantly associated with drug IC50 in cancer cell lines among different gene sets. C, The E-genes of different MPs are predictive of drug IC50 targeting at different pathways. The dot size represents the fraction of drugs in each category, which are predicted. Different colors represent the average absolute effect sizes. D, The fractions of genes significantly associated with anti–PD-1 therapy response in melanoma among different gene sets. E, The fractions of genes significantly associated with anti–PD-1 therapy response in metastatic gastric cancer among different gene sets.
Figure 5.
The carcinogenesis and cancer therapy of E-genes and I-genes. A, The genetic determinants of the MPs enrich for genes to which cancer cells manifest strong genetic dependency. B, Comparison fractions of genes significantly associated with drug IC50 in cancer cell lines among different gene sets. C, The E-genes of different MPs are predictive of drug IC50 targeting at different pathways. The dot size represents the fraction of drugs in each category, which are predicted. Different colors represent the average absolute effect sizes. D, The fractions of genes significantly associated with anti–PD-1 therapy response in melanoma among different gene sets. E, The fractions of genes significantly associated with anti–PD-1 therapy response in metastatic gastric cancer among different gene sets.
Figure 6. The quantitative loci of the mutational propensities. A, The genomic distribution of the SNP loci. Each box represents a chromosome and each dot a SNP locus. The different colors represent the different MPs significantly associated. The colored dots represent the mpQTLs that reached genome-wide significance (P < 5.0 × 10⁻⁸), and the rest of SNPs are labeled in gray. B and C, The associations among the rs6060924 genotypes with the MP2 and the COX4I2 expression. D and E, The associations among the rs35413356 genotypes with the MP2 and the ALDH5A1 expression. The P values are based on Student t test. *, P < 0.05; **, P < 0.01; ***, P < 1.0 × 10⁻³; ****, P < 1.0 × 10⁻⁴; *****, P < 1.0 × 10⁻⁵.
Figure 6.
The quantitative loci of the mutational propensities. A, The genomic distribution of the SNP loci. Each box represents a chromosome and each dot a SNP locus. The different colors represent the different MPs significantly associated. The colored dots represent the mpQTLs that reached genome-wide significance (P < 5.0 × 10⁻⁸), and the rest of SNPs are labeled in gray. B and C, The associations among the rs6060924 genotypes with the MP2 and the COX4I2 expression. D and E, The associations among the rs35413356 genotypes with the MP2 and the ALDH5A1 expression. The P values are based on Student t test. *, P < 0.05; **, P < 0.01; ***, P < 1.0 × 10⁻³; ****, P < 1.0 × 10⁻⁴; *****, P < 1.0 × 10⁻⁵.

Similar articles

Cited by

References

    1. Riaz N, Havel JJ, Makarov V, Desrichard A, Urba WJ, Sims JS, et al. . Tumor and microenvironment evolution during immunotherapy with nivolumab. Cell 2017;171:934–49. - PMC - PubMed
    1. Nam AS, Chaligne R, Landau DA. Integrating genetic and non-genetic determinants of cancer evolution by single-cell multi-omics. Nat Rev Genet 2020;22:3–18. - PMC - PubMed
    1. Alexandrov LB, Nik-Zainal S, Wedge DC, Aparicio SAJR, Behjati S, Biankin AV, et al. . Signatures of mutational processes in human cancer. Nature 2013;500:415–21. - PMC - PubMed
    1. McGranahan N, Favero F, de Bruin EC, Birkbak NJ, Szallasi Z, Swanton C. Clonal status of actionable driver events and the timing of mutational processes in cancer evolution. Sci Transl Med 2015;7:283ra54. - PMC - PubMed
    1. PCAWG Evolution & Heterogeneity Working Group, PCAWG Consortium, Gerstung M, Jolly C, Leshchiner I, Dentro SC, et al. . The evolutionary history of 2,658 cancers. Nature 2020;578:122–8. - PMC - PubMed

Publication types