. 2021 Jul 2;12(1):4089.
doi: 10.1038/s41467-021-24168-8.

Patient-derived models recapitulate heterogeneity of molecular signatures and drug response in pediatric high-grade glioma

Affiliations

Patient-derived models recapitulate heterogeneity of molecular signatures and drug response in pediatric high-grade glioma

Chen He et al. Nat Commun. .

Abstract

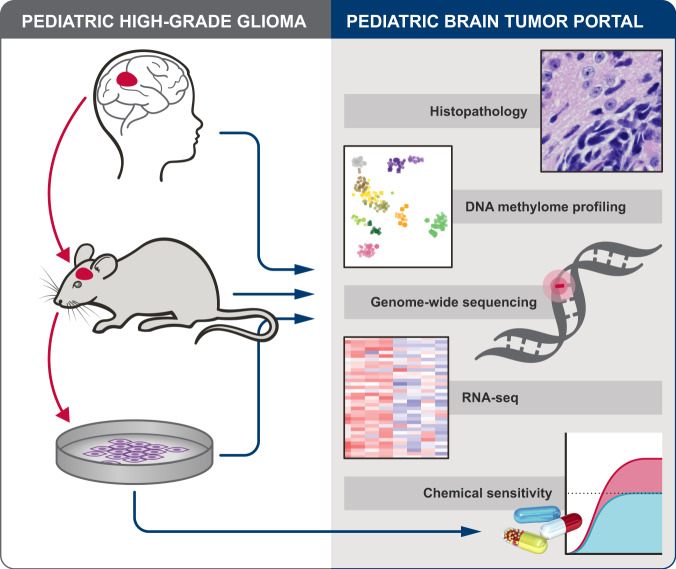
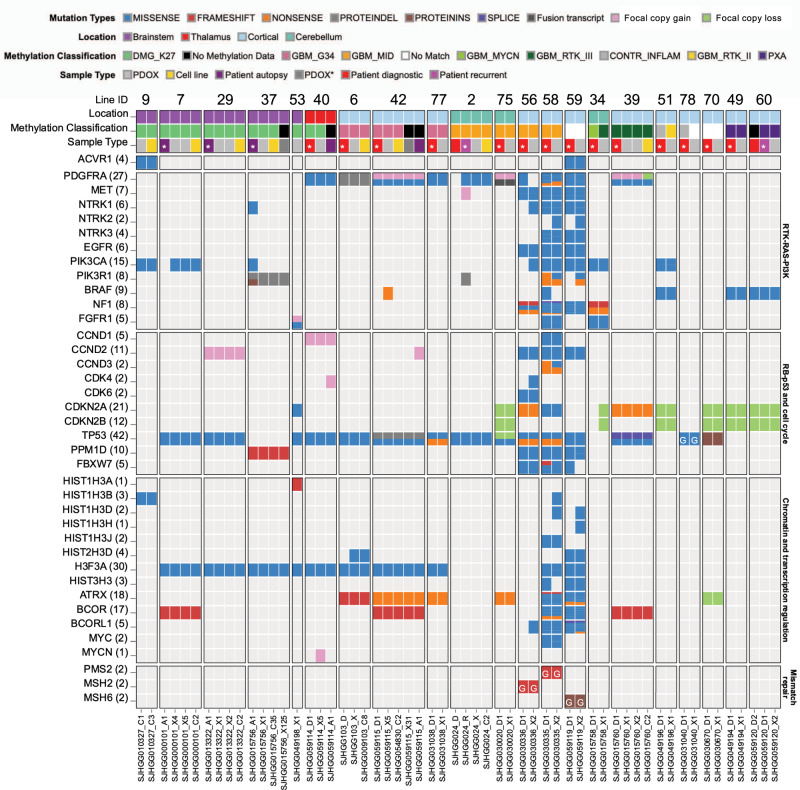
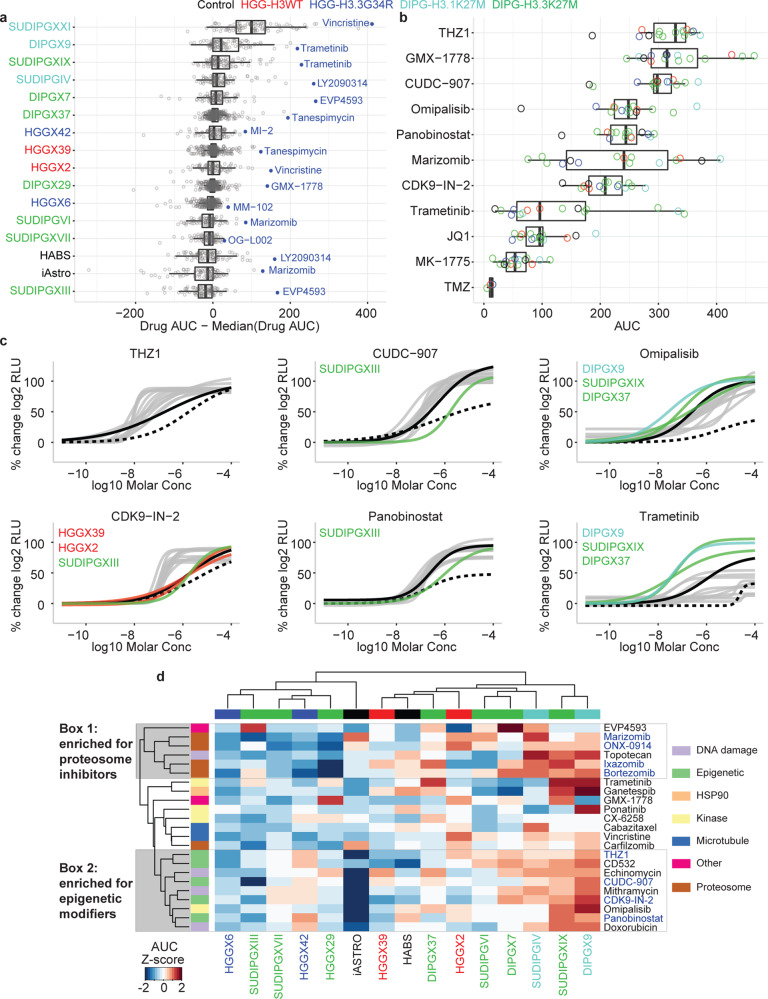
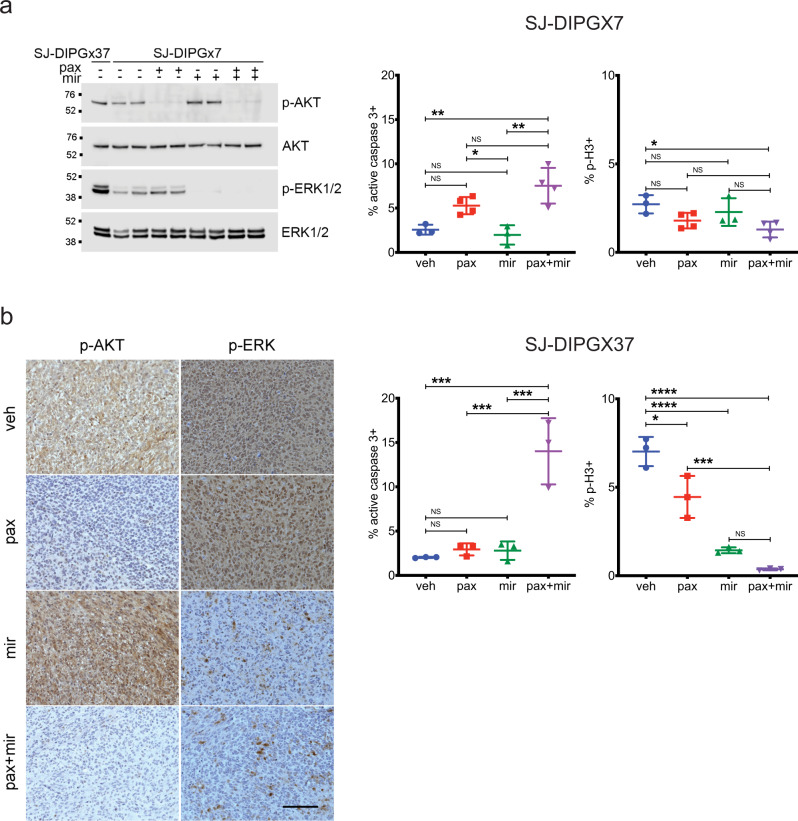
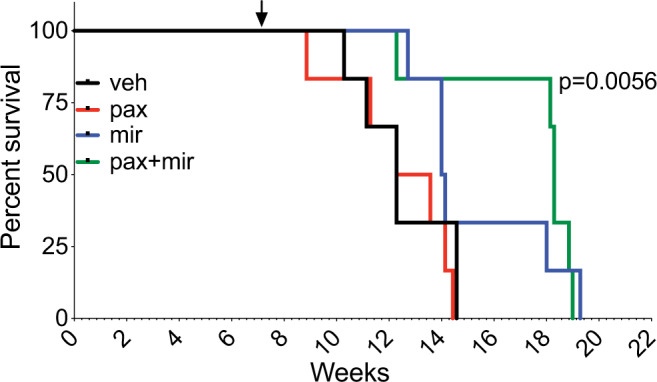
Pediatric high-grade glioma (pHGG) is a major contributor to cancer-related death in children. In vitro and in vivo disease models reflecting the intimate connection between developmental context and pathogenesis of pHGG are essential to advance understanding and identify therapeutic vulnerabilities. Here we report establishment of 21 patient-derived pHGG orthotopic xenograft (PDOX) models and eight matched cell lines from diverse groups of pHGG. These models recapitulate histopathology, DNA methylation signatures, mutations and gene expression patterns of the patient tumors from which they were derived, and include rare subgroups not well-represented by existing models. We deploy 16 new and existing cell lines for high-throughput screening (HTS). In vitro HTS results predict variable in vivo response to PI3K/mTOR and MEK pathway inhibitors. These unique new models and an online interactive data portal for exploration of associated detailed molecular characterization and HTS chemical sensitivity data provide a rich resource for pediatric brain tumor research.


Conflict of interest statement

The authors declare no competing interests.

Figures

Fig. 1
Fig. 1. Overview of PDOX and cell line establishment, characterization and preclinical testing, and pHGG data available in Pediatric Brain Tumor Portal.
Patient high-grade glioma samples were directly implanted into recipient mouse brain and passaged as PDOX models. Cell lines were also established from a subset of PDOX models (left). Each PDOX or cell line, and when available, matched patient tumor, were evaluated for histopathology, DNA methylome profiles, genome-wide sequencing and RNAseq. Genome sequencing of matched normal reference is also available for most PDOX models. Chemical sensitivity testing was performed with cell lines (right). All associated data is available through an interactive data portal, the Pediatric Brain Tumor Portal (pbtp.stjude.cloud).
Fig. 2
Fig. 2. DNA methylation classification of patient tumors is conserved in corresponding PDOXs and cell lines.
a t-SNE plot showing tumor subgroups based on DNA methylation profiling. Nineteen patient tumors (circles), 21 PDOXs (squares), and 14 cell lines (diamonds) are outlined in black. Lines connect PDOXs and cell lines with the patient tumors from which they were derived. Tumor subgroup classifications are color-coded. Circles without outlines are reference samples from Capper et al. Dashed square shows region containing all HGG samples. Classifications: Embryonal tumors: atypical teratoid rhabdoid tumors (ATRT), embryonal tumor with multilayered rosettes (ETMR), high-grade neuroepithelial tumor with BCOR alteration (HGNET_BCOR), and medulloblastoma (MB). Ependymal tumors: ependymoma (EPN), subependymoma (SUBPEN), myxopapillary ependymoma (MPE), posterior fossa (PF), supratentorial (ST). Glioblastoma: diffuse midline glioma (DMG) and glioblastoma (GBM). Other glioma: anaplastic pilocytic astrocytoma (ANA_PA), high-grade neuroepithelial tumor with MN1 alteration (HGNET_MN1), anaplastic pleomorphic xanthoastrocytoma (PXA). Control tissue, inflammatory tumor microenvironment (CONTR_INFLAM). b Enlarged view of boxed region in a. Dashed oval shows patient tumors with MMRD and derived PDOX models.
Fig. 3
Fig. 3. Histopathology of PDOX recapitulates salient features of the patient tumor from which it was derived.
H&E staining of HGG PDOX SJ-HGGX6 (a), shown as a representative example, recapitulates histologic features of its corresponding primary human tumor (b), including infiltration of the CNS parenchyma (arrow), perivascular invasion (black right pointing triangle), and apparent mitotic activity (asterik). Nuclear ATRX immunoreactivity, while retained in the entrapped neurons, is lost in the PDOX tumor cells (c), as in its corresponding primary human tumor (d). N: entrapped cerebral cortical neurons. Scale bar: 50 µm. H&E staining was performed for 21 PDOX models, 20 with matching patient tumor. ATRX IHC was performed in six PDOX/patient tumor pairs, four with ATRX mutation, and two without ATRX mutation. Loss of ATRX immunoreactivity was consistent with mutation status in all samples tested.
Fig. 4
Fig. 4. Genomic landscapes of PDOX and cell lines conserve alterations present in the matched patient tumor and represent a variety of pHGG subtypes.
Alterations in genes recurrently mutated in pHGG are indicated on the left. Pathways are indicated on the right. Columns show tumor samples. PDOX and cell lines are grouped together with patient tumors from which they were derived. Numbers are the PDOX identifier IDs across the top, sequence file IDs across the bottom. Rows show the location of patient tumors, DNA methylome classification, and tumor sample type. In some cases, patient tumor samples from recurrence or autopsy are included along with the diagnostic sample. Asterisk in tumor sample type indicates the patient tumor from which the PDOX was derived. For 7, passages 7 and 10 of SJ-DIPGX7 are shown, and for 29, passages 3 and 4 of SJ-DIPGX29 are shown. PDOX* (dark gray box) indicates xenograft generated by implanting the associated cell line. Mutations in signature genes shown as rows are indicated by Mutation Type color code. G in block indicates germline mutation.
Fig. 5
Fig. 5. Gene expression signatures of PDOX models recapitulate glioma expression subgroups.
Unsupervised hierarchical clustering of RNA-seq quantification (log CPM) of genes from three expression signatures recapitulating glioma subgroups proliferative, proneural, and mesenchymal across the patient tumors, PDOXs, and cell lines.
Fig. 6
Fig. 6. Analysis of screening results from 93 compounds across 14 pHGG models and two normal astrocyte lines.
a Distribution of normalized drug AUC (the drug AUC in that cell model minus the median AUC for that drug across all models to control for inherent drug potency). Each dot represents a single drug with the most selective drug for each model shown in blue. Cell models are color coded by histone mutation status. n = 93 drug AUC values derived from one or more independent experiments. b Distribution of AUC for select drugs that have been evaluated in clinical trials or implicated as promising agents in glioma preclinical studies. Each dot represents the drug AUC in one model and is color coded by the histone mutation status of the model. n = 15 drug AUC values derived from one or more independent experiments, except TMZ where n = 4. In a, b, data are represented as boxplots where the middle line is the median, the lower and upper hinges correspond to the first and third quartiles, the upper whisker extends from the hinge to the largest value no further than 1.5 × the interquartile range (IQR) from the hinge and the lower whisker extends from the hinge to the smallest value at most 1.5 × IQR of the hinge. All data points are plotted individually. c Select dose–response curves for the drugs highlighted in b. Normal references are depicted in black dashed lines (iAstro) and black solid lines (HABS). pHGG models are colored gray or by histone mutation status for models indicated. d Unsupervised hierarchical clustering of drug AUC z-scores for the 25% most active compounds out of 93 tested. Column and column labels are color coded by histone mutation status. Clusters 1 and 2 (gray boxes) highlight compound clusters showing distinct activity profiles across the models tested. The color code for histone mutation status is: H3-wt (red), H3.3 G34R (blue), H3.1 K27M (turquoise), and H3.3 K27M (green). Control cell lines (iAstro and HABS) are black. Color code for mechanism of action is shown on the right and annotated in heatmap row color blocks at left in d.
Fig. 7
Fig. 7. Paxalisib and mirdametinib drive synergistic growth inhibition in a subset of pHGG cell lines.
The BRAID model presents synergistic effects of paxalisib (pax) and mirdametinib (mir) following a 7-day treatment in 7-cell lines: H3.3 K27M DIPGs; SJ-DIPGX37c, SJ-DIPGX29c, SJ-DIPGX7c, H3.3 G34R pHGGs; SJ-HGGX42c, SJ-HGGX6c, and astrocyte controls HABS and iAstro. The parameter κ measures the type of interaction: κ < 0 implies antagonism, κ = 0 implies additivity, and κ > 0 implies synergy). The index of achievable efficacy (IAE) quantifies the degree to which the drug combination achieves a minimal level of efficacy within a defined concentration range. Higher IAE means the combination was more efficacious. In this experiment, it was defined as a 50% reduction of cell viability (black line) at concentrations ≤ 1 μM (dotted lines). The 90% reduction of viability isobole (white line) is included for reference.
Fig. 8
Fig. 8. Paxalisib and mirdametinib show selective effects on cell survival and proliferation in vivo.
a Left: A single western blot of lysates from intracranial PDOX SJ-DIPGX37 (untreated, lane 1) and SJ-DIPGX7 (lanes 2–9) treated with vehicle (veh), paxalisib (pax, 12 mg/kg), mirdametinib (mir, 17 mg/kg), or the combination of paxalisib and mirdametinib (pax + mir) as indicated; antibodies are indicated at right. Quantification of IHC in sections from SJ-DIPGX7 tumors treated with agents shown along the x-axis for active caspase-3 (middle) and phospho-histone H3 (right), n = 3 tumors for veh, mir and n = 4 tumors for pax and pax + mir. The p values for comparison of active caspase-3 staining are veh vs. mir 0.9454, veh vs. pax 0.0964, veh vs. pax + mir 0.0032, mir vs. pax 0.0383, mir vs. pax + mir 0.0014, and pax vs. pax + mir 0.1474. The p values for comparison of p-H3 staining are veh vs. mir 0.7418, veh vs. pax 0.1733, veh vs. pax + mir 0.0258, mir vs. pax 0.6600, mir vs. pax + mir 0.1435, and pax vs. pax + mir 0.5747. b Left: IHC for pAKT Ser473 and pERK in SJ-DIPGX37 tumors in representative tumors treated with veh, pax, mir, or pax + mir as indicated. Quantification of IHC staining in sections from SJ-DIPGX37 tumors treated with agents shown along the x-axis for active caspase-3 (middle) and phospho-histone H3 (right), n = 3 tumors for each treatment. The p values for comparison of active caspase-3 staining are veh vs. mir 0.9628, veh vs. pax 0.9405, veh vs. pax + mir 0.0003, mir vs. pax 0.9997, mir vs. pax + mir 0.0005, and pax vs. pax + mir 0.0006. The p values for comparison of p-H3 staining are veh vs. mir < 0.0001, veh vs. pax 0.0110, veh vs. pax + mir < 0.0001, mir vs. pax 0.0043, mir vs. pax + mir 0.3352, and pax vs. pax + mir 0.0006. NS not significant; *p < 0.05; **p < 0.01; ***p < 0.001, ****p < 0.0001 using ordinary one-way ANOVA with post hoc Tukey test. The error bars indicate the mean ± s.d. Scale bar in b, left panel = 100 µm.
Fig. 9
Fig. 9. Combined treatment with paxalisib and mirdametinib significantly extends survival of SJ-DIPGX37-bearing mice.
Mice were randomized 50 days after implantation into four treatment arms (6 mice per arm) and treated with vehicle (black), paxalisib (8 mg/kg) (red), mirdametinib (14 mg/kg) (blue), or paxalisib + mirdametinib daily (green), 5 days ON and 2/3 days OFF. Paxalisib + mirdametinib vs. vehicle, p = 0.0056; mirdametinib vs. vehicle, p = 0.16; paxalisib vs. vehicle, p = 0.48 (Mantel–Cox log-rank test). Arrow shows the time point for randomization and initiation of treatment. Kaplan–Meier survival analysis.

References

    1. Ostrom QT, et al. CBTRUS Statistical Report: primary brain and central nervous system tumors diagnosed in the United States in 2008-2012. Neuro Oncol. 2015;17(Suppl. 4):iv1–iv62. doi: 10.1093/neuonc/nov189. - DOI - PMC - PubMed
    1. Jones C, Baker SJ. Unique genetic and epigenetic mechanisms driving paediatric diffuse high-grade glioma. Nat. Rev. Can cer. 2014;14:1355. - PMC - PubMed
    1. Sturm D, et al. Paediatric and adult glioblastoma: multiform (epi)genomic culprits emerge. Nat. Rev. Cancer. 2014;14:92–107. doi: 10.1038/nrc3655. - DOI - PMC - PubMed
    1. Bender S, et al. Reduced H3K27me3 and DNA hypomethylation are major drivers of gene expression in K27M mutant pediatric high-grade gliomas. Cancer Cell. 2013;24:660–672. doi: 10.1016/j.ccr.2013.10.006. - DOI - PubMed
    1. Mackay A, et al. Integrated molecular meta-analysis of 1,000 pediatric high-grade and diffuse intrinsic pontine glioma. Cancer Cell. 2017;32:520–537 e525. doi: 10.1016/j.ccell.2017.08.017. - DOI - PMC - PubMed

Publication types

Substances