. 2021 Jul 2;12(1):4091.
doi: 10.1038/s41467-021-24386-0.

Dissecting spatial heterogeneity and the immune-evasion mechanism of CTCs by single-cell RNA-seq in hepatocellular carcinoma

Affiliations

Dissecting spatial heterogeneity and the immune-evasion mechanism of CTCs by single-cell RNA-seq in hepatocellular carcinoma

Yun-Fan Sun et al. Nat Commun. .

Abstract

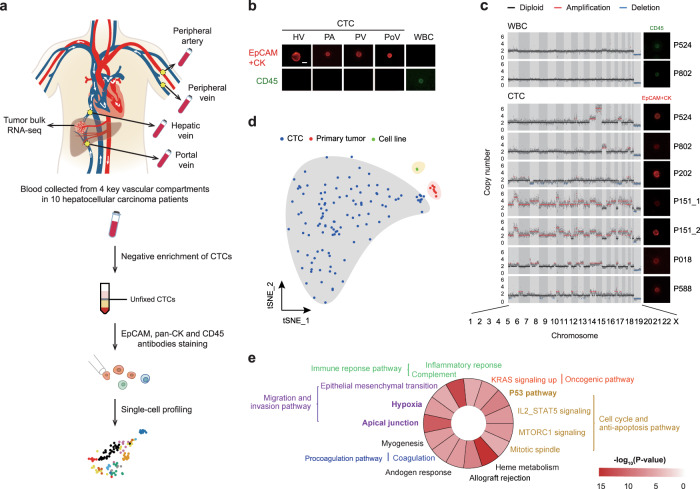
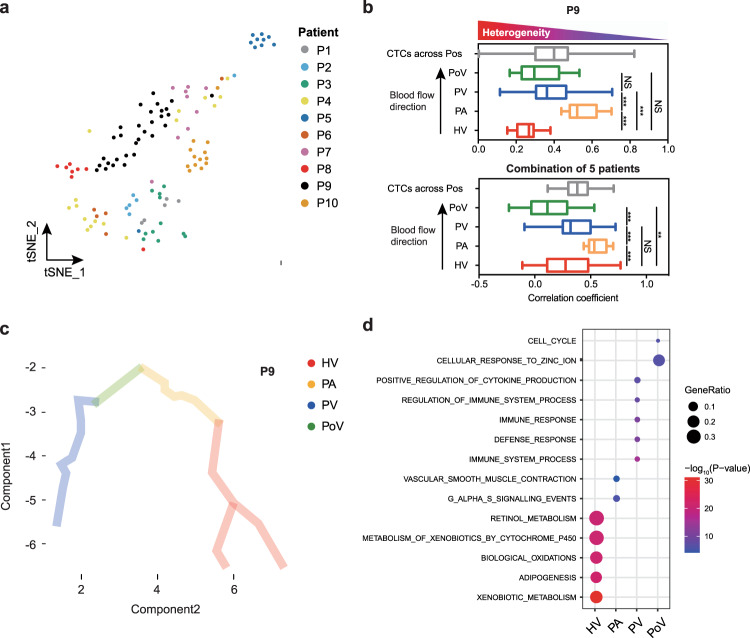
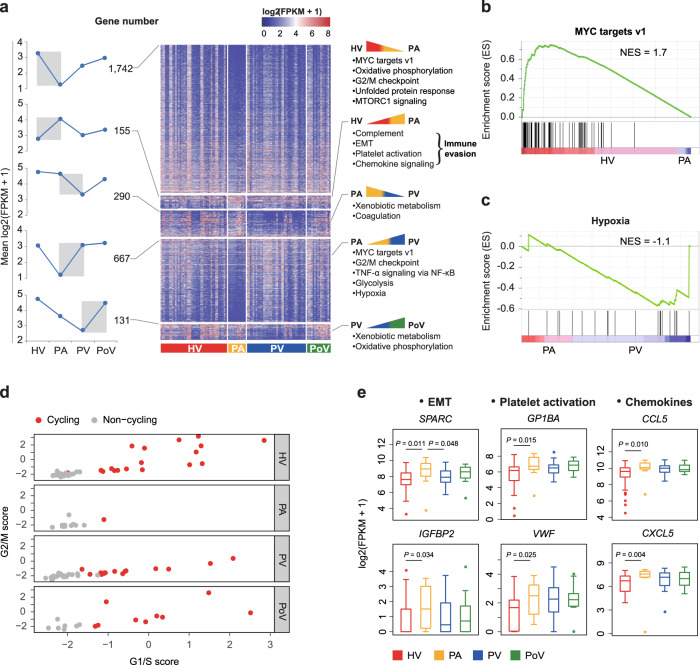
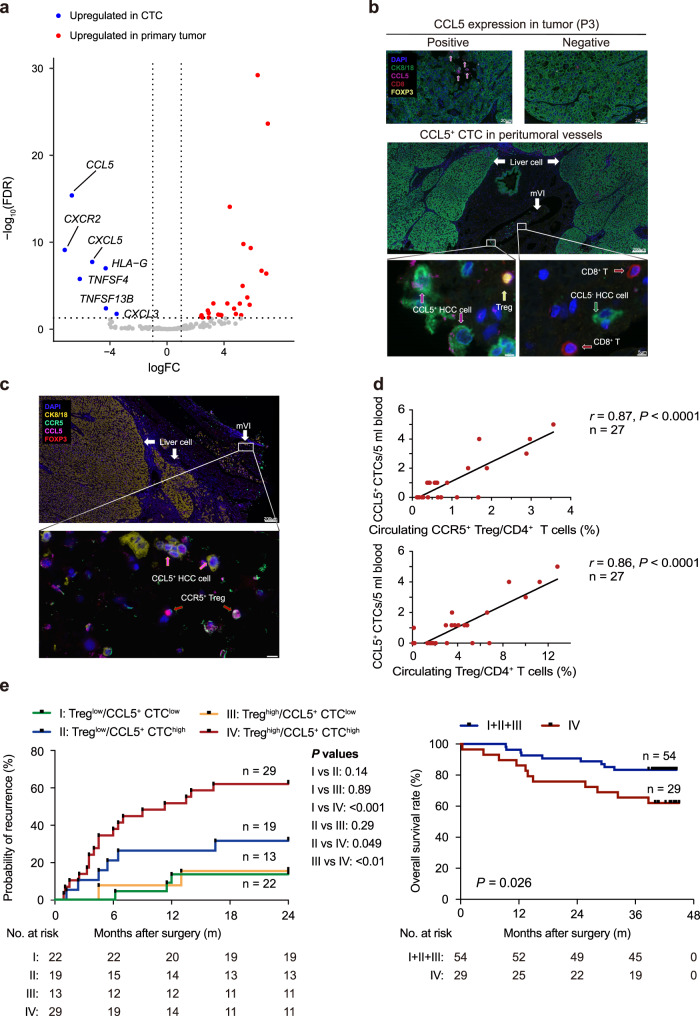
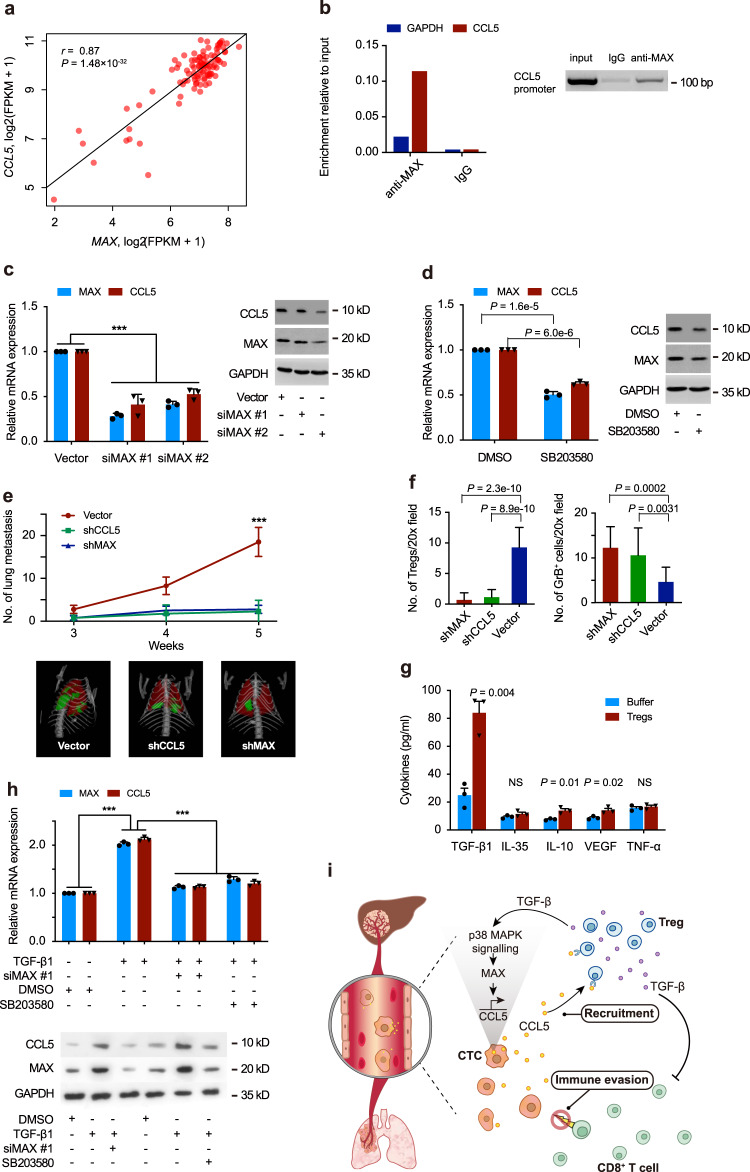
Little is known about the transcriptomic plasticity and adaptive mechanisms of circulating tumor cells (CTCs) during hematogeneous dissemination. Here we interrogate the transcriptome of 113 single CTCs from 4 different vascular sites, including hepatic vein (HV), peripheral artery (PA), peripheral vein (PV) and portal vein (PoV) using single-cell full-length RNA sequencing in hepatocellular carcinoma (HCC) patients. We reveal that the transcriptional dynamics of CTCs were associated with stress response, cell cycle and immune-evasion signaling during hematogeneous transportation. Besides, we identify chemokine CCL5 as an important mediator for CTC immune evasion. Mechanistically, overexpression of CCL5 in CTCs is transcriptionally regulated by p38-MAX signaling, which recruites regulatory T cells (Tregs) to facilitate immune escape and metastatic seeding of CTCs. Collectively, our results reveal a previously unappreciated spatial heterogeneity and an immune-escape mechanism of CTC, which may aid in designing new anti-metastasis therapeutic strategies in HCC.


Conflict of interest statement

The authors declare no competing interests.

Figures

Fig. 1
Fig. 1. Characterizing differential gene expression among CTCs, primary tumor, and HCC cell lines based on RNA-seq.
a Overview of the workflow for CTC isolation and single-cell RNA preparation. b Representative fluorescence images of CTCs and WBCs labeled with CD45, EpCAM, and CK antibodies; the scale bar is 10 μm. c CNV profiling of seven EpCAM+ and/or pan-CK+ and CD45 CTCs and two CD45+ WBC from six patients. The fluorescence images of sequenced CTCs and WBCs are displayed. d t-SNE plot illustrates the similarity of the expression profiles between CTCs, primary tumors, and HCC cell lines. e Pathway enrichment in the Hallmark dataset for upregulated genes in CTCs compared with primary tumors. Hypergeometric test was used to test whether DEGs were overlapped with the gene sets. The Benjamini–Hochberg FDR-controlling method for multiple hypothesis testing were performed.
Fig. 2
Fig. 2. Spatial transcriptional heterogeneity in CTCs.
a t-SNE plot of CTCs from ten patients reveals their interpatient heterogeneity. b Pearson correlation analysis showing cell-to-cell variability for CTCs drawn from four vascular sites in patient P9 (upper panel) and five patients combined (lower panel). The two-sided Wilcox test was used. Data are presented using box and whisker plot (median, lower quartile, upper quartile, minimum, and maximum values). n = 45 cells in HV; n = 12 cells in PA; n = 40 cells in PV; n = 16 cells in PoV. **P < 0.01, ***P < 0.001. Exact P values in upper panel: HV vs PA, P = 1.18 × 10−9; PA vs PV, P = 2.79 × 10−4; HV vs PV, P = 2.36 × 10−4. Exact P values in lower panel: HV vs PA, P = 2.32 × 10−3; PA vs PV, P = 7.00 × 10−4; PV vs PoV, P = 1.50 × 10−5; HV vs PoV, P = 6.13 × 10−3. Bar = median, box plot = quartiles. c Pseudotemporal kinetics of CTCs in patients P9. d Bubble chart presenting the molecular pathways enriched in CTCs from each vascular sites. Hypergeometric test was used to test whether DEGs were overlapped with the gene sets. The Benjamini–Hochberg FDR-controlling method for multiple hypothesis testing were performed.
Fig. 3
Fig. 3. Dynamics of single-CTC transcriptome highlights pathway alterations for stress response and heterogeneity in cell cycle during circulation.
a Dynamic changes and heat map of differentially expressed genes between neighbor vascular sites (HV vs PA, PA vs PV, and PV vs PoV), with the number of differentially expressed genes indicated at left panel and major signaling pathways enriched (right panel). b GSEA of CTCs from HV vs PA for MYC targets v1 pathway. c GSEA of CTCs from PA vs PV for hypoxia pathway. d Scatterplot indicating cell cycle state of individual CTCs on the basis of G1/S (x-axis) and G2/M (y-axis) gene sets in different vascular compartments. e Box and whisker plots showing expression variance of EMT-related, platelet activation, and chemokine genes in CTCs across four vascular sites. Data are presented as median, lower quartile, upper quartile, minimum, and maximum values. n = 45 cells in HV; n = 12 cells in PA; n = 40 cells in PV; n = 16 cells in PoV. The two-sided Wilcox test was used.
Fig. 4
Fig. 4. CCL5+ CTCs are positively correlated with circulating Tregs and predicted postoperative relapse in HCC patients.
a Immune-evasion-related genes and cytokines differentially expressed by CTCs and primary tumors. b Multiplex immunofluorescence images displaying the expression of CCL5 in primary tumors and CTCs detected in peritumoral microvasculature. mVI, microvascular invasion. The scale bars represent 20 µm, 200 µm, and 5 µm, respectively. c Multiplex immunofluorescence images representative of spatial relationship between the CCL5+ CTCs and CCR5+/FoxP3+ Tregs detected in peritumoral microvasculature. The scale bars represent 200 µm and 10 μm, respectively. d Scatterplot showing a positive correlation between the number of CCL5+ CTCs and the abundance of CCR5+ Tregs (CD4+, CD25high, and CD127low) (upper) and total Tregs (lower) in CD4+ T cells from HCC peripheral blood (n = 27 patients). e Kaplan–Meier analysis showing increased probability of early recurrence (left) and decreased overall survival rate (right) in patients with Treghigh/CTChigh in peripheral blood vs the other groups. I: Treglow/CCL5+ CTClow, II: Treglow/CCL5+ CTChigh, III: Treghigh/CCL5+ CTClow, and IV: Treghigh/CCL5+ CTChigh. The number of patients at risk for each group is listed below the Kaplan–Meier curve. A two-tailed Student’s t test was employed (d). Log-rank testing are performed to estimate the prognostic significance (e).
Fig. 5
Fig. 5. CTCs recruit Tregs via CCL5 expression to generate an immunosuppressive and pro-tumorigenic microenvironment.
a Expression of CCL5 in HCC cell lines with different metastatic potential. b The numbers of migrated Tregs cocultured with supernatant medium of Huh7 or MHCC97H cells without treatment (left panel), and treated with antihuman CCL5-neutralizing antibody or IgG (right panel). c Histogram showing relative mRNA expression of CCL5 in Hepa1–6 cells with CCL5 knockdown or control. d Immunofluorescence images of CCL5 expression in Hepa1–6 cells with CCL5 knockdown or control. Scale bar is 10 µm. e CTC clearance curves in blood after injection with 5 × 106 Hepa1–6 cells into the tail veins of C57BL/6J mice (n = 30 per condition, five mice per time point). f Histograms showing the percentage of circulating Tregs in mice from CCL5 knockdown (n = 5) and vector control groups (n = 5). g Scatter plots showing the numbers of lung (upper) and liver metastases (lower) developed under conditions described in e (n = 5 per group). h Histograms showing the numbers of Tregs (upper) and granzyme B+ cytotoxic T lymphocytes (lower) in liver metastases under conditions described in e. Five independent microscopic field, representing the densest lymphocytic infiltrates, were selected for one liver metastatic tumor each mouse. i The comparison of mice Treg migration toward CTCs isolated from vector and shCCL5 Hepa1–6 orthotopic models. CCL5-neutralizing antibody was added to the coculture system to determine the effect on Treg migration (n = 5 per group). Comparisons were calculated by two-tailed Student’s t test. Data are mean ± SD of three (b, c) and five (eg, i) biological replicates, and are representative of two independent experiments. *** represents P < 0.001. The exact P values at the time point of 12 h in e: vector + IgG vs shCCL5 + IgG, P = 3.49 × 10−9; vector + IgG vs vector + anti-CD25ab, P = 1.84 × 10−9.
Fig. 6
Fig. 6. CCL5 induction is mediated through p38-MAX pathway.
a Scatterplot showing a high correlation between CCL5 and MAX expressed in CTCs based on scRNA-seq. A two-tailed Pearson correlation test was employed. b ChIP assays showing direct binding of MAX to the CCL5 gene promoter in MHCC97H cells, using IgG as negative control. c Relative expression of MAX and CCL5 at mRNA (left) and protein level (right) in MHCC97H cells transfected, respectively, with MAX siRNAs and vector, and d treated with p38 inhibitor SB203580 or DMSO control. e The number and representative images (metastatic nodules in green) of lung metastases detected by microCT in different time points after tail-vein injection of 5 × 106 Hepa1–6 cells with three different conditions in C57BL/6J mice (n = 5 per group, upper panel). f Histograms showing the numbers of Tregs (left) and granzyme B+ cytotoxic T lymphocytes (right) in lung metastases from mice treated, as described in e. Five independent microscopic field, representing the densest lymphocytic infiltrates, were selected for one lung metastatic tumor each mouse. g Comparing levels of Treg-derived cytokines, including TGF-β1, IL-10, IL-35, VEGF, and TNF-α in culture medium from Huh7 cells cocultured with or without Tregs: error bars. h The mRNA (upper) and protein (lower) levels of MAX and CCL5 in MHCC97H cells treated with TGF-β1, MAX siRNA, P38 inhibitor, and DMSO, respectively. i Schematic illustration of immune-escape mechanism by which CTCs acquire the ability to recruit immunosuppressive Treg cells via a positive feedback loop of TGF-β1-p38-MAX-CCL5 signaling, consequently promoting the formation of a metastatic-favorable microenvironment in the bloodstream and secondary organs. Comparisons were calculated by two-tailed Student’s t test (ch). Data are mean ± SD of three biological (c, d, g, h) and five biological (e) replicates, and are representative of two independent experiments. *** represents P < 0.001. The exact P values for comparison of MAX expression in c: vector vs siMAX#1, P = 2.00 × 10−6; vector vs siMAX#2, P = 8.96 × 10−4. The exact P values for comparison of CCL5 expression in c: vector vs siMAX#1, P = 8.00 × 10−6; vector vs siMAX#2, P = 1.51 × 10−4. The exact P values at the time point of 5 weeks in e: vector vs shCCL5, P = 2.8 × 10−4; vector vs shMAX, P = 1.1 × 10−4. The exact P values for comparison of MAX expression in h: DMSO vs TGF-β1, P = 2.00 × 10−6; DMSO vs TGF-β1 + siMAX#1, P = 8.00 × 10−6; DMSO vs TGF-β1 + SB203580, P = 5.00 × 10−5. The exact P values for comparison of CCL5 expression in h: DMSO vs TGF-β1, P = 2.00 × 10−6; DMSO vs TGF-β1 + siMAX#1, P = 5.00 × 10−6; DMSO vs TGF-β1 + SB203580, P = 1.8 × 10−5.

References

    1. Zhou, J. et al. Guidelines for diagnosis and treatment of primary liver cancer in China (2017 Edition). Liver Cancer7, 235–260 (2018). - PMC - PubMed
    1. Poon RT, et al. Tumor microvessel density as a predictor of recurrence after resection of hepatocellular carcinoma: a prospective study. J. Clin. Oncol. Off. J. Am. Soc. Clin. Oncol. 2002;20:1775–1785. doi: 10.1200/JCO.2002.07.089. - DOI - PubMed
    1. Mann J, Reeves HL, Feldstein AE. Liquid biopsy for liver diseases. Gut. 2018;67:2204–2212. doi: 10.1136/gutjnl-2017-315846. - DOI - PubMed
    1. Senft D, Ronai ZA. Adaptive stress responses during tumor metastasis and dormancy. Trends Cancer. 2016;2:429–442. doi: 10.1016/j.trecan.2016.06.004. - DOI - PubMed
    1. Miyamoto DT, et al. RNA-Seq of single prostate CTCs implicates noncanonical Wnt signaling in antiandrogen resistance. Science. 2015;349:1351–1356. doi: 10.1126/science.aab0917. - DOI - PMC - PubMed

Publication types

MeSH terms