. 2021 Jul 2;11(1):13717.
doi: 10.1038/s41598-021-92766-z.

Mobility restrictions were associated with reductions in COVID-19 incidence early in the pandemic: evidence from a real-time evaluation in 34 countries

Affiliations

Mobility restrictions were associated with reductions in COVID-19 incidence early in the pandemic: evidence from a real-time evaluation in 34 countries

Juhwan Oh et al. Sci Rep. .

Abstract

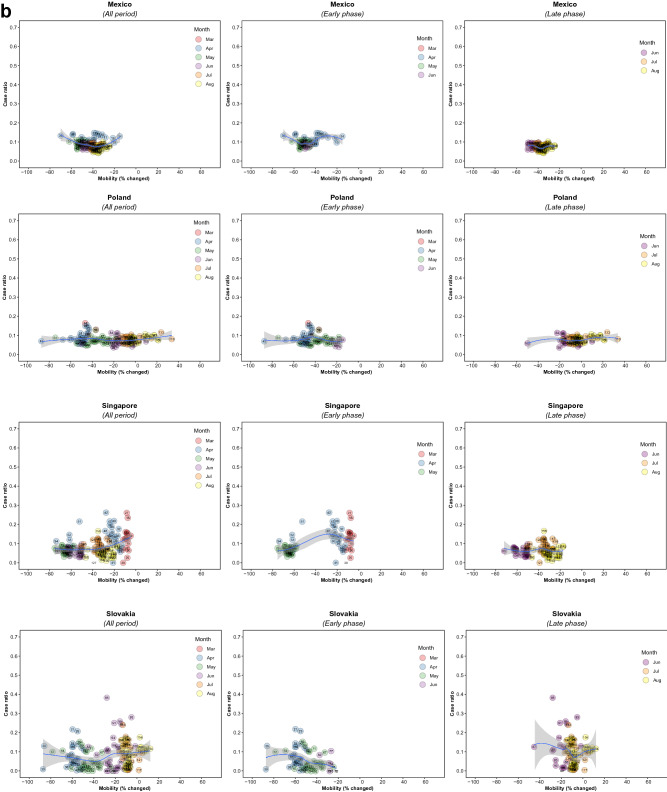
Most countries have implemented restrictions on mobility to prevent the spread of Coronavirus disease-19 (COVID-19), entailing considerable societal costs but, at least initially, based on limited evidence of effectiveness. We asked whether mobility restrictions were associated with changes in the occurrence of COVID-19 in 34 OECD countries plus Singapore and Taiwan. Our data sources were the Google Global Mobility Data Source, which reports different types of mobility, and COVID-19 cases retrieved from the dataset curated by Our World in Data. Beginning at each country's 100th case, and incorporating a 14-day lag to account for the delay between exposure and illness, we examined the association between changes in mobility (with January 3 to February 6, 2020 as baseline) and the ratio of the number of newly confirmed cases on a given day to the total number of cases over the past 14 days from the index day (the potentially infective 'pool' in that population), per million population, using LOESS regression and logit regression. In two-thirds of examined countries, reductions of up to 40% in commuting mobility (to workplaces, transit stations, retailers, and recreation) were associated with decreased cases, especially early in the pandemic. Once both mobility and incidence had been brought down, further restrictions provided little additional benefit. These findings point to the importance of acting early and decisively in a pandemic.


Conflict of interest statement

The authors declare no competing interests.

Figures

Figure 1
Figure 1
Association between COVID-19 case ratio and mobility changes for 36 countries by pandemic phase, arbitrarily split by geography to allow better resolution of the data. Footnote 1. The mobility change measurement period was from the day of the 100th case in each country through August 31, 2020. Footnote 2. Pandemic phase was defined for each country by the median of the date when the 100th case was detected to the end of the study period: early phase for the period before the median date and late phase for the period after the median date.
Figure 2
Figure 2
Association between new daily COVID-19 case ratio and commuting mobility changes in each of 36 countries by pandemic phase. (A) Western Europe, North America, and Oceania countries. (B) Asia, Eastern Europe, Latin America, and Caribbean countries. Footnote 1. The mobility change measurement period was from the day of the 100th case in each country through August 31, 2020. Footnote 2. Pandemic phase was defined for each country by the median of the date when the 100th case was detected to the end of the study period: early phase for the period before the median date and late phase for the period after the median date.
Figure 2
Figure 2
Association between new daily COVID-19 case ratio and commuting mobility changes in each of 36 countries by pandemic phase. (A) Western Europe, North America, and Oceania countries. (B) Asia, Eastern Europe, Latin America, and Caribbean countries. Footnote 1. The mobility change measurement period was from the day of the 100th case in each country through August 31, 2020. Footnote 2. Pandemic phase was defined for each country by the median of the date when the 100th case was detected to the end of the study period: early phase for the period before the median date and late phase for the period after the median date.
Figure 3
Figure 3
Forest plot showing unadjusted estimate for the association of COVID-19 case ratio logit-transformed with mobility changes. Footnote 1. The mobility change measurement period was from the day of the 100th case in each country through August 31, 2020. Footnote 2. Pandemic phase was defined for each country by the median of the date when the 100th case was detected to the end of the study period: early phase for the period before the median date and late phase for the period after the median date.
Figure 4
Figure 4
Association between new daily COVID-19 case ratio and mobility changes for 36 countries, early and late phase, for parks and residential areas. Footnote 1. Pandemic phase was defined for each country by the median of the date when the 100th case was detected to the end of the study period: early phase for the period before the median date and late phase for the period after the median date.

References

    1. UNICEF. Don’t let children be the hidden victims of COVID-19 pandemic. https://www.unicef.org/press-releases/dont-let-children-be-hidden-victim.... Accessed 15 Sep 2020; 2020.
    1. Lynsey C, Abdi Latif D. With Most Coronavirus Cases in Africa, South Africa Locks Down. The New York Times. 2020. https://www.nytimes.com/2020/03/27/world/africa/south-africa-coronavirus.... Accessed 13 May 2021.
    1. Sandford A. Coronavirus: Half of humanity now on lockdown as 90 countries call for confinement. Euronews. 2020. https://www.euronews.com/2020/04/02/coronavirus-in-europe-spain-s-death-..." https://www.euronews.com/2020/04/02/coronavirus-in-europe-spain-s-death-.... Accessed 13 May 2021.
    1. Ren X. Pandemic and lockdown: a territorial approach to COVID-19 in China, Italy and the United States. J Eurasian Geography Econ. 2020;61:1–12. doi: 10.1080/15387216.2020.1727758. - DOI
    1. Rahman, M., Thill, J.C., Kamal C.P. COVID-19 pandemic severity, lockdown regimes, and people’s mobility: Early evidence from 88 countries. Sustainability12(21), 9101 (2020).