. 2021 Jul 2;4(1):832.
doi: 10.1038/s42003-021-02295-8.

FUT6 deficiency compromises basophil function by selectively abrogating their sialyl-Lewis x expression

Collaborators, Affiliations

FUT6 deficiency compromises basophil function by selectively abrogating their sialyl-Lewis x expression

Kia Joo Puan et al. Commun Biol. .

Abstract

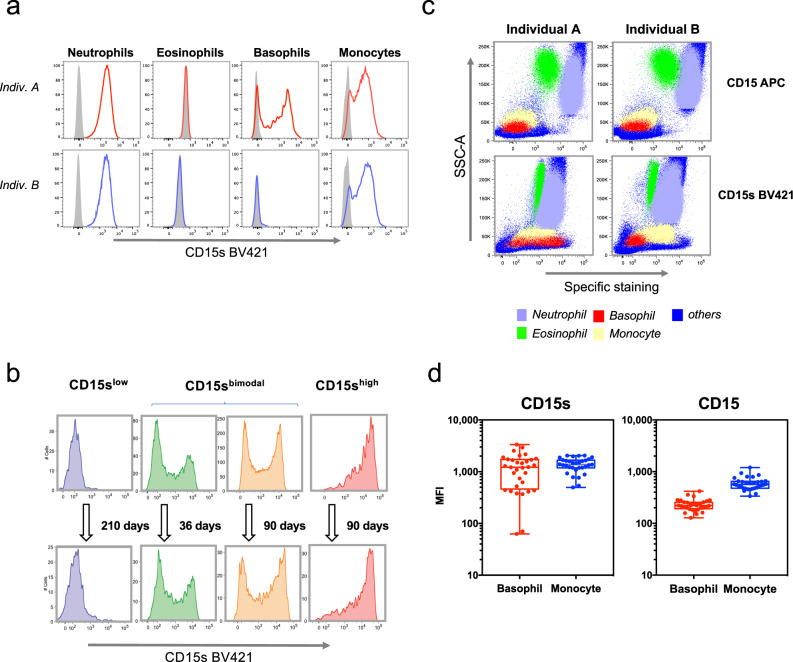
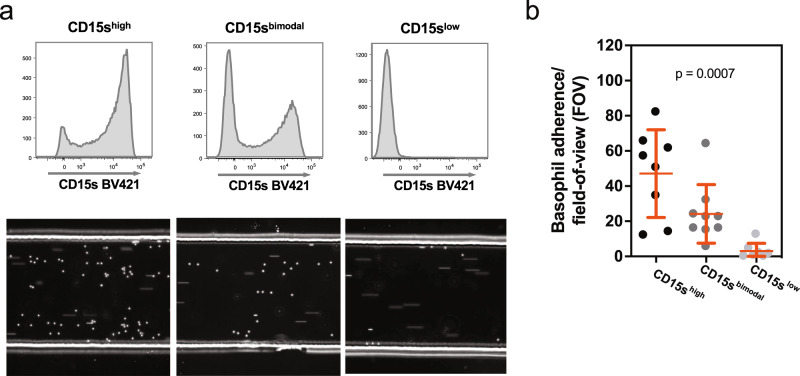
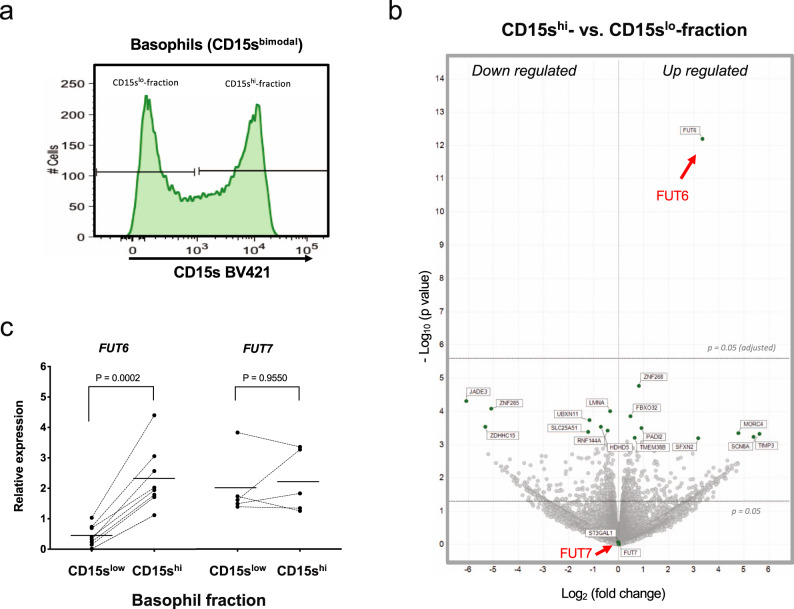
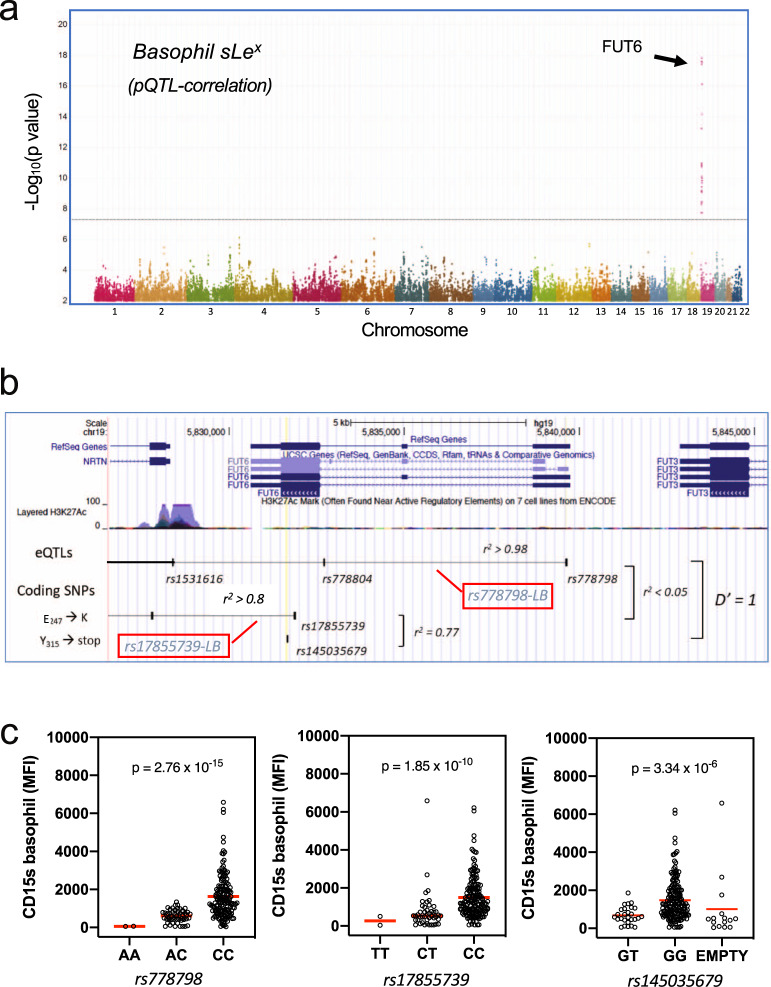
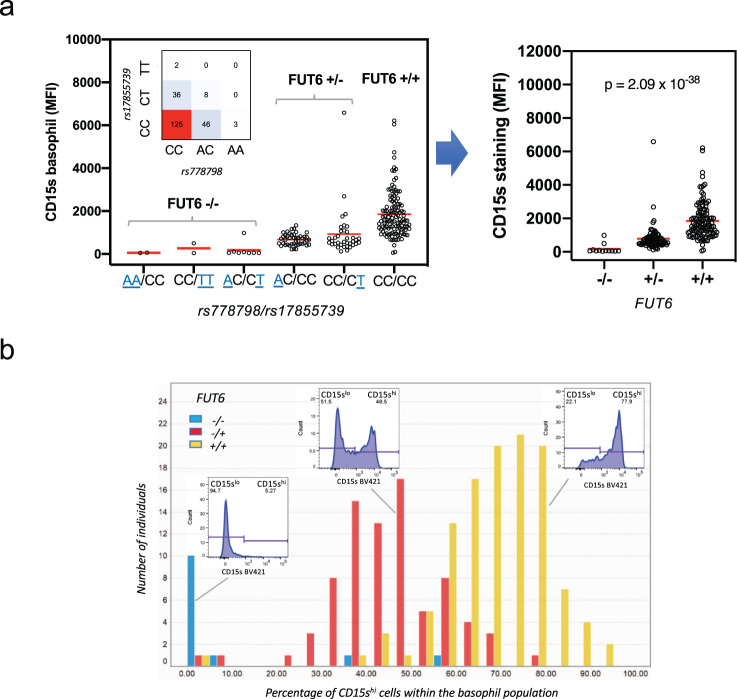
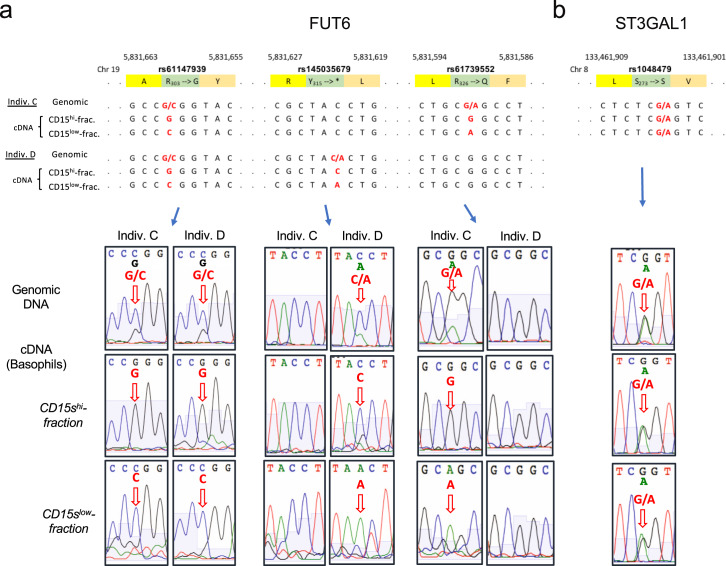
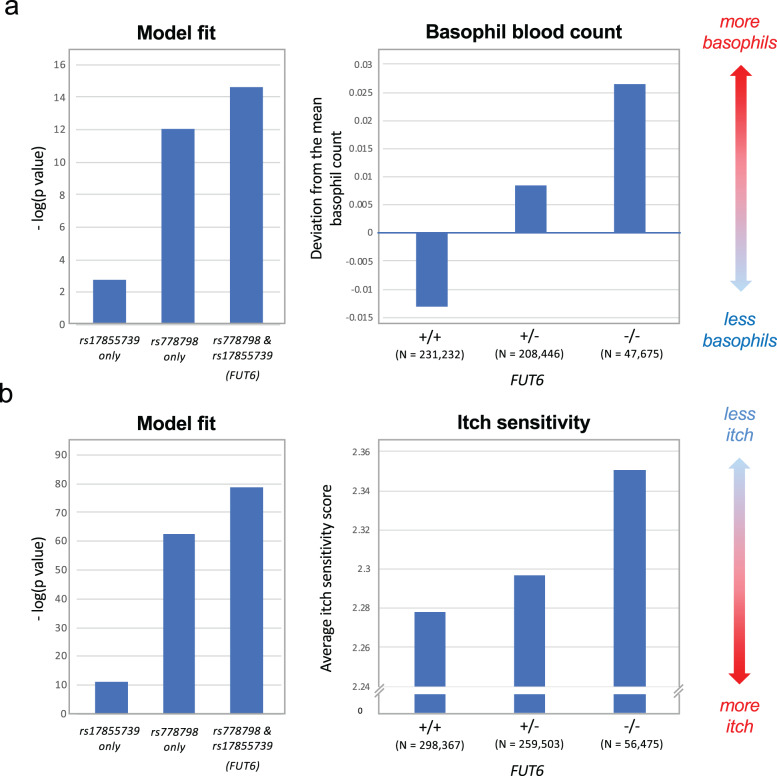
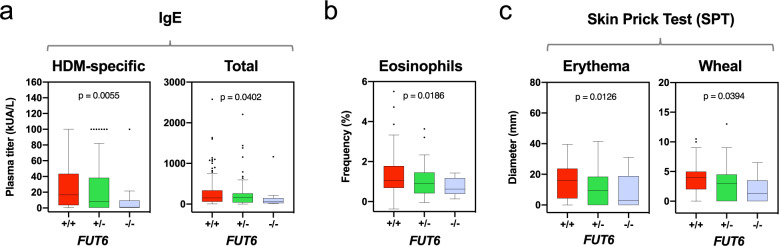
Sialyl-Lewis x (sLex, CD15s) is a tetra-saccharide on the surface of leukocytes required for E-selectin-mediated rolling, a prerequisite for leukocytes to migrate out of the blood vessels. Here we show using flow cytometry that sLex expression on basophils and mast cell progenitors depends on fucosyltransferase 6 (FUT6). Using genetic association data analysis and qPCR, the cell type-specific defect was associated with single nucleotide polymorphisms (SNPs) in the FUT6 gene region (tagged by rs17855739 and rs778798), affecting coding sequence and/or expression level of the mRNA. Heterozygous individuals with one functional FUT6 gene harbor a mixed population of sLex+ and sLex- basophils, a phenomenon caused by random monoallelic expression (RME). Microfluidic assay demonstrated FUT6-deficient basophils rolling on E-selectin is severely impaired. FUT6 null alleles carriers exhibit elevated blood basophil counts and a reduced itch sensitivity against insect bites. FUT6-deficiency thus dampens the basophil-mediated allergic response in the periphery, evident also in lower IgE titers and reduced eosinophil counts.


Conflict of interest statement

C.T., Y.J., and members of the 23andMe Research Team are employees of 23andMe, Inc. and hold stock or stock options in 23andMe. The remaining authors have no competing interests.

Figures

Fig. 1
Fig. 1. CD15s (sLex) expression on human basophils.
a CD15s staining. FACS analysis of whole-blood samples of two individuals differing in the CD15s expression on their basophils. CD15s staining is shown for neutrophils, eosinophils, basophils, and monocytes. Gray peaks represent the background staining based on “fluorescence minus one” (FMO). b Temporal stability of the CD15s pattern. The CD15s staining on basophils is shown for four individuals with either low (CD15slow), bimodal (CD15sbimodal), or high CD15s expression on basophils (CD15shigh). Two examples of bimodal expression are shown differing in the ratio between the CD15slow and the CD15shigh peak. The FACS plots indicate CD15s measurement from four different individuals between two time points. c Comparison of CD15 and CD15s expression on various leukocytes. The dot plots represent FACS profile of whole-blood samples of two individuals stained with anti-CD15 and anti-CD15s. The specific staining is shown in reference to the side scatter (SSC-A); the location of neutrophils (violet), eosinophils (green), basophils (red), monocyte (yellow), and other cells (blue) is indicated. Cell populations were defined by cell type-specific gating (Supplementary Fig. 4). d Cohort-wide distribution of CD15s and CD15 expression. The boxplots indicate the mean fluorescence intensity (MFI) of CD15s (n = 32) and CD15 (n = 29) on basophils and monocytes. Each dot represents one individual; all samples were obtained from healthy volunteers of the Singapore SSIC cohort.
Fig. 2
Fig. 2. Rolling of basophils on E-selectin-coated surfaces.
a Flow chamber experiment with basophils from CD15shigh, CD15sbimodal, and CD15slow individuals. Basophils isolated by negative selection were flushed through E-selectin-coated flow chambers. The upper panel shows the CD15s FACS profile of the isolated basophils, the lower panel a snapshot taken during their passage through the flow chamber. The dots represent adherent cells rolling on the surface, the streaks non-adherent cells carried by the stream; videos can be downloaded as Supplementary Movie 1. b Statistical analysis. The dots indicate the number of adherent basophils per field of view (FOV). Each dot represents an independent frame. The number of adherent basophils were found to be significantly different between the basophil subsets via Kruskal–Wallis test (p = 0.0007).
Fig. 3
Fig. 3. Gene expression analysis of CD15shigh and CD15slow basophils.
a FACS sorting of CD15shigh and CD15slow fraction of CD15sbimodal individuals. FACS profile and sorting gates of the CD15slow and CD15shigh basophil fraction are shown for one representative donor from six donors. b Volcano plot. The plot summarized the edgeR paired RNA-seq results of the pairs of CD15shigh vs. CD15slow fractions obtained from six CD15sbimodal donors. Each dot represents a gene and the plot displays the fold change (log2) vs. nominal p value (−log10). Boundaries for nominal and adjusted p value are indicated. c Validation by qPCR. The mRNA expression of FUT6 (n = 8) and FUT7 (n = 6) in the CD15slow and CD15shigh fraction validated by qPCR. Paired samples are connected by lines; p values are indicated. Statistical comparison was performed using Wilcoxon matched-pairs signed-rank test.
Fig. 4
Fig. 4. Genetic control of sLex expression on basophils.
a Genome-wide pQTL correlation. PBMC samples of genotyped individuals (n = 229) were analyzed by FACS. The Manhattan plot summarizes the association of the CD15s MFI of the basophils with the genotypes of the 2 million SNPs covered by this analysis. The x-axis represents the location of SNPs on the 22 autosomal chromosomes, the Y-axis the nominal p values (−log10) of their association with CD15s. A clear association was observed for SNPs on chromosome 19, which are all located proximal to the FUT6 gene. b FUT6 gene locus. The upper part of the figure displays the location of intron and exon elements of FUT6 and neighboring genes together with the density of H3K27Ac marks. The lower part indicates the location of some of the top SNPs identified in the Manhattan plot. They are arranged into two independent linkage blocks rs778798-LB and rs17855739-LB (r2 < 0.05, D’ = 1). rs778804-LB comprises only of non-coding SNPs (rs778798, rs778804, rs1531616, rs1678852, rs199921063, and rs3763045) while rs17855739-LB has also two coding SNPs (rs17855739 and rs145035679). Closely linked SNPs are connected by a horizontal line; the genetic linkage is indicated (r2 and D’); complete list of SNPs is displayed in Supplementary Data 1. c Genotype/phenotype association. The dot plots show the association of the CD15s MFI on basophils with the genotypes of rs778798 AA (n = 2), AC (n = 53), CC (n = 164), and the two coding SNPs rs17855739 (E247→K) TT (n = 2), CT (n = 45), CC (n = 173), and rs145035679 (Y315→stop) GT (n = 27), GG (n = 183), EMPTY (n = 15). Each dot represents one individual, p values are indicated. Plots were generated with the data collected for individuals of Chinese ethnicity from the SSIC cohort,. Significance was determined by Kruskal–Wallis tests.
Fig. 5
Fig. 5. Association of FUT6 null alleles with the bimodal sLex expression in basophils.
a rs778798/rs17855739-defined FUT6 states. The expression states of FUT6 can be imputed from genotypes of rs778798 and rs17855739. The left panel displays the mean fluorescence values (MFI) of the CD15s staining of basophils in reference to the rs778798/rs17855739 genotype combination (null alleles are underlined; the inset shows the number of individuals with all genotype combinations detected in the SSIC cohort). The right panel shows the MFI of the CD15s staining vs. the imputed FUT6 status (+/+, +/−, −/−). Significance was determined by Kruskal–Wallis tests. b Impact of FUT6 status on the sLex expression on basophils. The type of CD15s basophil expression by a donor (CD15slow, CD15sbimodal, CD15shigh) can be described by the percentage of CD15shigh cells within the basophil population. The histogram shows the distribution of this parameter within the SSIC cohort. The data were grouped based on the imputed FUT6 status (blue: −/− (n = 12); red: +/− (n = 81); yellow: −/− (n = 122)). Insets show representative FACS histograms of the CD15s basophil staining for each FUT6 status. Bars are binned over a range of 5%.
Fig. 6
Fig. 6. Random monoallelic expression of FUT6.
a FUT6 transcripts in basophils from the CD15shigh and CD15slow fraction. cDNAs from the CD15shigh and CD15slow basophil fraction of two CD15sbimodal individuals were isolated, and the region encoding for FUT6 amplified by PCR and sequenced. The upper panel displays the FUT6 sequence of the genomic DNA and the two cDNA regions covering three coding SNPs (rs61147939, rs145035679, and rs61739552). Each of the donors was heterozygous for two of these SNPs. Polymorphic bases are highlighted in red; base pair position as well as encoded amino acid residues are indicated. The histograms of the sequencing are displayed in the lower panels. Signals derived from polymorphic sites are indicated by red arrows. b ST3GAL1 transcripts. As a control, cDNA sequencing of ST3GAL1, a gene not known to be controlled by random monoallelic expression, is shown. The donor was heterozygous for rs1048479. Only the sequence proximal to this SNP is shown.
Fig. 7
Fig. 7. GWAS data on the association of FUT6 null alleles to blood basophil counts and itch sensitivity.
a Basophil counts. The bar chart on the left shows the negative log10 p value of the association of the basophil blood count with rs17855739, rs778798, and the FUT6 status imputed from these two SNPs (Fig. 4 and Supplementary Fig. 8). The bar chart on the right shows the genotype/phenotype correlation of the FUT6 status (+/+, +/−, −/−) on the basophil blood count of 487,409 individuals of European ancestry, expressed as deviation from the mean basophil count. The data were generated by an extension of the study by Astle et al.. b Mosquito bite-induced itch sensitivity. The bar chart on the left shows the negative log10 p value of the association of the itch sensitivity with rs17855739, rs778798, and the FUT6 status defined by both SNPs (Supplementary Fig. 8). The box plot on the right shows the genotype/phenotype correlation of the implied FUT6 status (+/+, +/−, −/−) on the average itch sensitivity score of 619,703 individuals of mostly European ancestry. The itch sensitivity score was defined by a questionnaire (0: maximum itch, 5: no itch). The data were provided by 23andMe and an extension of the study by Jones et al..
Fig. 8
Fig. 8. Association of FUT6 null alleles to allergy-related parameters.
Plots were generated with data from individuals of the SSIC cohort,. a IgE. The box and whisker plots, box representing the upper and lower quartile, central line representing the median, and the minimum and maximum values indicate the distribution of the plasma amounts of allergen-specific IgE reactive to house dust mite (HDM) (left panel) and total IgE (right panel) in reference to the imputed FUT6 status (+/+ (n = 124), +/− (n = 84), −/− (n = 14)). b Eosinophil frequency. The y-axis displays the frequency of eosinophils of the total leukocyte count. c Skin prick Test (SPT). The box and whisker plots, box representing the upper and lower quartile, central line representing the median, and the minimum and maximum values indicate the response of allergen-specific skin prick tests. The parameters displayed are the diameter of the erythema (left panel) and the wheal (right panel) induced by HDM. In all experiments, the significance was determined by Kruskal–Wallis test. The nominal p values are indicated in the figure.

References

    1. Silva M, Fung RKF, Donnelly CB, Videira PA, Sackstein R. Cell-specific variation in E-selectin ligand expression among human peripheral blood mononuclear cells: implications for immunosurveillance and pathobiology. J. Immunol. 2017;198:3576–3587. doi: 10.4049/jimmunol.1601636. - DOI - PMC - PubMed
    1. Miyara M, et al. Sialyl Lewis x (CD15s) identifies highly differentiated and most suppressive FOXP3 high regulatory T cells in humans. Proc. Natl Acad. Sci. USA. 2015;112:7225–7230. doi: 10.1073/pnas.1508224112. - DOI - PMC - PubMed
    1. Foxall C. The three members of the selectin receptor family recognize a common carbohydrate epitope, the sialyl Lewis(x) oligosaccharide. J. Cell Biol. 1992;117:895–902. doi: 10.1083/jcb.117.4.895. - DOI - PMC - PubMed
    1. Sackstein R. The bone marrow is akin to skin: HCELL and the biology of hematopoietic stem cell homing. J. Invest. Dermatol. 2004;122:1061–1069. doi: 10.1111/j.0022-202X.2004.09301.x. - DOI - PubMed
    1. Shade K-TC, et al. Sialylation of immunoglobulin E is a determinant of allergic pathogenicity. Nature. 2020;582:1–26. doi: 10.1038/s41586-020-2311-z. - DOI - PMC - PubMed

Publication types