Review
. 2021 Aug;16(8):3802-3835.
doi: 10.1038/s41596-021-00556-8. Epub 2021 Jul 2.

CODEX multiplexed tissue imaging with DNA-conjugated antibodies

Affiliations
Review

CODEX multiplexed tissue imaging with DNA-conjugated antibodies

Sarah Black et al. Nat Protoc. 2021 Aug.

Abstract

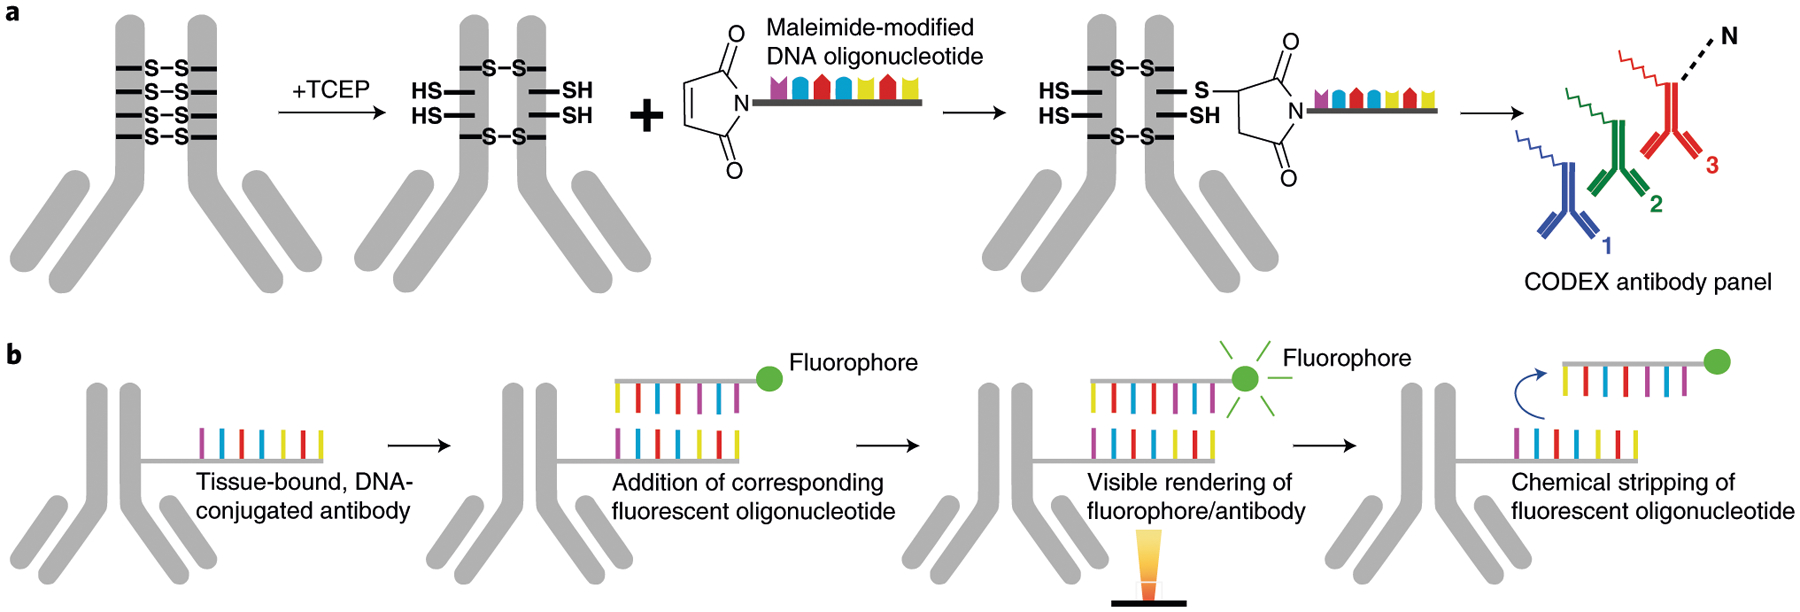
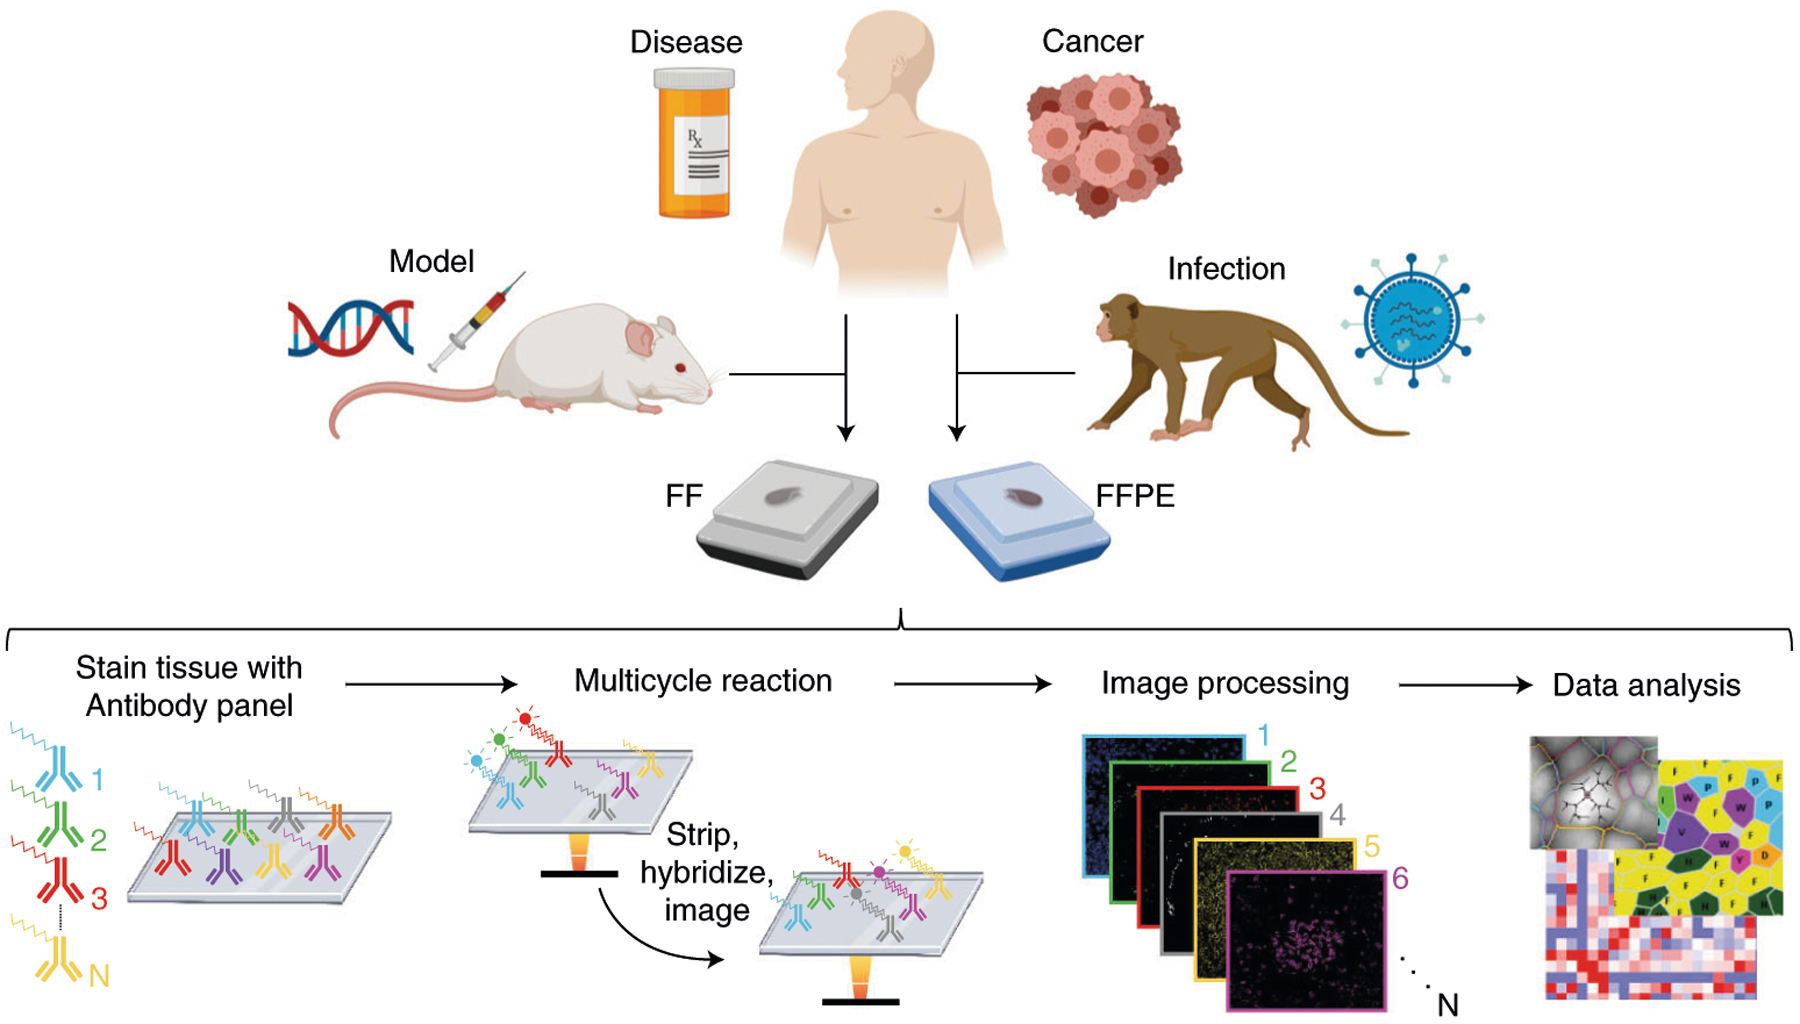
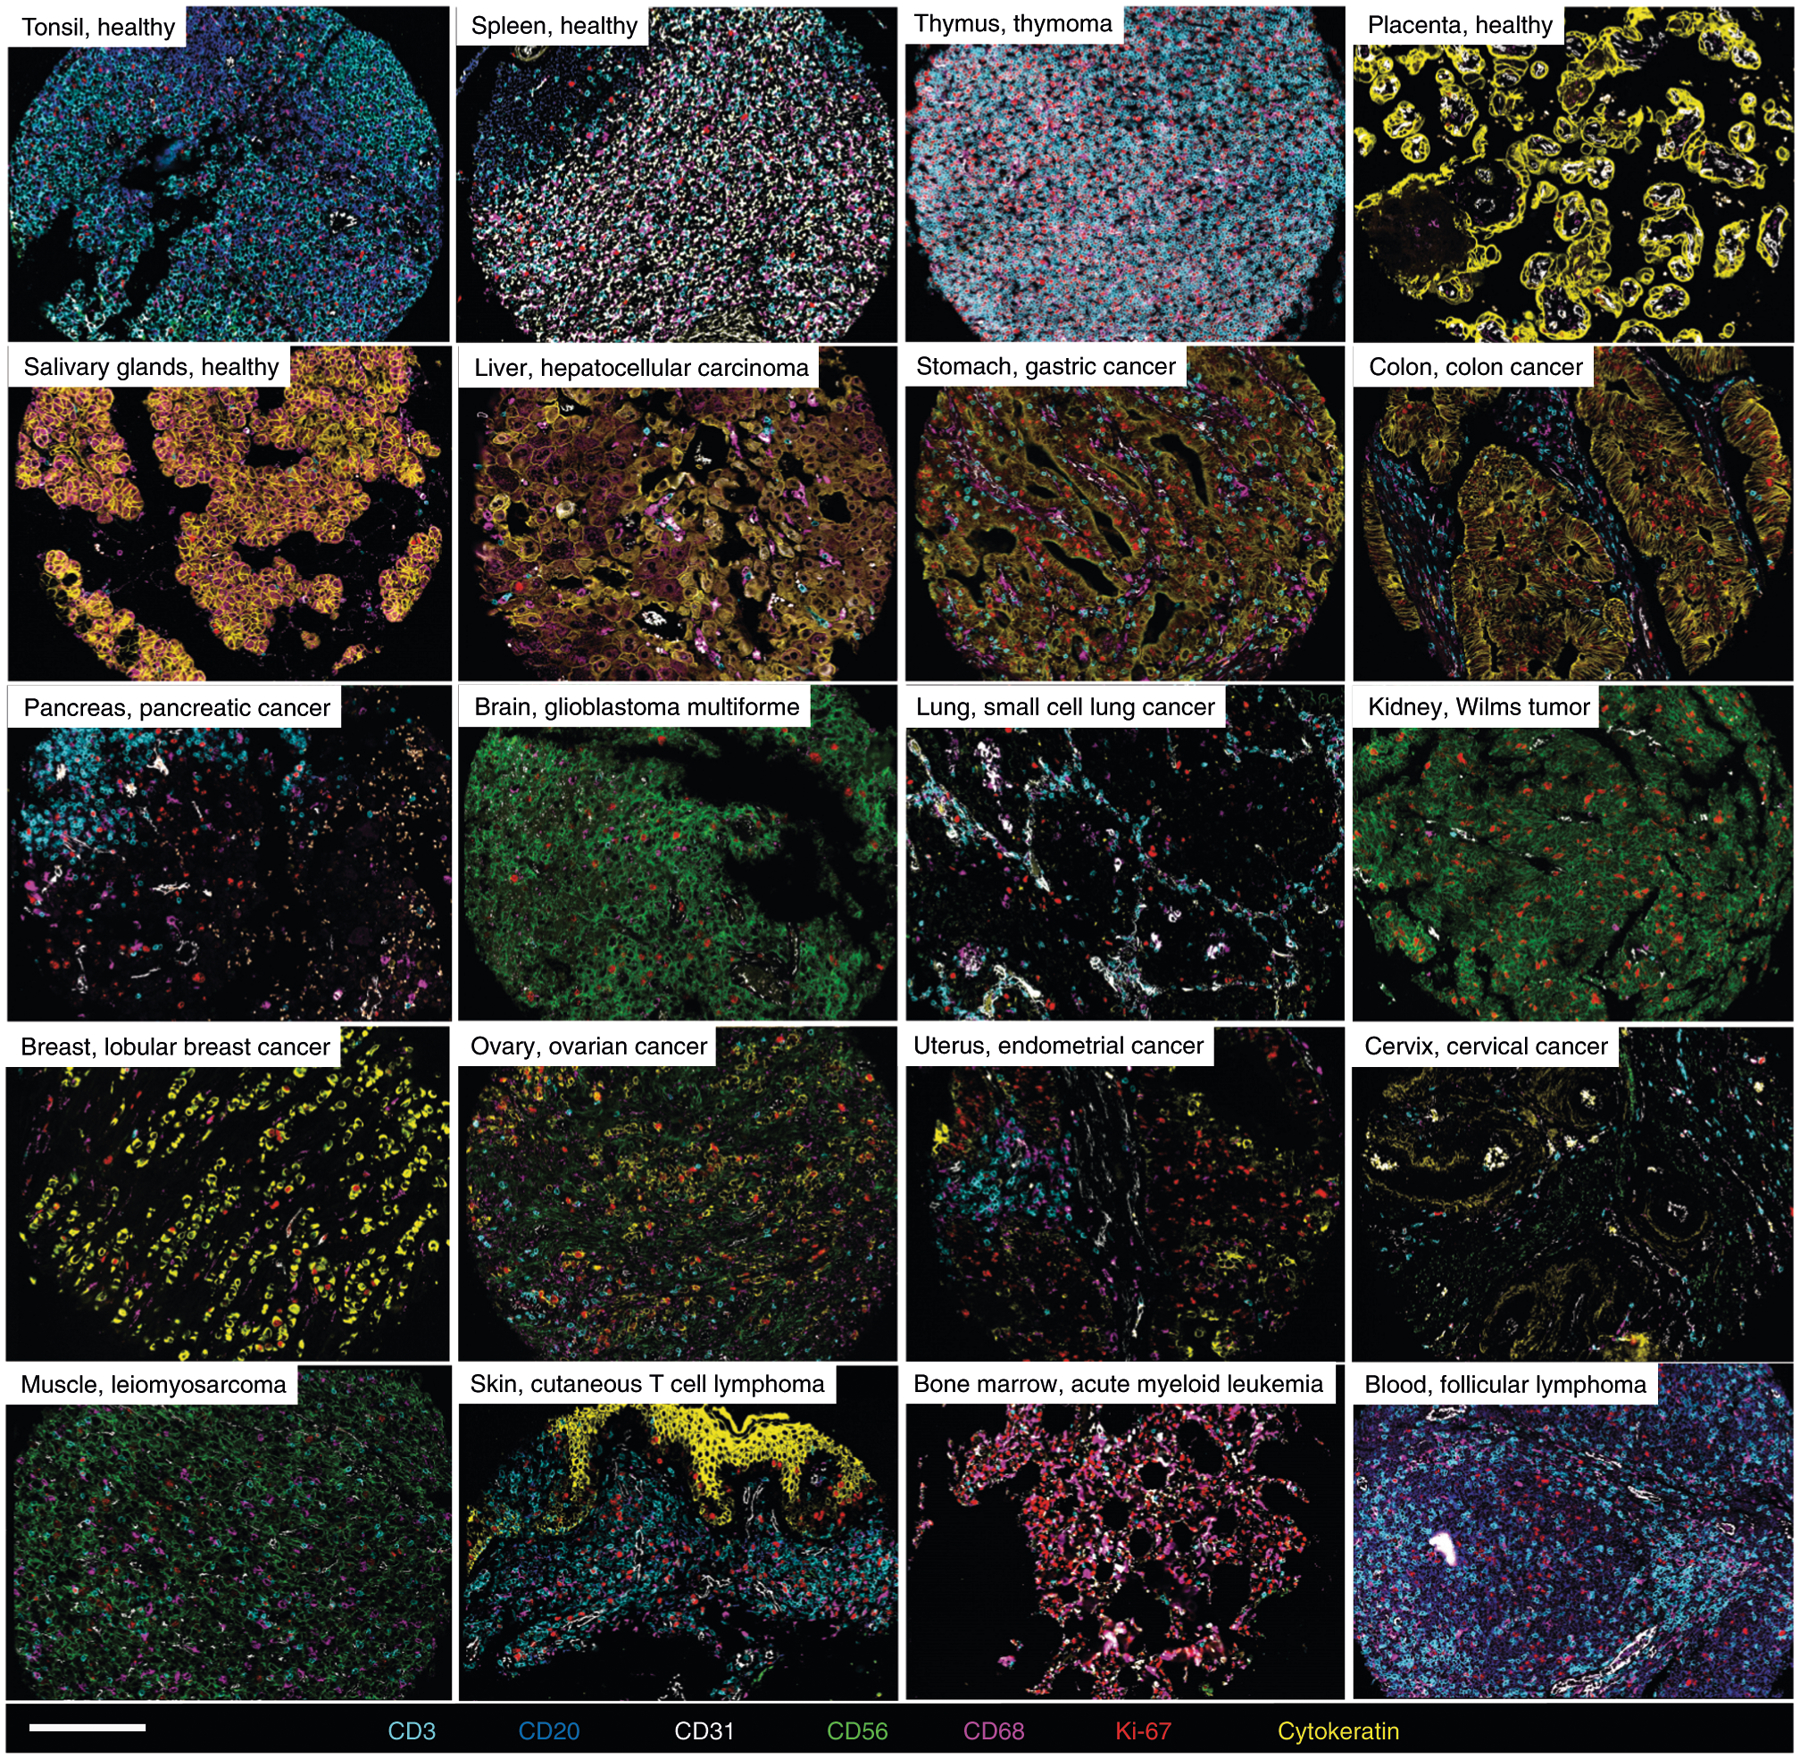
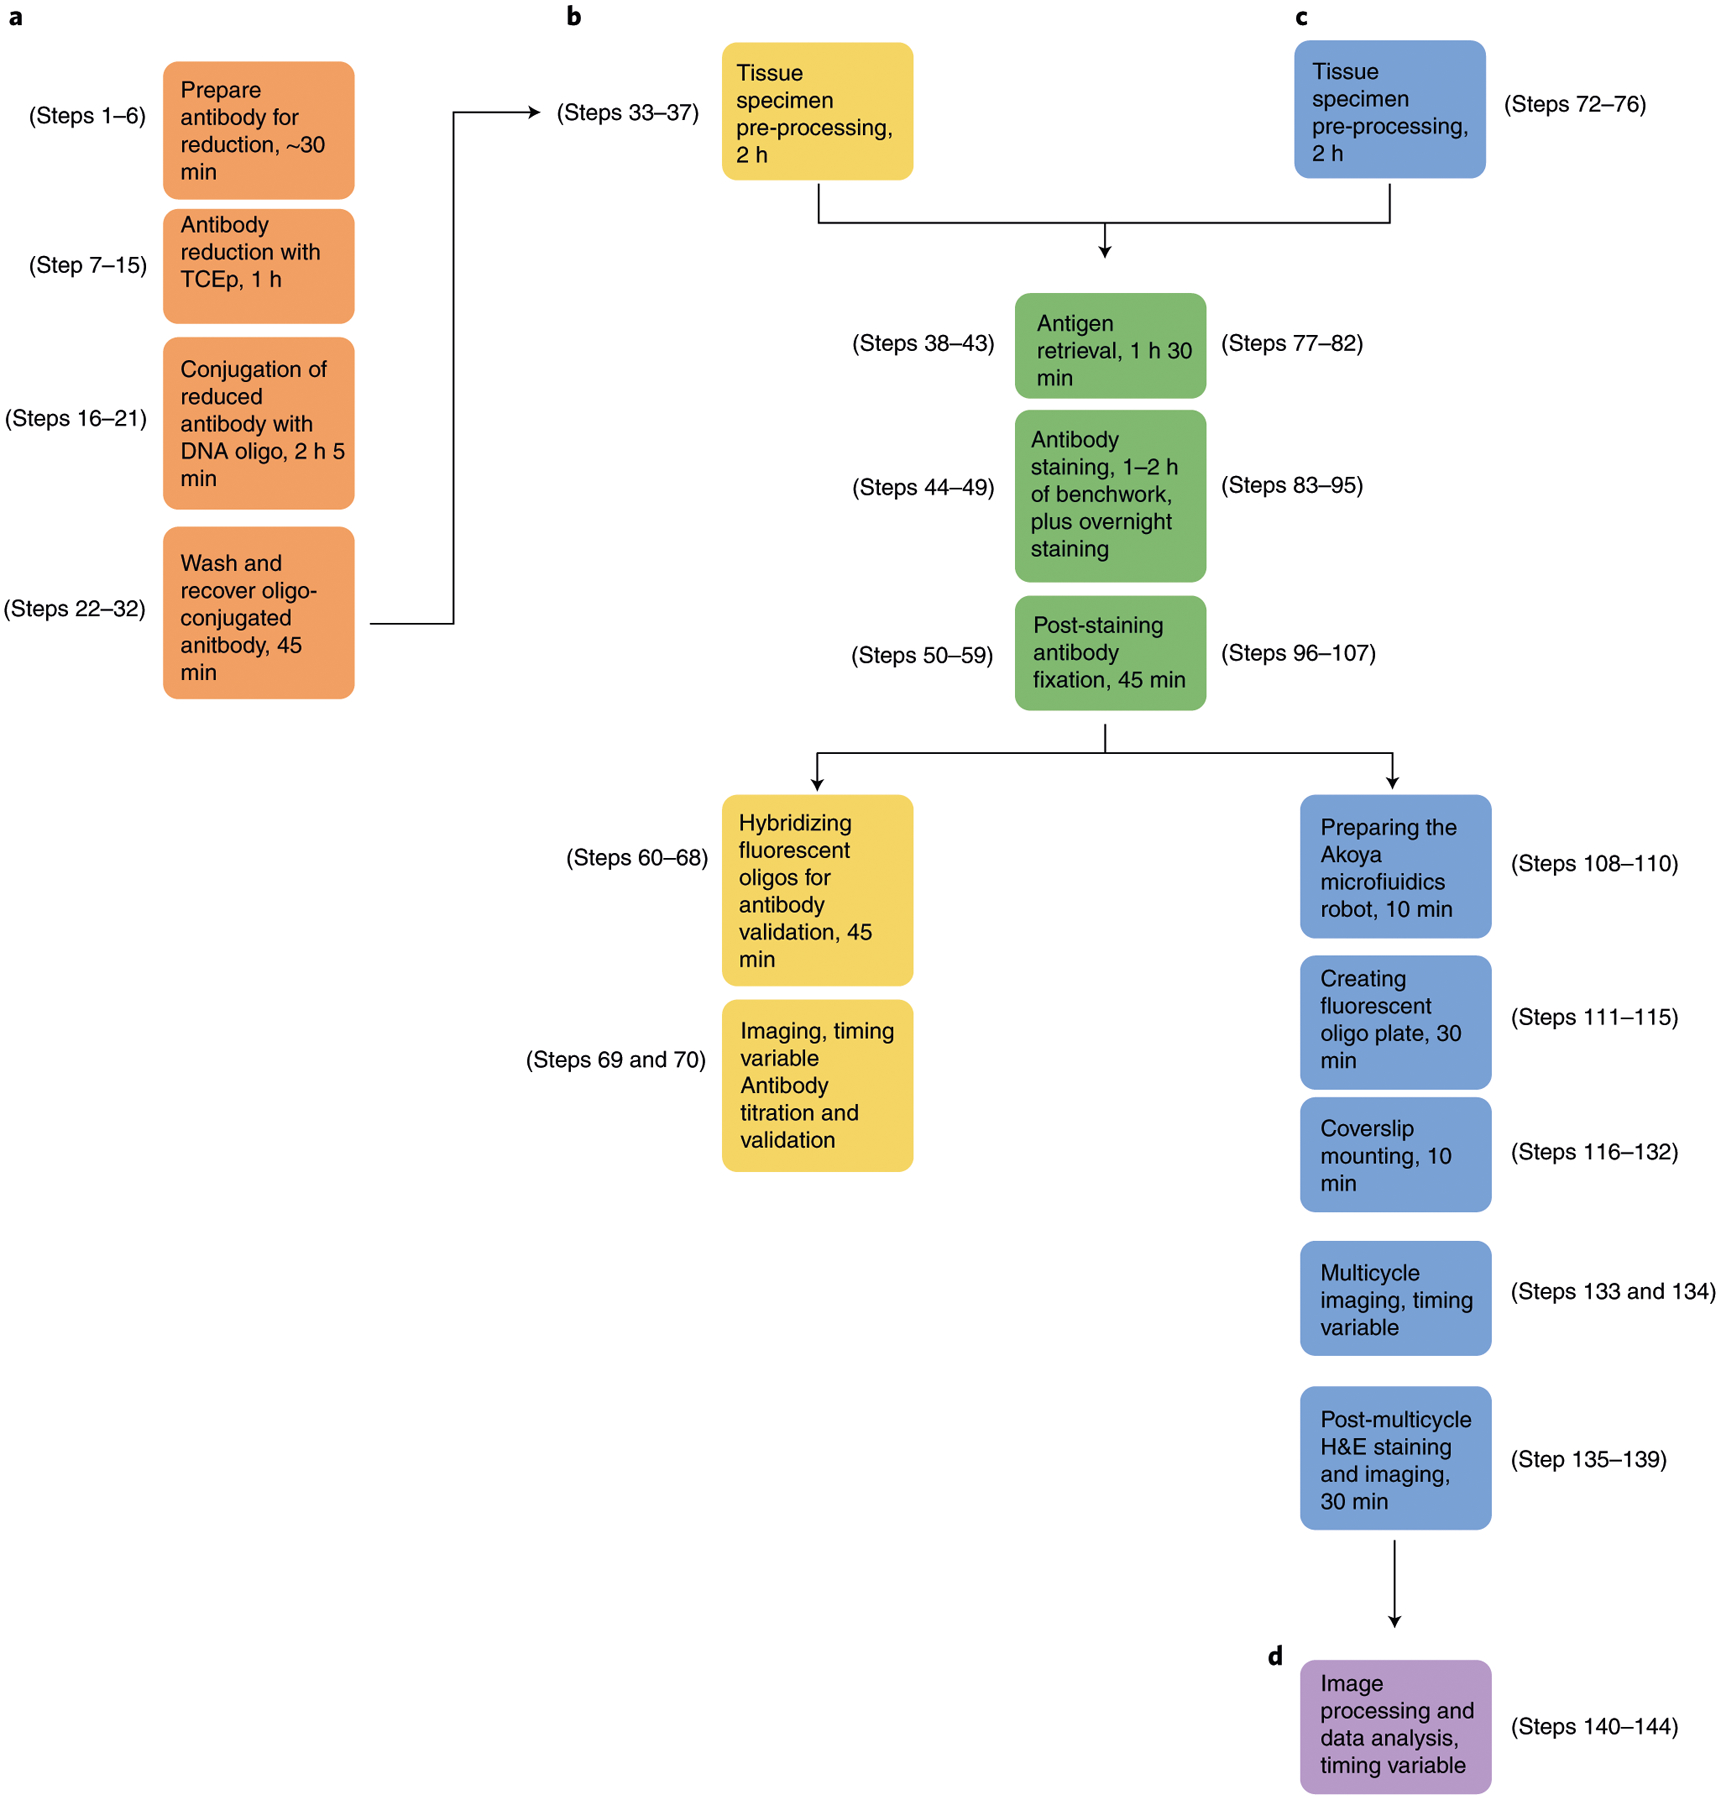
Advances in multiplexed imaging technologies have drastically improved our ability to characterize healthy and diseased tissues at the single-cell level. Co-detection by indexing (CODEX) relies on DNA-conjugated antibodies and the cyclic addition and removal of complementary fluorescently labeled DNA probes and has been used so far to simultaneously visualize up to 60 markers in situ. CODEX enables a deep view into the single-cell spatial relationships in tissues and is intended to spur discovery in developmental biology, disease and therapeutic design. Herein, we provide optimized protocols for conjugating purified antibodies to DNA oligonucleotides, validating the conjugation by CODEX staining and executing the CODEX multicycle imaging procedure for both formalin-fixed, paraffin-embedded (FFPE) and fresh-frozen tissues. In addition, we describe basic image processing and data analysis procedures. We apply this approach to an FFPE human tonsil multicycle experiment. The hands-on experimental time for antibody conjugation is ~4.5 h, validation of DNA-conjugated antibodies with CODEX staining takes ~6.5 h and preparation for a CODEX multicycle experiment takes ~8 h. The multicycle imaging and data analysis time depends on the tissue size, number of markers in the panel and computational complexity.


Figures

Extended Data Fig. 1 |
Extended Data Fig. 1 |. Tissue morphology conserved over multicycle imaging.
One tile of the CODEX multicycle for the human tonsil was segmented by using the CODEXSegm software and the nuclear stain for cycle 1 or cycle 26 (nuclear images on the top; segmentation masks on the bottom). For both instances, 2,464 cells were identified. Scale bar, 100 μm.
Extended Data Fig. 2 |
Extended Data Fig. 2 |. Analysis of healthy and cancerous tissue morphology during multicycle imaging.
a, H&E image of a healthy spleen. Scale bar, 200 μm. b, Corresponding nuclear (Hoechst) stained image and cellular segmentation (Seg) mask. Scale bar, 200 μm. c, Zoomed-in nuclear stained image and cellular segmentation mask from cycle 2. Scale bar, 20 μm (Extended Data Applied Sciences 28 April 2020). d, Zoomed-in nuclear stained image and cellular segmentation mask from cycle 22. Scale bar, 200 μm. e, Line plot of total cell count per tissue microarray core, measured at cycles 1, 2, 8, 14 and 22, for five healthy tissues. Lines are colored according to the corresponding legend. f, H&E image of stomach cancer. Scale bar, 200 μm. g, Corresponding nuclear (Hoechst) stained image and cellular segmentation mask. Scale bar, 200 μm. h, Zoomed-in nuclear stained image and cellular segmentation mask from cycle 2. Scale bar, 20 μm. i, Zoomed-in nuclear stained image and cellular segmentation mask from cycle 22. Scale bar, 200 μm. j, Line plot of total cell count per tissue microarray core, measured at cycles 1, 2, 8, 14 and 22, for five cancer tissues. Lines are colored according to the corresponding legend.
Fig. 1 |
Fig. 1 |. Key components of the CODEX technology.
a, Antibody conjugation consists of partially reducing disulfide bonds in the IgG antibody with tris [2-carboxyethyl]phosphine (TCEP) (Steps 7–14), incubating with a unique maleimide-modified DNA oligonucleotide (Steps 16–21) and purifying the DNA-conjugated antibody (Steps 22–32). To create a CODEX antibody panel, unique DNA oligonucleotides are conjugated for up to 57 antibody targets of interest. b, Implementation of CODEX involves staining a tissue section with a unique DNA-conjugated antibody (Steps 71–107), adding the corresponding fluorescent oligonucleotide (Steps 111–115), hybridizing this fluorophore with the conjugated antibody and visualizing it with light microscopy, chemical stripping of the fluorescently tagged oligonucleotide from the tissue and iteratively repeating this process for all antibodies in the panel (Steps 133 and 134).
Fig. 2 |
Fig. 2 |. CODEX pipeline.
FFPE or FF tissue samples are stained with the antibody panel (Steps 71–107), a multicycle reaction is performed (i.e., iteratively imaging up to three antibodies and a nuclear stain per cycle, chemical stripping, hybridizing and re-imaging for all antibodies in the panel) (Steps 133 and 134), the raw images are computationally processed (Step 140) and data analysis is performed (Steps 141–144).
Fig. 3 |
Fig. 3 |. Human FFPE tissues imaged with CODEX.
Representative images of 16 healthy and diseased tissues imaged with CODEX, highlighting seven markers—CD3, CD20, CD31, CD56, CD68, Ki-67 and cytokeratin—that are colored according to the bottom panel. Written informed consent was obtained from all patients. All samples were fully de-identified, and the study was exempt from ethics approval (no human subjects research). Scale bar, 200 μm.
Fig. 4 |
Fig. 4 |. Evolution of the CODEX technology.
a, The prototype microfluidics device, showing tubing connections to the sample contained in a Keyence microscope. b, The early access version of the Akoya Biosciences microfluidics device. c, The commercially available Akoya Biosciences microfluidics device.
Fig. 5 |
Fig. 5 |. Timing for the key elements of a CODEX experiment.
a, Steps 1–32 for conjugating DNA oligonucleotides to purified antibodies, as seen in the orange boxes. b, Steps 33–70 for validating and titrating antibodies in FFPE and FF tissue specimens, as seen in the yellow and green boxes. c, Steps 72–139 for performing a CODEX multicycle reaction, as seen in the blue and green boxes. d, Steps 140–144 for image processing and data analysis, as seen in the purple box.
Fig. 6 |
Fig. 6 |. Components required for the CODEX experiment.
a, A black plate with aluminum sealing film, containing the fluorescent oligonucleotides. b, An acrylic plate oriented with the notch at the bottom right corner (red circle). c, A DMSO-resistant mounting gasket. d, An acrylic plate with a secured coverslip. e, A mounted acrylic plate and secured coverslip within the inverted fluorescence microscope, with attached delivery and vacuum ports.
Fig. 7 |
Fig. 7 |. Parameters for processing raw microscope images by using the CODEX Uploader.
These include tissue size (i.e., region width and height), degree of tile overlap (0% if only imaging a single tile compared with 30% if the tissue size is greater than one tile) and the optional selection of deconvolution, background subtraction and H&E staining. These parameters will change for each experiment.
Fig. 8 |
Fig. 8 |. Starting parameters for performing single-cell segmentation on the uploaded data by using the CODEX Segmenter.
These include cell radius, max/min/relative cutoff, cell size cutoff factor, nuclear stain channel/cycle and if desired, membrane stain channel/cycle (in general, this parameter is not used, and thus the cycle is −1). These parameters will change for each experiment.
Fig. 9 |
Fig. 9 |. Cleanup gating of segmented data.
First, nucleated cells are gated by using Hoechst and DRAQ5 nuclear stains (left plot). Then, cells are gated on the basis of the Z-position of the best focal planes (right plot).
Fig. 10 |
Fig. 10 |. Starting parameters for performing cell-type annotation on cleaned data by using VorteX.
These include not using numerical transformation, noise thresholding, feature re-scaling or normalization. The distance measure is angular, with density estimate N nearest neighbor spanning from 150 to 5, with 30 steps. These parameters can be adjusted as needed.
Fig. 11 |
Fig. 11 |. Validation of CODEX antibody staining.
a, Successful antibody validation of Ki-67 staining of a human FFPE tonsil by manual IHC (left panel), CODEX single staining with the conjugated antibody (middle panel) and robotic IHC from The Protein Atlas (right panel). b, Comparison stainings of the mB220 conjugated-antibody with an unsuccessful (left panel; incorrect nuclear staining of many cells secondary to an adverse antibody-oligonucleotide combination) and successful (right panel; correct membrane staining of B cells) outcome. Both stainings were performed at a 1:100 dilution and 1/6-s exposure time. Written informed consent was obtained from all patients. All samples were fully de-identified, and the study was exempt from ethics approval (no human subjects research). For mouse studies, appropriate institutional regulatory board permission was obtained. Scale bars, 100 μm.
Fig. 12 |
Fig. 12 |. Results from a CODEX multicycle experiment of human FFPE tonsil.
a, Seven-color fluorescent overlay image showing Hoechst, CD3, CD15, CD20, CD206, MUC-1 and podoplanin (colored according to the bottom panel) of a region of 7 × 9 tiles of tonsil; the zoomed-in green boxes show an H&E image and CODEX fluorescent image at higher resolution. b, A zoomed-in Voronoi diagram of the 10 unsupervised clusters obtained from the VorteX interface. c, The average expression profiles of CD4+ T cells, B cells and epithelial cells are shown, and a zoomed-in region (orange box) maps these clusters onto the tissue by using FIJI, with blue crosses representing CD4+ T cells, red crosses representing B cells and green crosses representing epithelial cells (gray bars in the clustering interface show other cluster profiles not highlighted here). The y axis of the graph represents the average fluorescent intensity of the cells within each cluster; the graph was cropped to zoom in on a subset of markers used in CODEX. d, A minimal spanning tree of the 10 identified clusters, with the size of each circle corresponding to the relative size of the cluster across the tissue and the color representing the average expression of CD3 in quantile scale. Written informed consent was obtained from all patients. All samples were fully de-identified, and the study was exempt from ethics approval (no human subjects research). Yellow scale bars, 100 μm. White scale bar, 500 μm. NK, natural killer; Tregs, regulatory CD4+ T cells.

References

    1. Goltsev Y et al. Deep profiling of mouse splenic architecture with CODEX multiplexed imaging. Cell 174, 968–981.e15 (2018). - PMC - PubMed
    1. Schürch CM et al. Coordinated cellular neighborhoods orchestrate antitumoral immunity at the colorectal cancer invasive front. Cell 182, 1341–1359.e19 (2020). - PMC - PubMed
    1. Kennedy-Darling J et al. Highly multiplexed tissue imaging using repeated oligonucleotide exchange reaction. Eur. J. Immunol 51, 1262–1277 (2021). - PMC - PubMed
    1. Huang W, Hennrick K & Drew S A colorful future of quantitative pathology: validation of Vectra technology using chromogenic multiplexed immunohistochemistry and prostate tissue microarrays. Hum. Pathol 44, 29–38 (2013). - PubMed
    1. Lin JR et al. Highly multiplexed immunofluorescence imaging of human tissues and tumors using t-CyCIF and conventional optical microscopes. eLife 7, 31657 (2018). - PMC - PubMed

Related links

    1. Schürch CM et al. Cell 182, 1341–1359.e19 (2020): 10.1016/j.cell.2020.07.005 - DOI - PMC - PubMed

Publication types