. 2021 Aug 5;81(15):3128-3144.e7.
doi: 10.1016/j.molcel.2021.06.011. Epub 2021 Jul 2.

Replication gaps are a key determinant of PARP inhibitor synthetic lethality with BRCA deficiency

Affiliations

Replication gaps are a key determinant of PARP inhibitor synthetic lethality with BRCA deficiency

Ke Cong et al. Mol Cell. .

Erratum in

Abstract

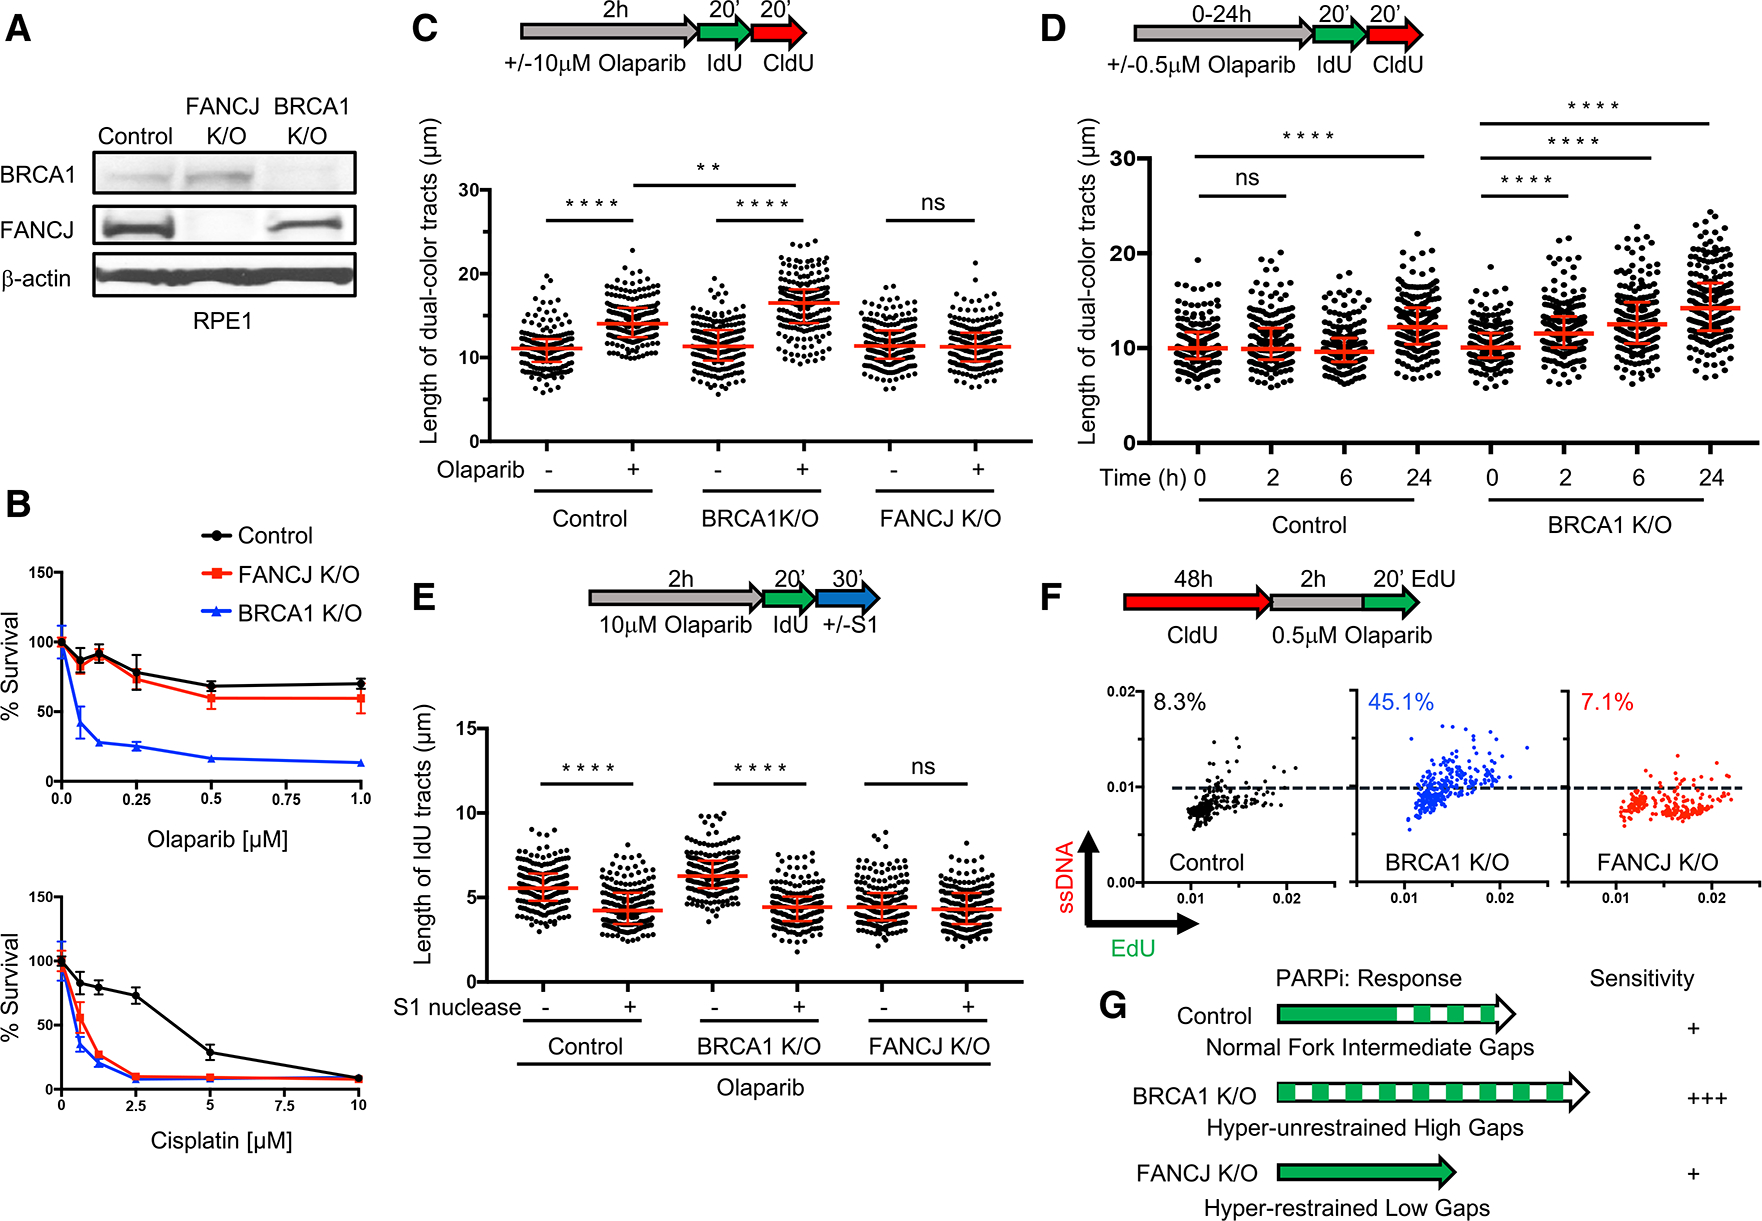
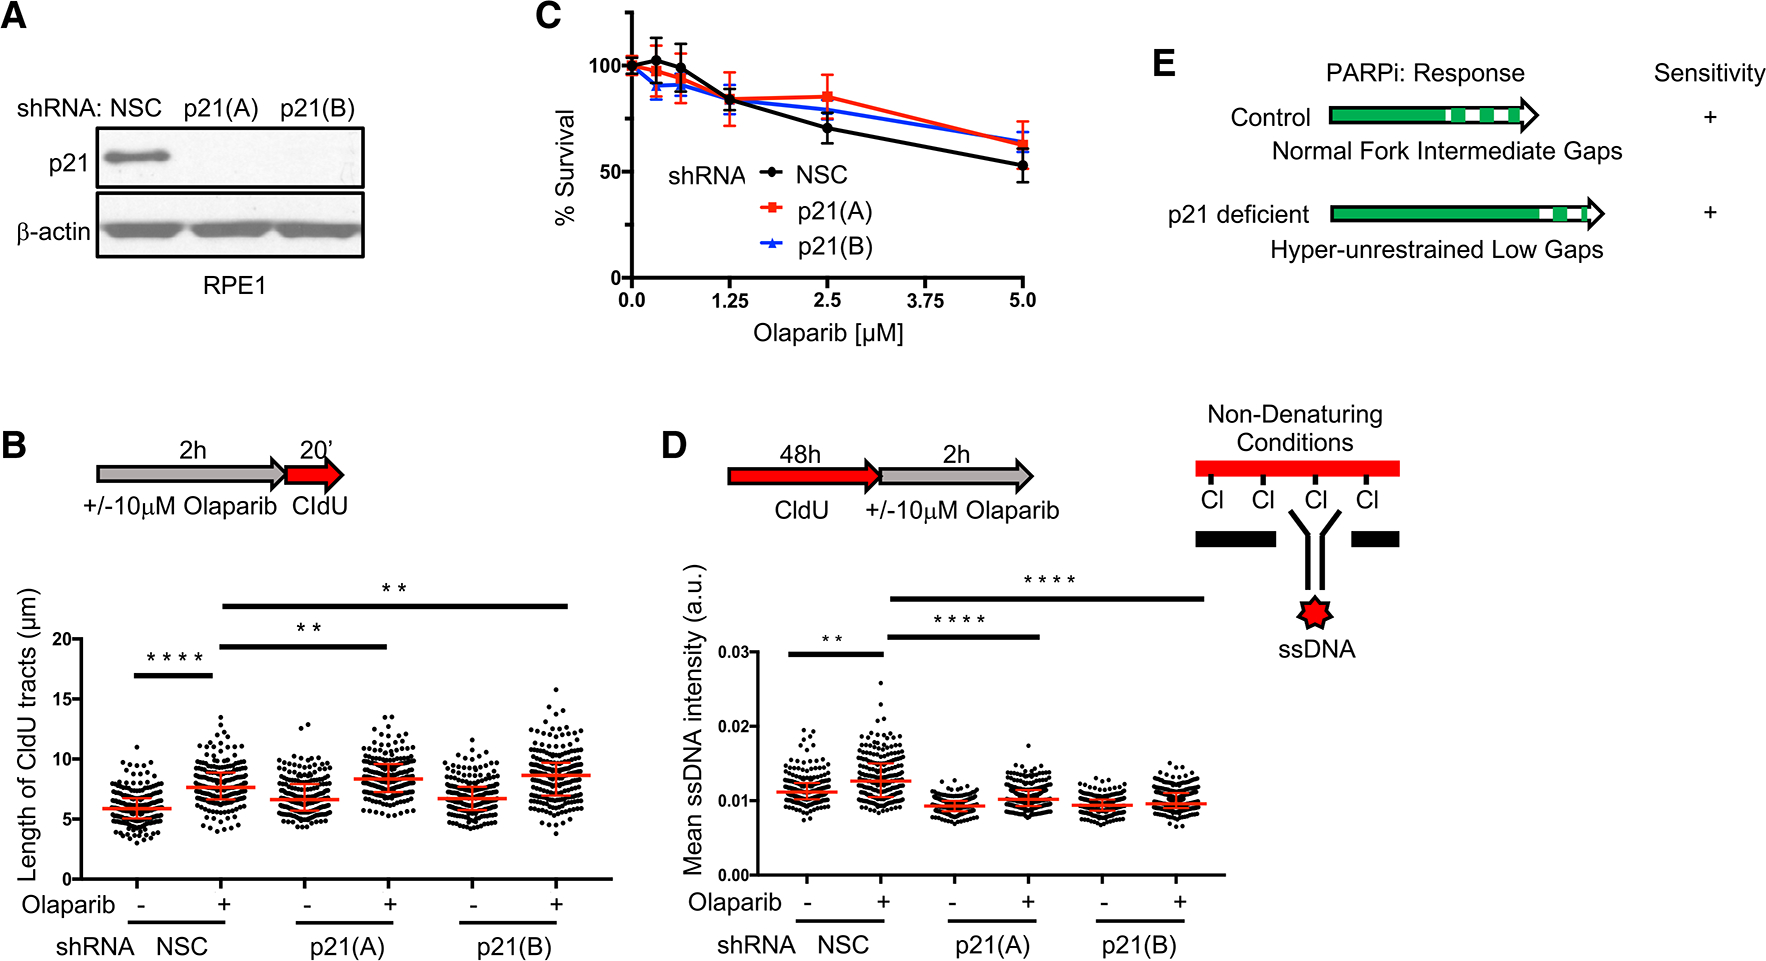
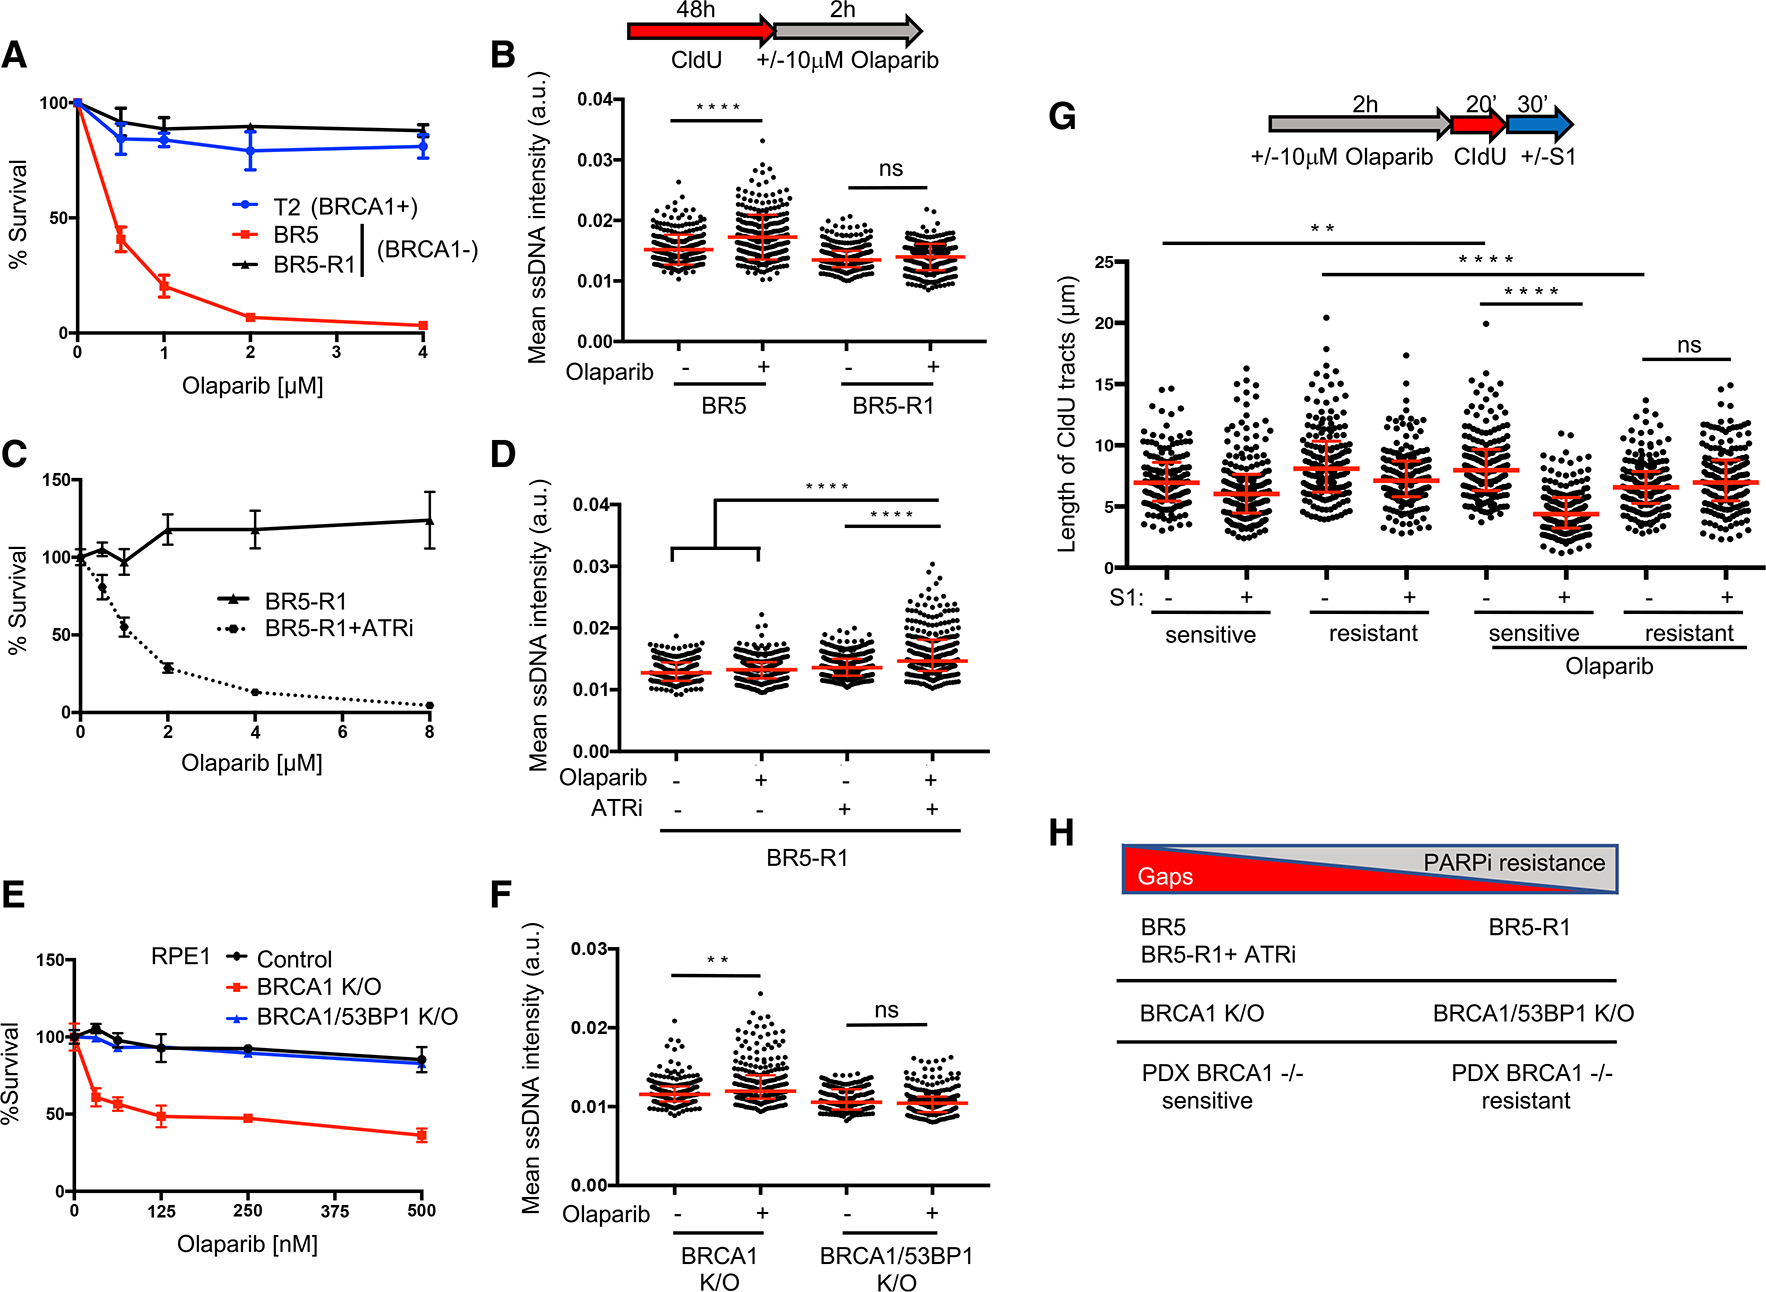
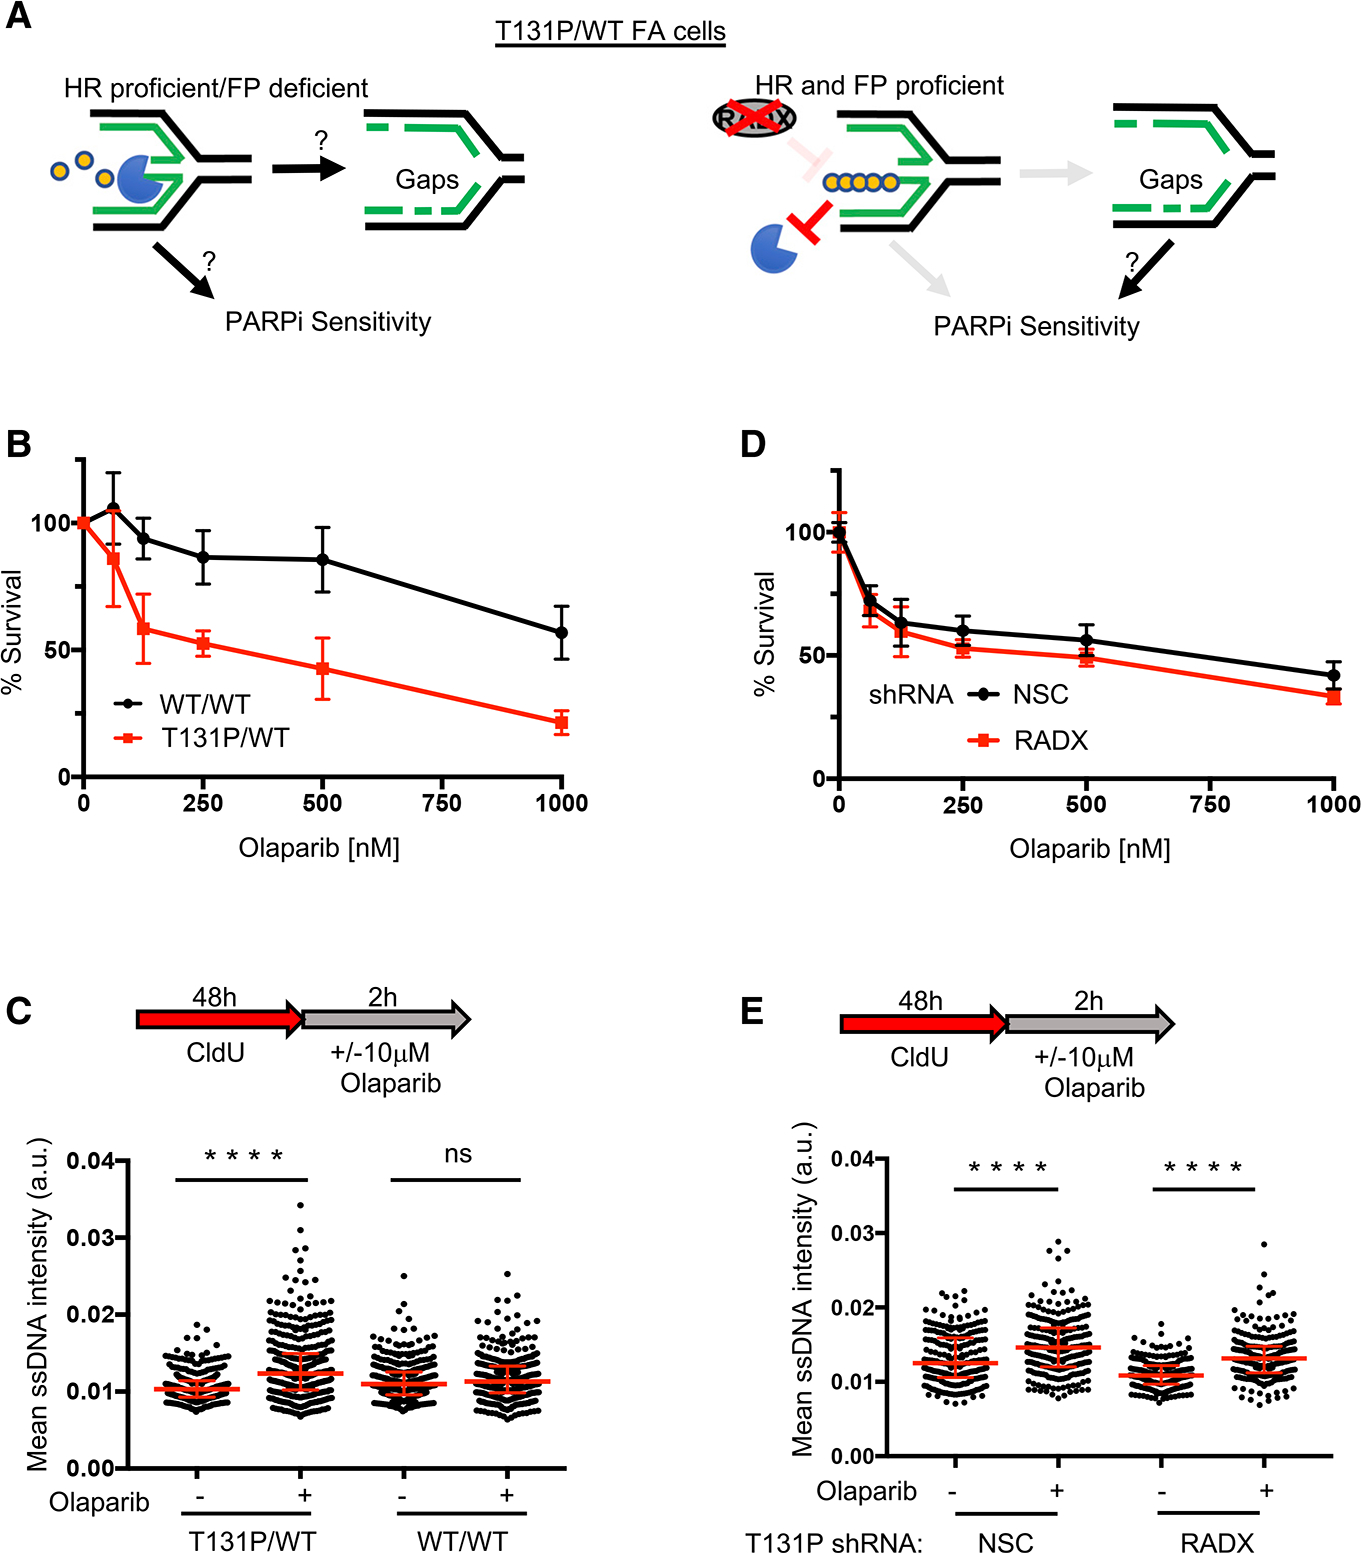
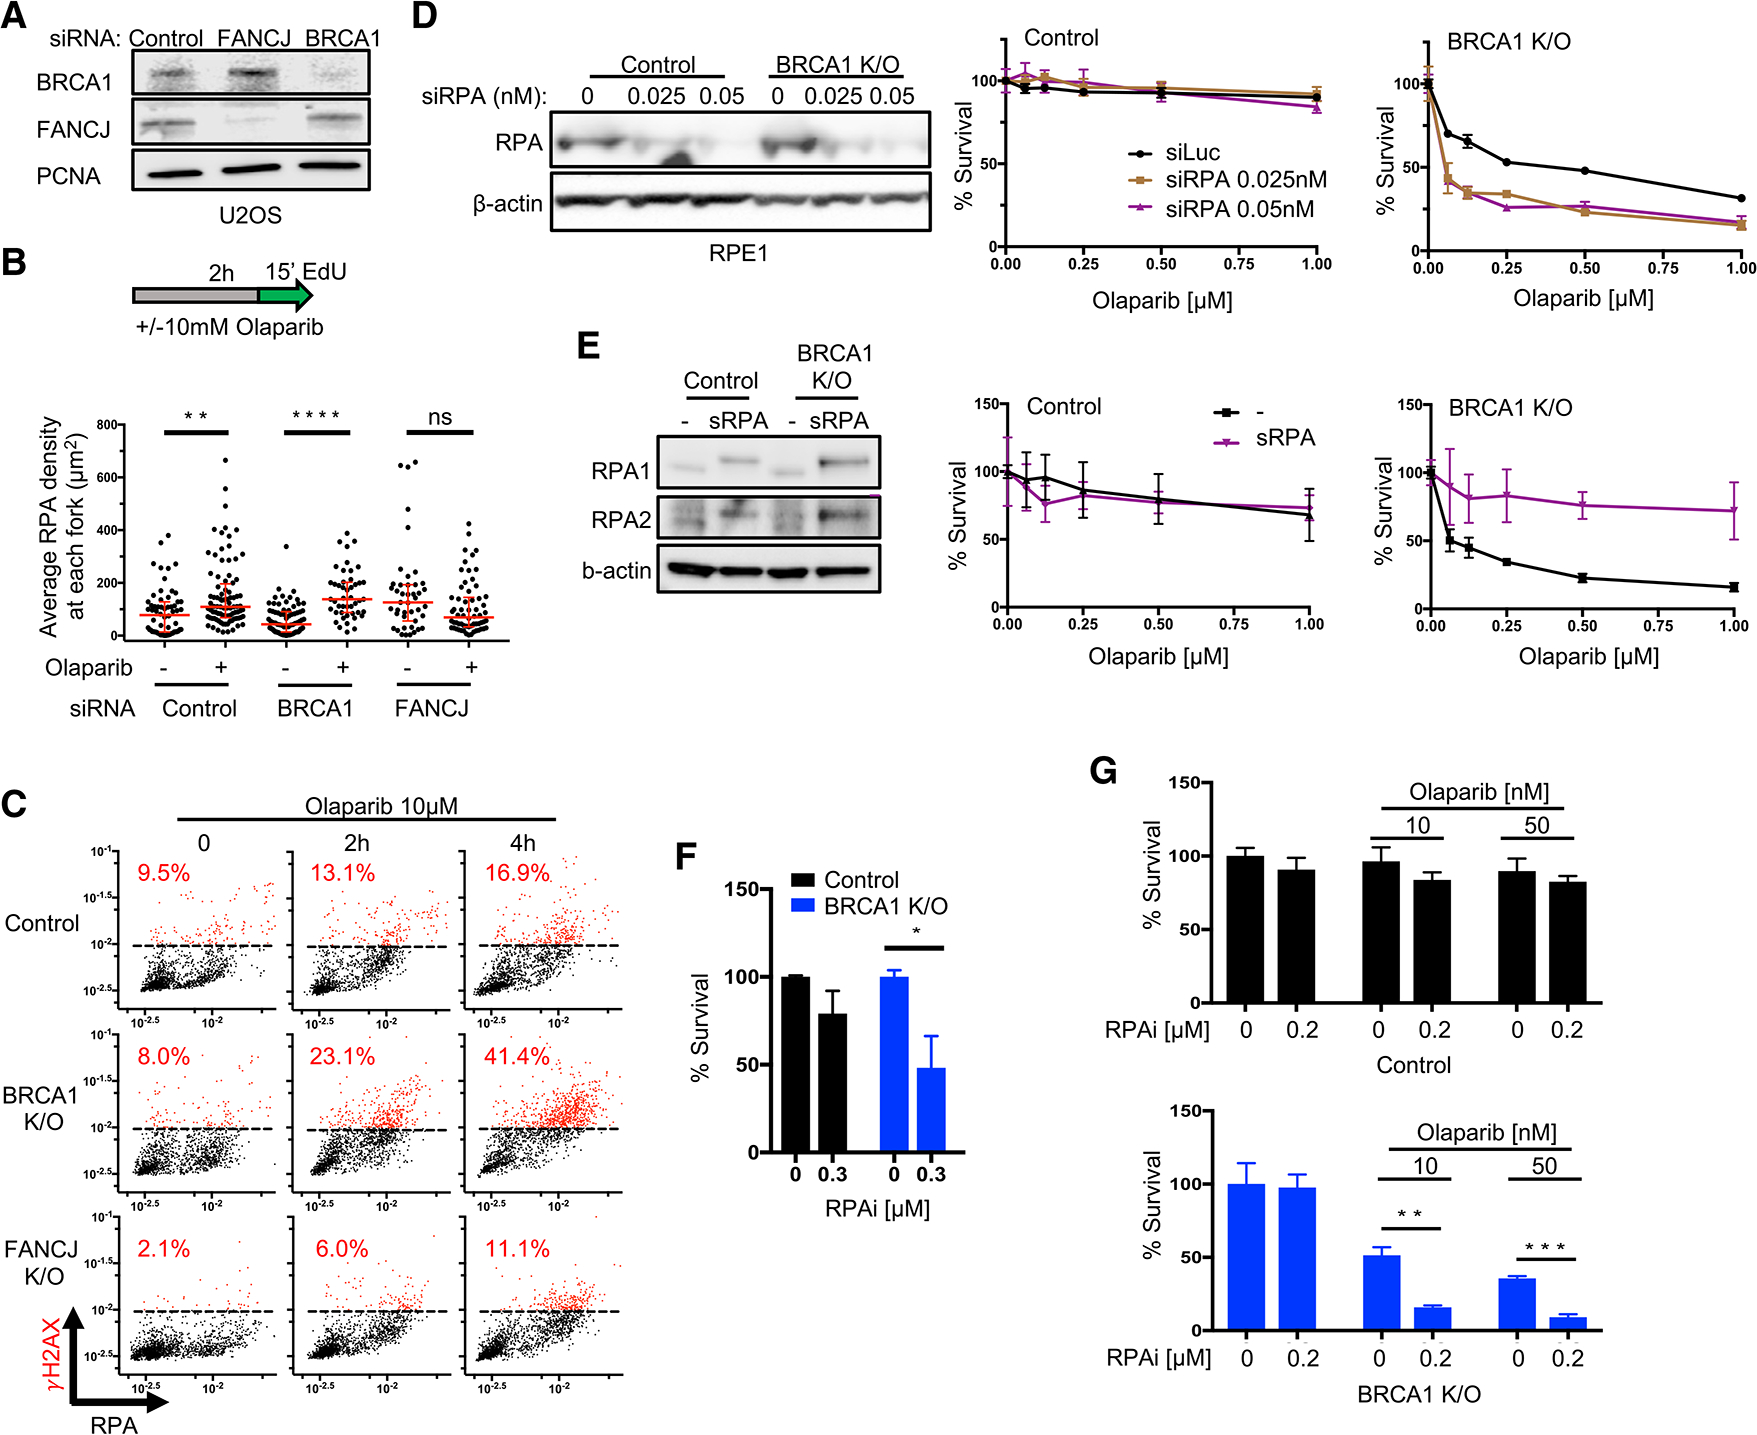
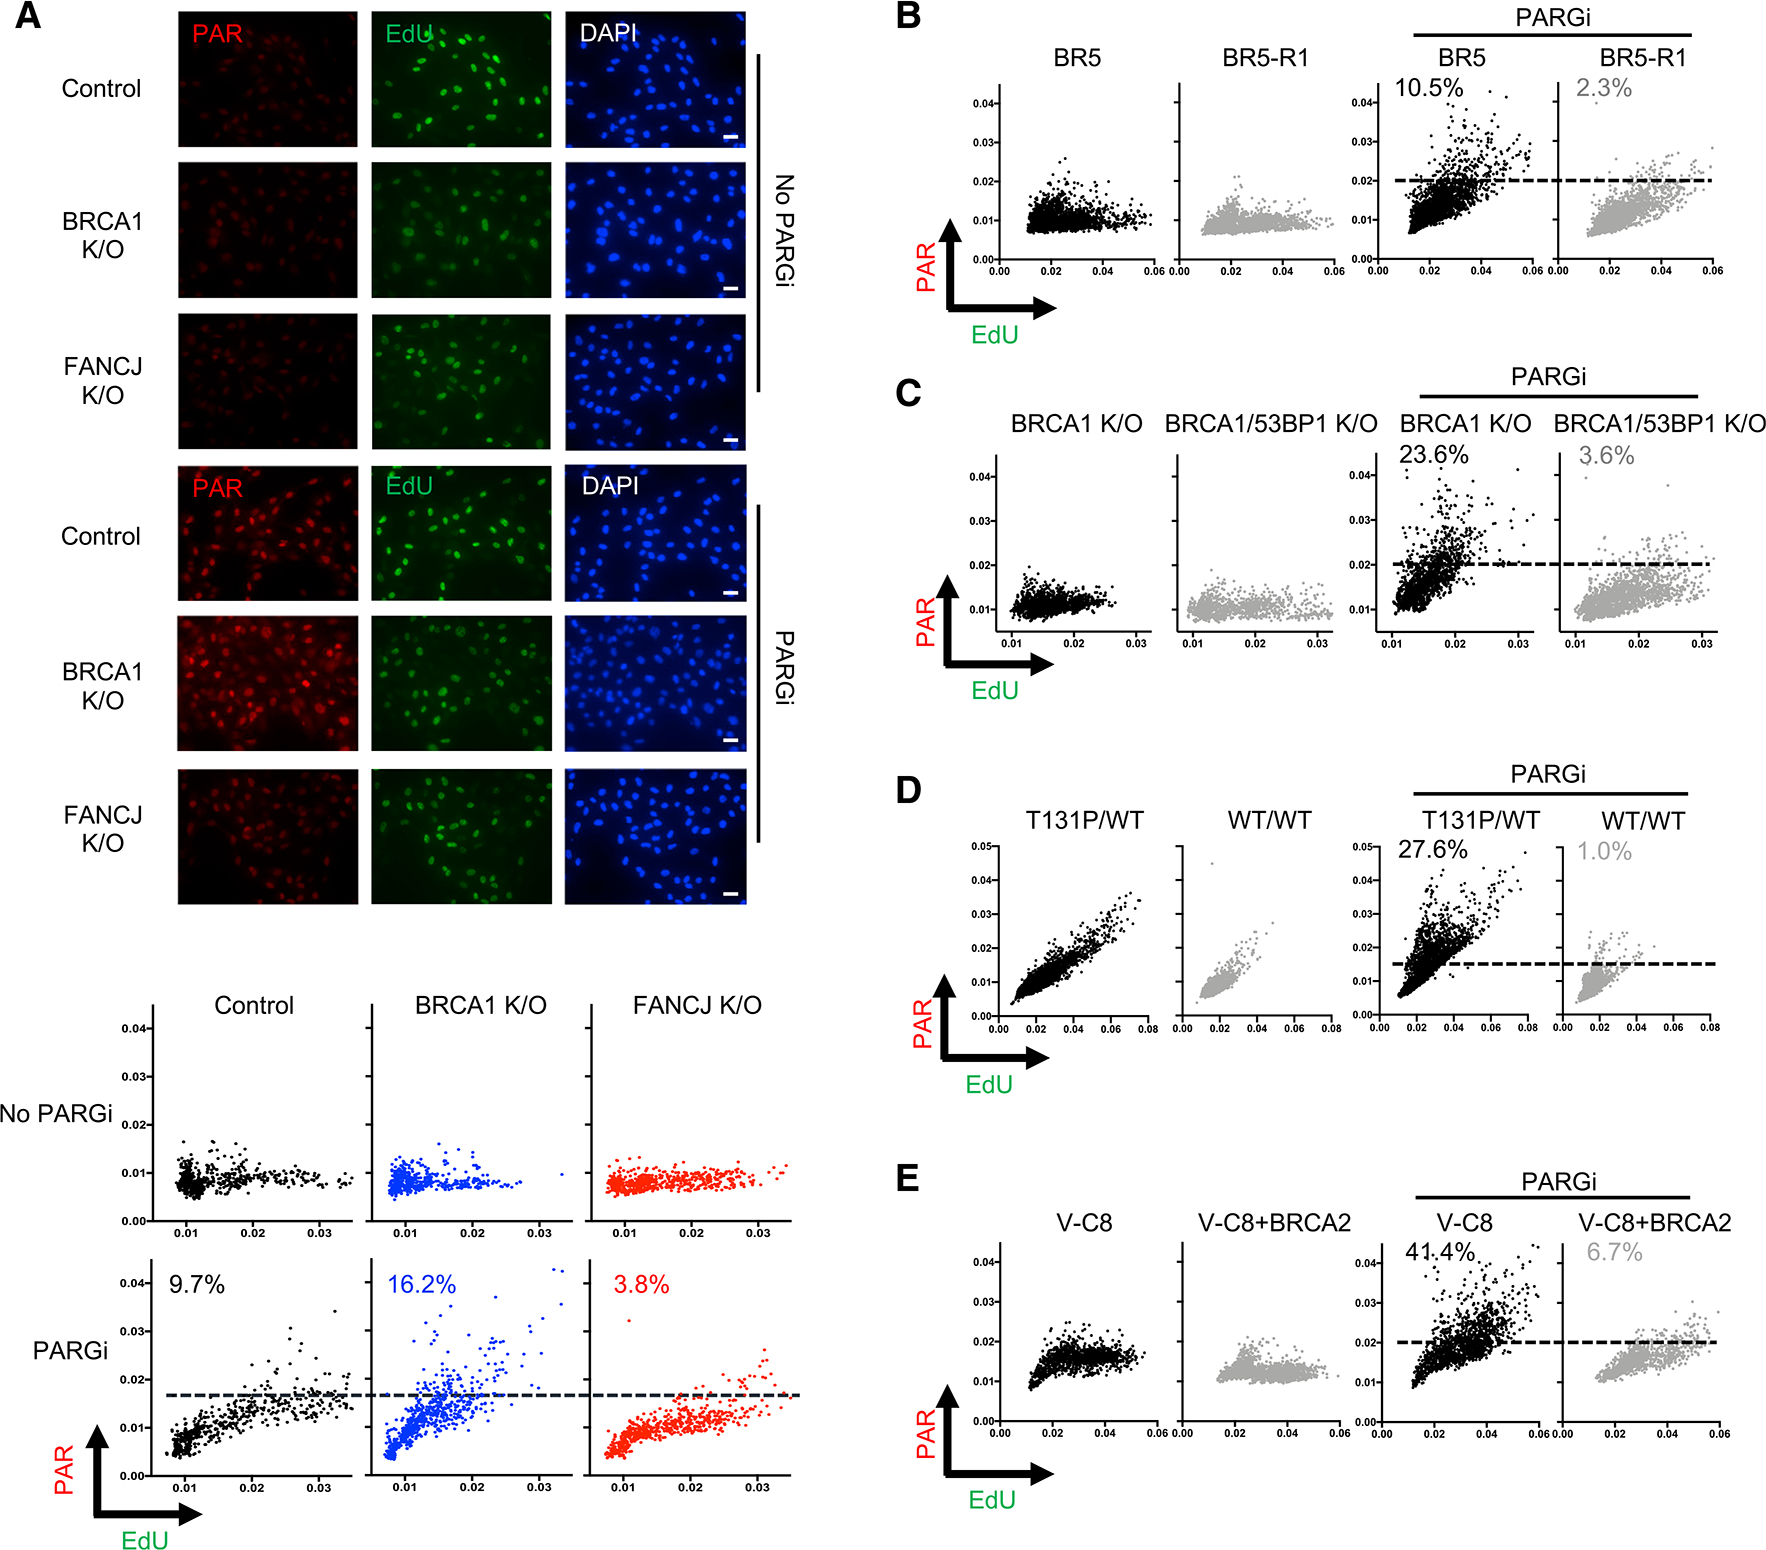
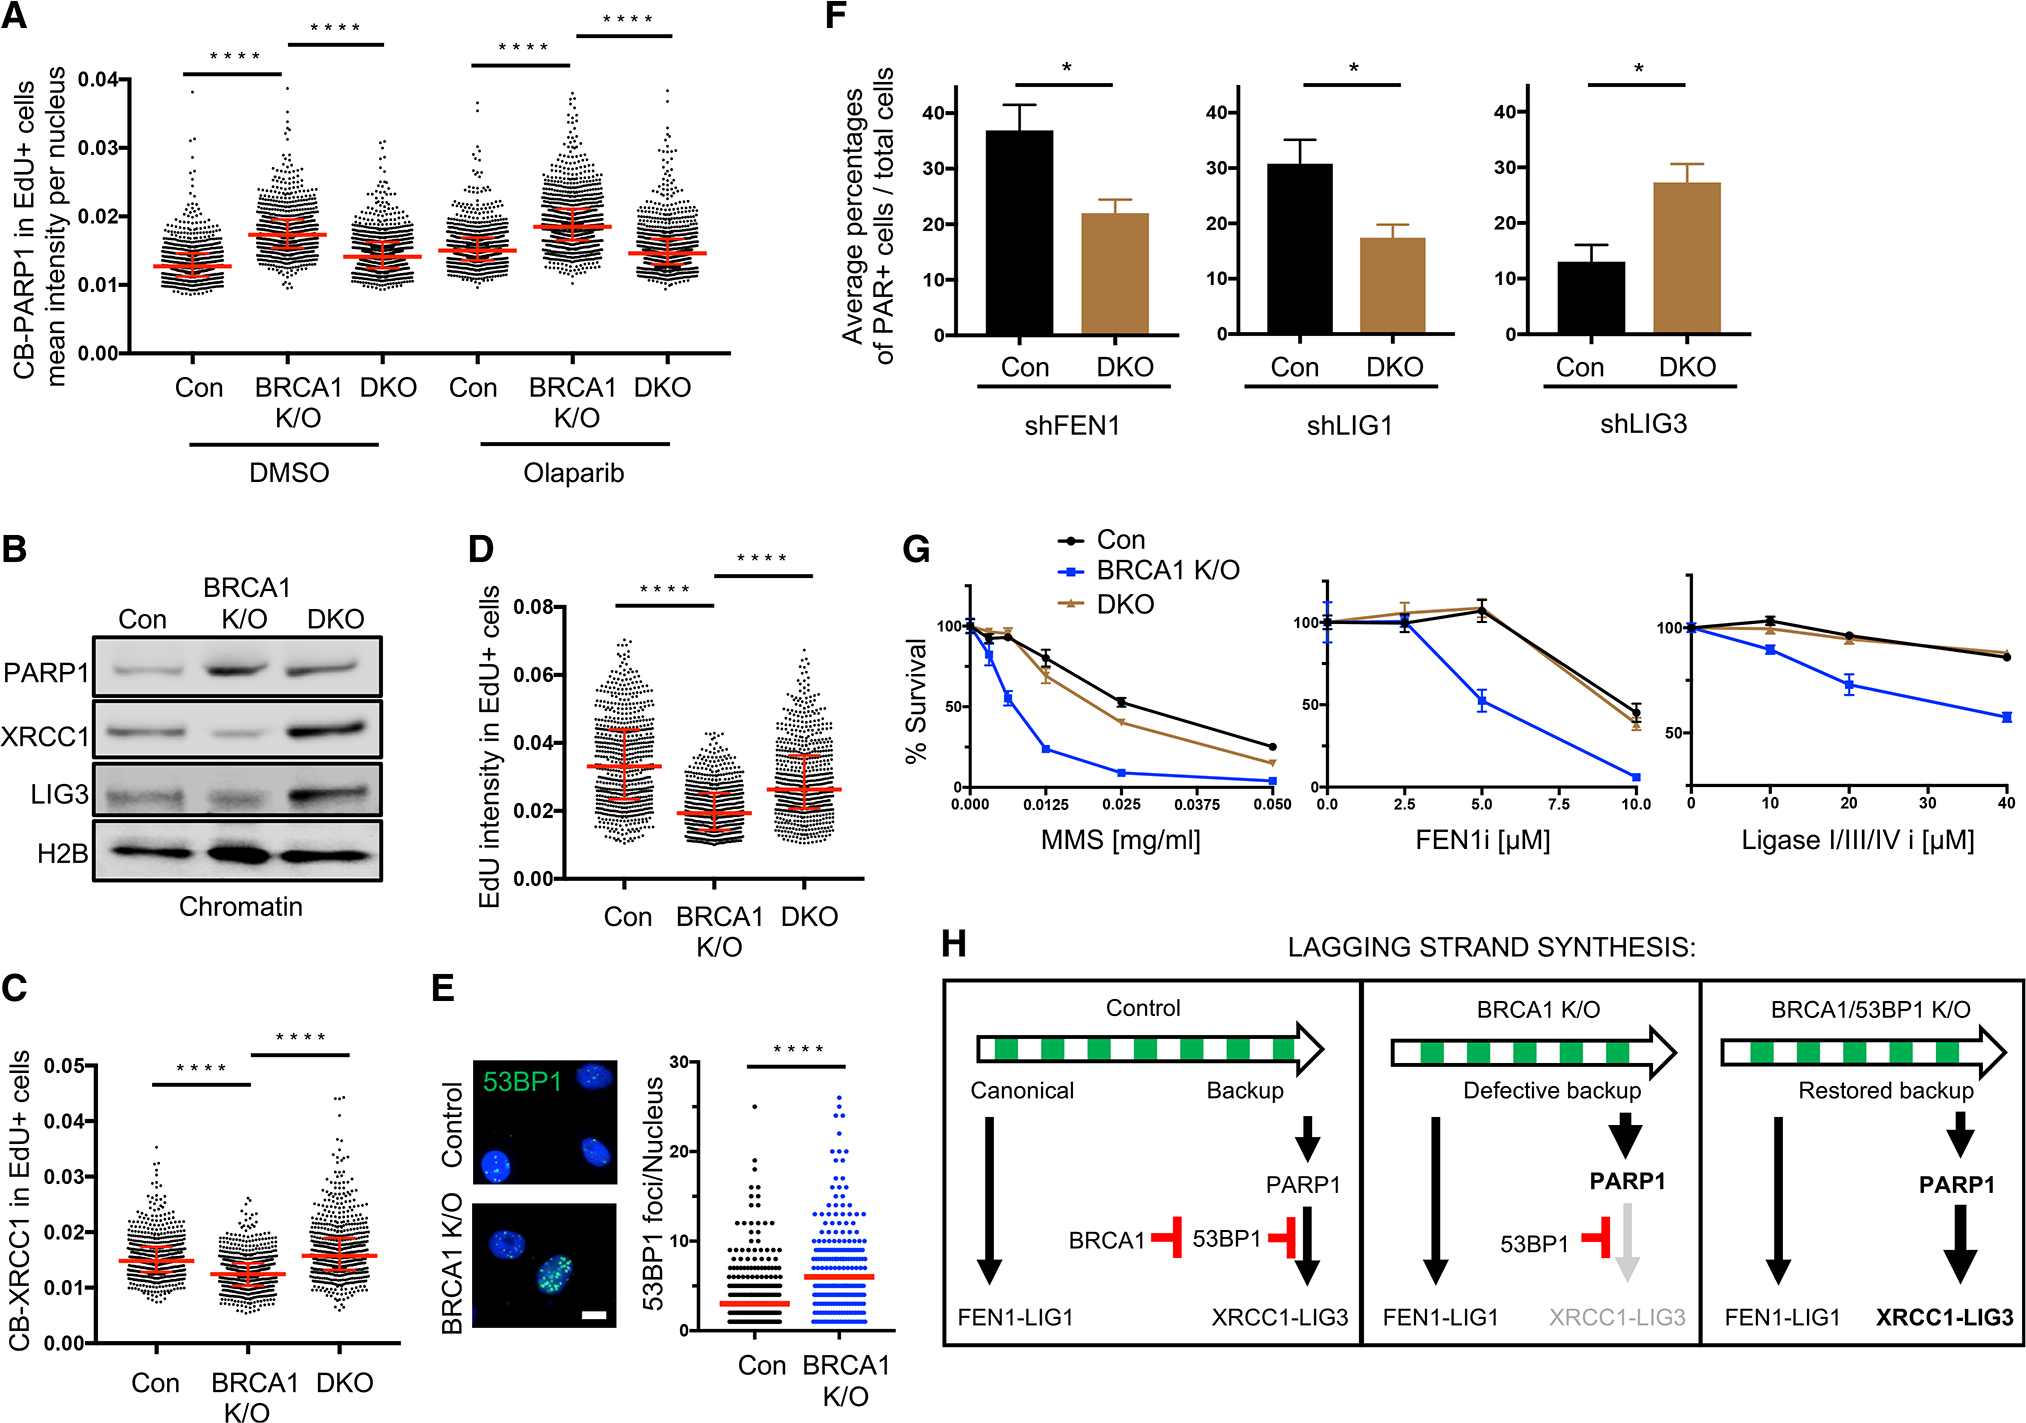
Mutations in BRCA1 or BRCA2 (BRCA) is synthetic lethal with poly(ADP-ribose) polymerase inhibitors (PARPi). Lethality is thought to derive from DNA double-stranded breaks (DSBs) necessitating BRCA function in homologous recombination (HR) and/or fork protection (FP). Here, we report instead that toxicity derives from replication gaps. BRCA1- or FANCJ-deficient cells, with common repair defects but distinct PARPi responses, reveal gaps as a distinguishing factor. We further uncouple HR, FP, and fork speed from PARPi response. Instead, gaps characterize BRCA-deficient cells, are diminished upon resistance, restored upon resensitization, and, when exposed, augment PARPi toxicity. Unchallenged BRCA1-deficient cells have elevated poly(ADP-ribose) and chromatin-associated PARP1, but aberrantly low XRCC1 consistent with defects in backup Okazaki fragment processing (OFP). 53BP1 loss resuscitates OFP by restoring XRCC1-LIG3 that suppresses the sensitivity of BRCA1-deficient cells to drugs targeting OFP or generating gaps. We highlight gaps as a determinant of PARPi toxicity changing the paradigm for synthetic lethal interactions.

Keywords: BRCA1/BRCA2; Fanconi anemia (FA); Okazaki fragment processing; PARP inhibitor; fork protection; homologous recombination; parylation; replication gaps; ssDNA; synthetic lethal.


Conflict of interest statement

Declaration of interests The authors declare no competing interests.

Figures

Figure 1.
Figure 1.. PARPi-induced fork lengthening and ssDNA gaps are greater in BRCA1-deficient but not in FANCJ-deficient cells
(A) Western blot analysis with the indicated antibodies of lysates from control, FANCJ KO, and BRCA1 KO RPE1 cells. (B) Cell survival assays for indicated cells under increasing concentrations of olaparib or cisplatin. Data represent the mean percentage ± SD of survival for each dot. (C) Schematic and quantification of the DNA fiber assays for the length of dual-color tracts in indicated cells following olaparib treatment (10 μM, 2 h). (D) DNA fiber assays for the length of dual-color tracts in indicated cells following olaparib treatment (0.5 μM) at different periods of time. (E) DNA fiber assays for IdU tracts with or without S1 nuclease incubation in indicated cells following olaparib treatment (10 μM, 2 h). For (C)–(E), each dot represents 1 fiber; at least 200 fibers are quantified from 2 biological independent experiments (n = 2). Red bars represent the median ± interquartile range. All statistical analysis according to Kruskal-Wallis test, followed by Dunn’s test. **p < 0.01; ****p < 0.0001; ns, not significant. (F) Schematic and quantification of mean ssDNA intensity for indicated cells following CldU pre-labeling and olaparib release in 0.5 μM, 2 h with EdU added at the last 20 min. At least 200 cells are quantified from n = 2. Dashed lines indicate a cutoff intensity level (at 0.01) for all cell lines. Cells with intensity higher than that are calculated for percentages. EdU and ssDNA are measured by arbitrary units. (G) Model illustrating gap formation following PARPi treatment in control, BRCA1 KO, and FANCJ KO RPE1 cells. See also Figure S1 and Table S1.
Figure 2.
Figure 2.. PARPi-induced fork acceleration and sensitivity can be uncoupled
(A) Western blot analysis with the indicated antibodies of lysates from RPE1 cells expressing small hairpin RNA (shRNA) against non-silencing control (NSC), p21(A), and p21(B). (B) Schematic and quantification of the length of CldU tracts in indicated RPE1 cells following olaparib treatment (10 μM, 2 h). Each dot represents 1 fiber; at least 200 fibers are quantified from 2 biological independent experiments (n = 2). (C) Cell survival assays for indicated RPE1 cells under increasing concentrations of olaparib. Data represent the mean percentage ± SD of survival for each dot. (D) Schematic and quantification of mean ssDNA intensity for indicated RPE1 cells following CldU pre-labeling and olaparib release (10 μM, 2 h). At least 200 cells are quantified from n = 2. For (B) and (D), red bars represent the median ± interquartile range. a.u., arbitrary units. Statistical analysis according to Kruskal-Wallis test, followed by Dunn’s test. **p < 0.01, ****p < 0.0001. (E) Model for fork acceleration without gaps following PARPi treatment in p21-proficient and -deficient backgrounds. See also Figure S2.
Figure 3.
Figure 3.. Gap suppression correlates with PARPi resistance and resensitization restores gaps
(A) Cell survival assays for T2, BR5, and BR5-R1 (BR5-derived PARPi-resistant cells) cells under increasing concentrations of olaparib. (B) Schematic and quantification of mean ssDNA intensity for BR5 and BR5-R1 cells following CldU pre-labeling and olaparib release (10 μM, 2 h). (C) Cell survival assays for BR5-R1 cells under increasing concentrations of olaparib with or without ATR inhibitor (VE-821, 1 μM). (D) Quantification of mean ssDNA intensity for BR5-R1 cells following CldU pre-labeling and olaparib release (10 μM, 2h), with or without ATR inhibitor (VE-821, 1 μM). (E) Cell survival assays for indicated RPE1 cells under increasing concentrations of olaparib. (F) Quantification of mean ssDNA intensity for indicated cell lines following CldU pre-labeling and olaparib release (10 μM, 2 h). (G) Schematic and quantification of the length of CldU tracts with or without S1 nuclease incubation in indicated PDX samples and olaparib treatment (10 μM, 2 h). Each dot represents 1 fiber; at least 150 fibers are quantified for each sample independently. Red bars represent the median ± interquartile range. Statistical analysis according to Kruskal-Wallis test, followed by Dunn’s test. **p < 0.01, ****p < 0.0001. (H) Model indicating that gap suppression predicts resistance in response to PARPi in both de novo and engineered backgrounds. For (A), (C), and (E), data represent the mean percentage ± SD of survival for each dot. For (B), (D), and (F), red bars represent the median ± interquartile range.At least 200 cells are quantified from 2 biological independent experiments. See also Figure S3 and Table S1.
Figure 4.
Figure 4.. PARPi induces gaps and sensitizes cells regardless of HR and fork protection (FP) proficiency
(A) Left: is fork degradation the cause for gaps and PARPi sensitivity in HR-proficient cells? Right: model indicating that PARPi-induced gaps still sensitize cells when FP is restored by depleting RADX. (B) Cell survival assays for patient fibroblasts (RA2630) RAD51 T131P (T131P/WT) and RAD51 double-allele CRISPR-corrected (WT/WT) cells under increasing concentrations of olaparib. (C) Schematic and quantification of mean ssDNA intensity for indicated cell lines in (B) following CldU pre-labeling and olaparib release (10 μM, 2 h). (D) Cell survival assays for indicated cells under increasing concentrations of olaparib. For all cell survival assays, data represent the mean percentage ± SD of survival for each dot. (E) (E) Quantification of mean ssDNA intensity for indicated cell lines following CldU pre-labeling and olaparib release (10 μM, 2 h). For (C) and (E), red bars represent the median ± interquartile range. At least 200 cells are quantified from 2 biological independent experiments. All statistical analysis according to Kruskal-Wallis test, followed by Dunn’s test. ****p < 0.0001. See also Figure S4 and Table S1.
Figure 5.
Figure 5.. PARPi synthetic lethality in BRCA1-deficient cells is linked to RPA exhaustion and can be augmented by targeting RPA
(A) Western blot analysis with the indicated antibodies of lysates from U2OS cells expressing siRNA against non-silencing control, FANCJ, and BRCA1. (B) Schematic and quantification of average RPA density at each replication fork in STORM analysis for indicated cells and treatment (10 μM, 2 h olaparib). At least 40 single cells are quantified from 2 biological independent experiments (n = 2), respectively, for each group; every dot represents the pair-localized RPA density from 1 nucleus. All red bars represent the median ± interquartile range. Statistical analysis according to Kruskal-Wallis test, followed by Dunn’s test. (C) Control, BRCA1 KO and FANCJ KO RPE1 cells are treated with olaparib (10 μM) at indicated times and stained for CB-γH2AX/RPA. Dashed lines indicate maximum γH2AX levels in untreated control cells. Cells higher than those are marked in red and calculated for percentages. Each dot represents 1 cell; cells (n = 1,500 ± 300) are collected from n = 2. (D) Western blot analysis with the indicated antibodies of lysates from control and BRCA1 KO RPE1 cells expressing siRNA against RPA in increasing doses (0, 0.025, and 0.05 nM), and cell survival assays for cells above under increasing concentrations of olaparib. (E) Western blot analysis for indicated antibodies in control and BRCA1 KO RPE1 cells with negative mock transfection (−) and overexpression of superRPA cDNA (sRPA shows higher bands in immunoblots due to P2A tag), and cell survival assays for cells above under increasing concentrations of olaparib. (F) Clonogenic assays for control and BRCA1 KO cells treated with RPA inhibitor (RPAi, NERx-329) under indicated doses. Mean survival percentages of n = 4 with SEM are collected for all of the cells. (G) Clonogenic assays for indicated cells under increasing olaparib with sublethal dose of RPAi (NERx-329). Mean survival percentages of n = 3 with SEM are collected for all of the cells. Statistical analysis according to t test. All p values are described in Quantification and statistical analysis. For (D) and (E), data represent the mean percentage ± SD of survival for each dot. See also Figure S5.
Figure 6.
Figure 6.. PARPi-sensitive cells display high PAR reversed upon PARPi resistance
(A) Top: representative images of immunofluorescence for control, BRCA1 KO, and FANCJ KO RPE1 cells stained for poly(ADP-ribose) (PAR) and EdU. Cells were incubated without (top) or with (bottom) PARG inhibitor (10 μM) for PAR and EdU for 20 min to detect DNA synthesis. Scale bars, 50 μm. Bottom: scatterplot of indicated cells for mean PAR and EdU intensity per nucleus after incubation with EdU with or without PARG inhibitor (10 μM, 20 min, using DMSO as control). Dashed lines indicate maximum PAR level in untreated control cells. Each dot represents 1 cell; at least 500 cells are collected for each from 3 biological independent experiments (n = 3). (B) Scatterplot of mean PAR and EdU intensity for BR5 and BR5-R1 cells. Cells are incubated with EdU with or without PARG inhibitor (10 μM, 20 min) for indicated groups. At least 2,000 cells are collected from n = 3. Dashed lines indicate maximum PAR level in untreated BR5-R1 cells. (C) Scatterplot of PAR and EdU for BRCA1 and BRCA1/53BP1 KO cells. Cells are incubated the same as above for indicated groups. At least 1,200 cells are collected from n = 3. Dashed lines indicate maximum PAR level in untreated BRCA1 KO cells. (D) Scatterplot of PAR and EdU for patient fibroblasts (RA2630) RAD51 T131P (T131P/WT) and RAD51 double-allele CRISPR-corrected (WT/WT) cells. Cells are treated the same as above. At least 2,000 cells are collected from n = 3. Dashed lines indicate maximum PAR level in untreated WT/WT cells. (E) Scatterplot of PAR and EdU for V-C8 and V-C8+BRCA2 cells. Cells are treated the same as above. At least 1,200 cells are collected from n = 2. Dashed lines indicate maximum PAR level in untreated V-C8+BRCA2 cells. For all of the above, cells higher than those lines are calculated for percentages, respectively. See also Figure S6.
Figure 7.
Figure 7.. OFP defects in BRCA1-deficient cells are suppressed by 53BP1 depletion
(A) Quantification of chromatin-bound PARP1 (CB-PARP1) for control, BRCA1 KO, and BRCA1/53BP1 KO (labeled as Con, DKO in figure, same as follows) RPE1 cells with or without treatment (0.5 μM, 2 h olaparib), with EdU added to the final 20 min. For quantification, EdU+ cells were gated according to positive EdU incorporation. (B) Western blot analysis for indicated antibodies in chromatin extraction for control, BRCA1 KO, and BRCA1/53BP1 KO RPE1 cells. (C) Quantification of CB-XRCC1 for untreated control, BRCA1 KO, and BRCA1/53BP1 KO RPE1 cells, with EdU incubated for 20 min. For quantification, EdU+ cells were gated according to positive EdU incorporation. (D) Quantification of mean EdU intensity from EdU+ cells. EdU was incubated for 20 min in indicated cells. For (A), (C) and (D), red bars represent the median ± interquartile range. At least 600 cells are quantified from 3 biological independent experiments (n = 3). All statistical analysis according to Kruskal-Wallis test, followed by Dunn’s test. ****p < 0.0001. (E) Immunofluorescence showing 53BP1 chromatin foci in untreated control and BRCA1 K/O RPE1 cells. Cells ≥1 foci per nucleus were measured. At least 150 cells were quantified from n = 3. Red bars represent the median number. Statistical analysis according to Mann-Whitney test. ****p < 0.0001. Scale bar, 10 μm. (F) (F) Average percentages of PAR+ over total for indicated cells after PARGi (10 μM, 20 min) and EdU incubation. For quantification, PAR+ cells were gated by maximum PAR level in control NSC cells for each experiment. Average values of n = 4 with SEM are calculated. *p < 0.05. (G) Cell survival assays for indicated cells under increasing concentrations of MMS, FEN1 inhibitor (FEN1i), and ligase I/III/IV inhibitor (Ligase I/III/IV i). Data represent the mean percentage ± SD of survival for each dot. (H) Model summarizing the function of BRCA1 and 53BP1 in regulating lagging strand synthesis, and their interactions with the backup OFP pathway. See also Figure S7.

References

    1. Adam S, Rossi SE, Moatti N, Zompit MDM, Ng TF, Álvarez-Quilón A, Desjardins J, Bhaskaran V, Martino G, Setiaputra D, et al. (2021). CIP2A is a prime synthetic-lethal target for BRCA-mutated cancers. bioRxiv. 10.1101/2021.02.08.430060. - DOI - PubMed
    1. Álvarez-Quilón A, Wojtaszek JL, Mathieu MC, Patel T, Appel CD, Hustedt N, Rossi SE, Wallace BD, Setiaputra D, Adam S, et al. (2020). Endogenous DNA 3′ Blocks Are Vulnerabilities for BRCA1 and BRCA2 Deficiency and Are Reversed by the APE2 Nuclease. Mol. Cell 78, 1152–1165.e8. - PMC - PubMed
    1. Amé JC, Fouquerel E, Gauthier LR, Biard D, Boussin FD, Dantzer F, de Murcia G, and Schreiber V (2009). Radiation-induced mitotic catastrophe in PARG-deficient cells. J. Cell Sci 122, 1990–2002. - PubMed
    1. Arakawa H, and Iliakis G (2015). Alternative Okazaki Fragment Ligation Pathway by DNA Ligase III. Genes (Basel) 6, 385–398. - PMC - PubMed
    1. Avkin S, Sevilya Z, Toube L, Geacintov N, Chaney SG, Oren M, and Livneh Z (2006). p53 and p21 regulate error-prone DNA repair to yield a lower mutation load. Mol. Cell 22, 407–413. - PubMed

Publication types

MeSH terms