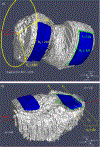
Cartilage Topography Assessment With Local-Area Cartilage Segmentation for Knee Magnetic Resonance Imaging
- PMID: 34219396
- PMCID: PMC8727638
- DOI: 10.1002/acr.24745
Cartilage Topography Assessment With Local-Area Cartilage Segmentation for Knee Magnetic Resonance Imaging
Abstract
Objective: Local-area cartilage segmentation (LACS) software was developed to segment medial femur (MF) cartilage on magnetic resonance imaging (MRI). Our objectives were 1) to extend LACS to the lateral femur (LF), medial tibia (MT), and lateral tibia (LT), 2) to compare LACS to an established manual segmentation method, and 3) to visualize cartilage responsiveness over each cartilage plate.
Methods: Osteoarthritis Initiative participants with symptomatic knee osteoarthritis (OA) were selected, including knees selected at random (n = 40) and knees identified with loss of cartilage based on manual segmentation (Chondrometrics GmbH), an enriched sample of 126 knees. LACS was used to segment cartilage in the MF, LF, MT, and LT on sagittal 3D double-echo steady-state MRI scans at baseline and at 2-year follow-up. We compared LACS and Chondrometrics average thickness measures by estimating the correlation in each cartilage plate and estimating the standardized response mean (SRM) for 2-year cartilage change. We illustrated cartilage loss topographically with SRM heatmaps.
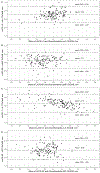
Results: The estimated correlation between LACS and Chondrometrics measures was r = 0.91 (95% confidence interval [95% CI] 0.86, 0.94) for LF, r = 0.93 (95% CI 0.89, 0.95) for MF, r = 0.97 (95% CI 0.96, 0.98) for LT, and r = 0.87 (95% CI 0.81, 0.91) for MT. Estimated SRMs for LACS and Chondrometrics measures were similar in the random sample, and SRM heatmaps identified subregions of LACS-measured cartilage loss.
Conclusion: LACS cartilage thickness measurement in the MF and LF and tibia correlated well with established manual segmentation-based measurement, with similar responsiveness to change, among knees with symptomatic knee OA. LACS measurement of cartilage plate topography enables spatiotemporal analysis of cartilage loss in future knee OA studies.
© 2021 The Authors. Arthritis Care & Research published by Wiley Periodicals LLC on behalf of American College of Rheumatology.
Figures


References
-
- McAlindon TE, Driban JB, Henrotin Y, Hunter DJ, Jiang GL, Skou ST, et al. OARSI Clinical Trials Recommendations: Design, conduct, and reporting of clinical trials for knee osteoarthritis. Osteoarthritis Cartilage. 2015;23(5):747–60. - PubMed
-
- Lester G. Clinical research in OA--the NIH Osteoarthritis Initiative. J Musculoskelet Neuronal Interact. 2008;8(4):313–4. - PubMed
-
- Hunter DJ, Lo GH, Gale D, Grainger AJ, Guermazi A, Conaghan PG. The reliability of a new scoring system for knee osteoarthritis MRI and the validity of bone marrow lesion assessment: BLOKS (Boston Leeds Osteoarthritis Knee Score). Ann Rheum Dis. 2008;67(2):206–11. - PubMed
Publication types
MeSH terms
Grants and funding
LinkOut - more resources
Full Text Sources
Miscellaneous

