. 2021 Sep 20:316:128147.
doi: 10.1016/j.jclepro.2021.128147. Epub 2021 Jun 29.

Investigating the effect of air conditioning on the distribution and transmission of COVID-19 virus particles

Affiliations

Investigating the effect of air conditioning on the distribution and transmission of COVID-19 virus particles

Mahdi Ahmadzadeh et al. J Clean Prod. .

Abstract

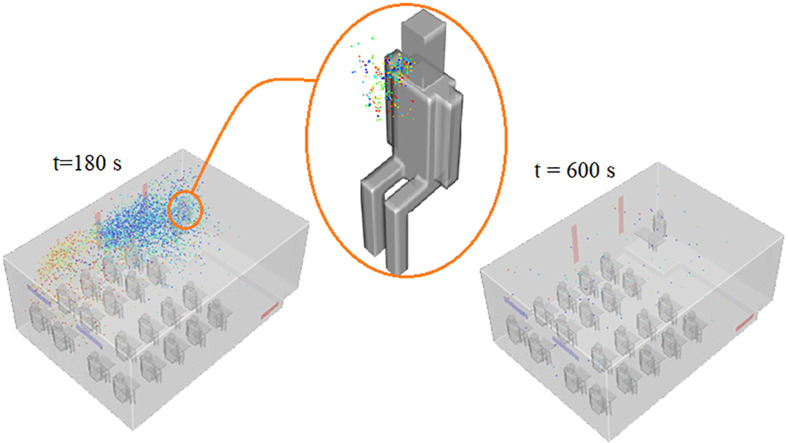
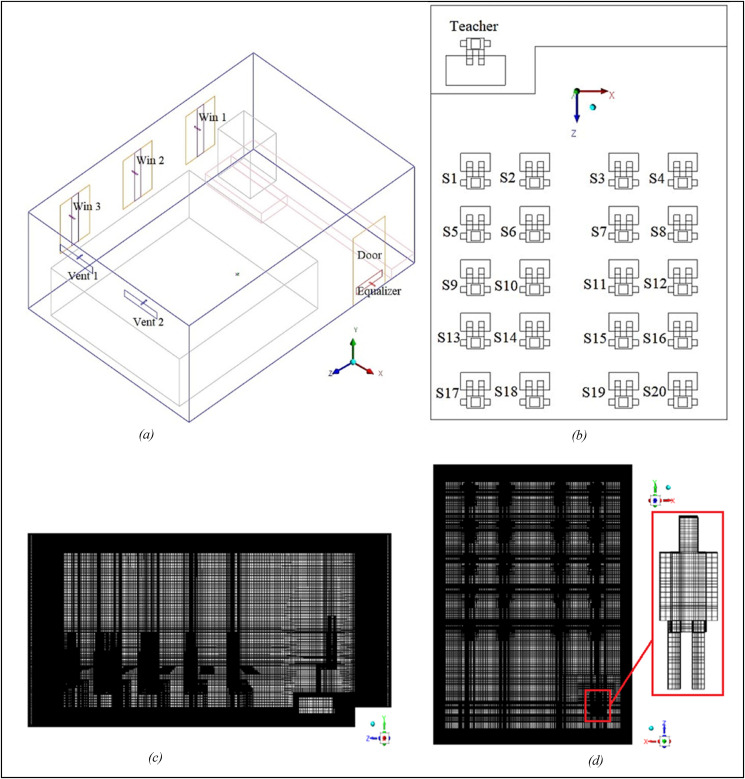
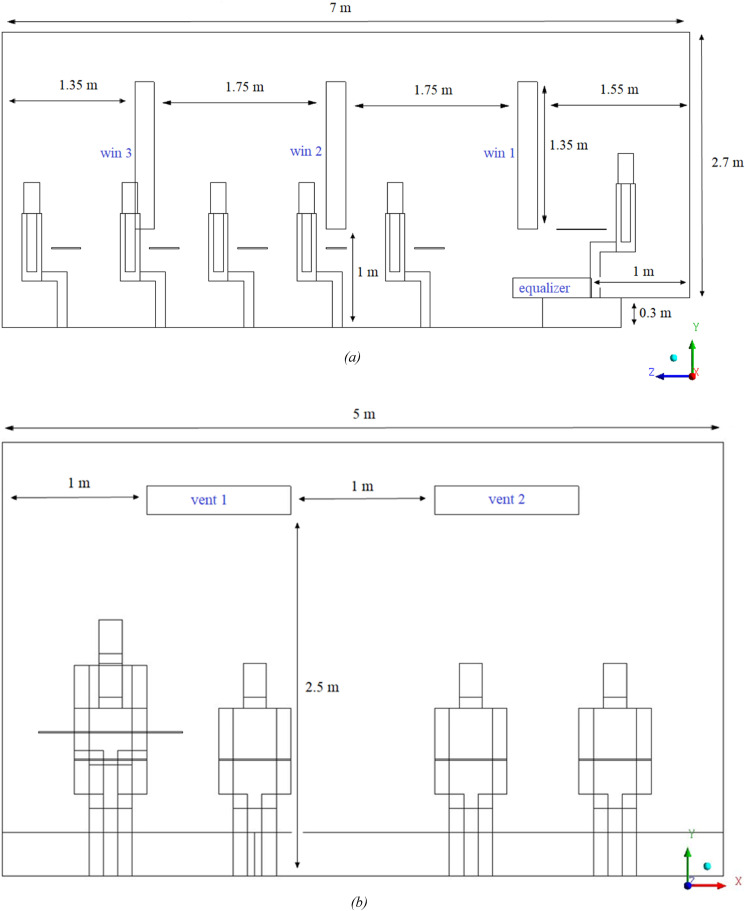
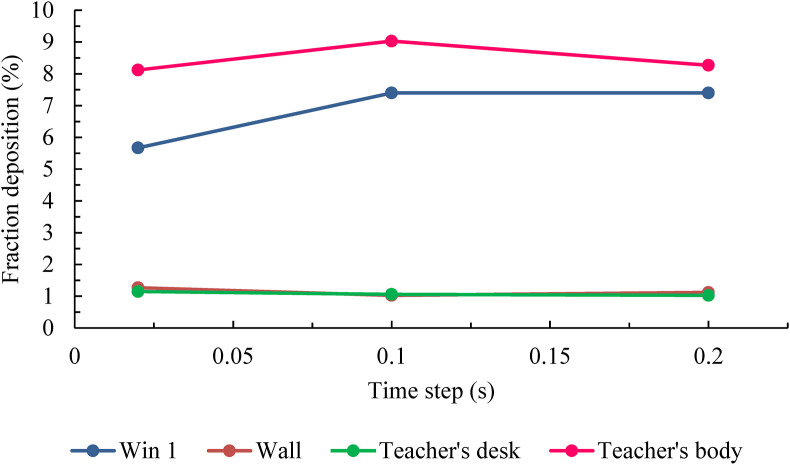
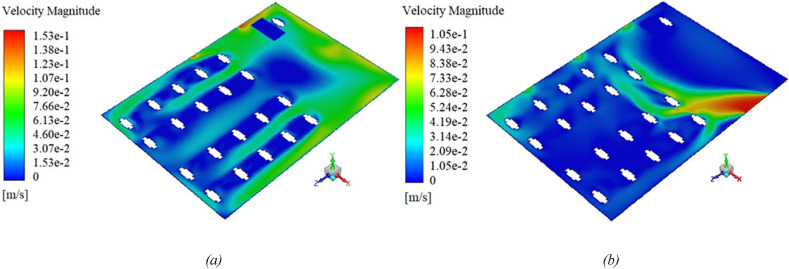
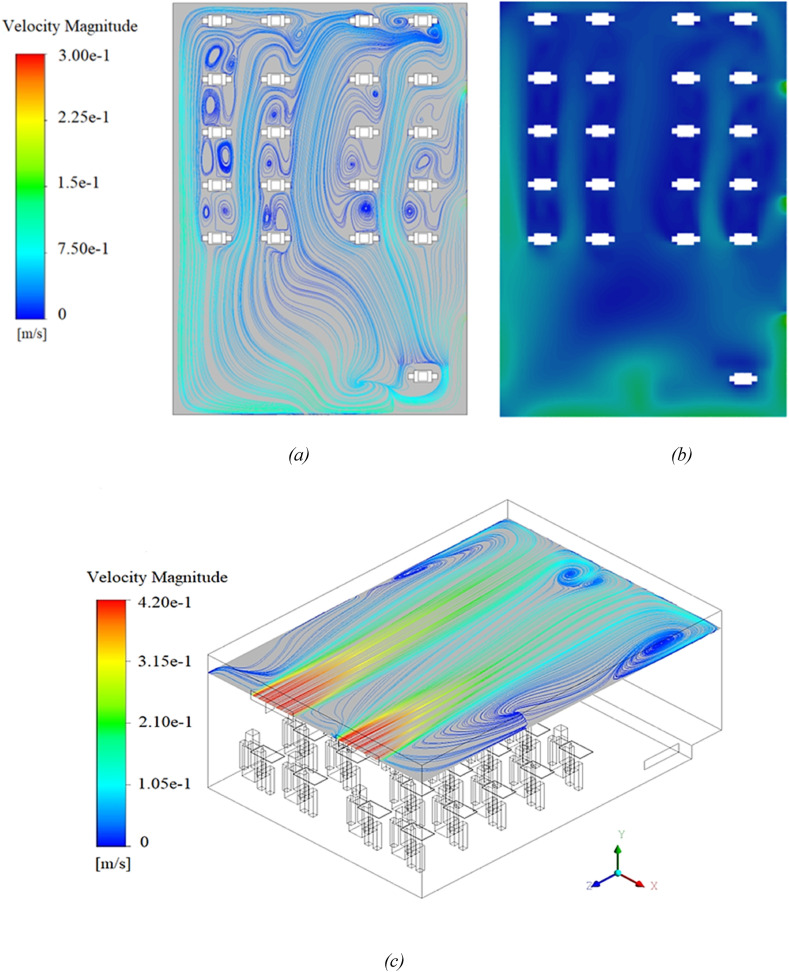
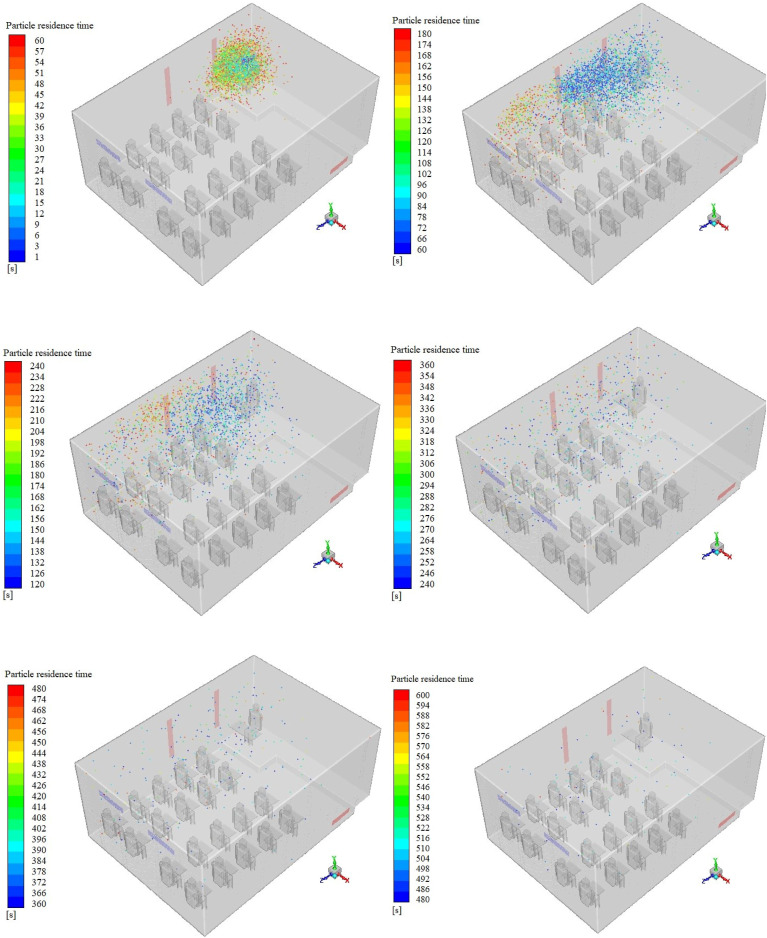
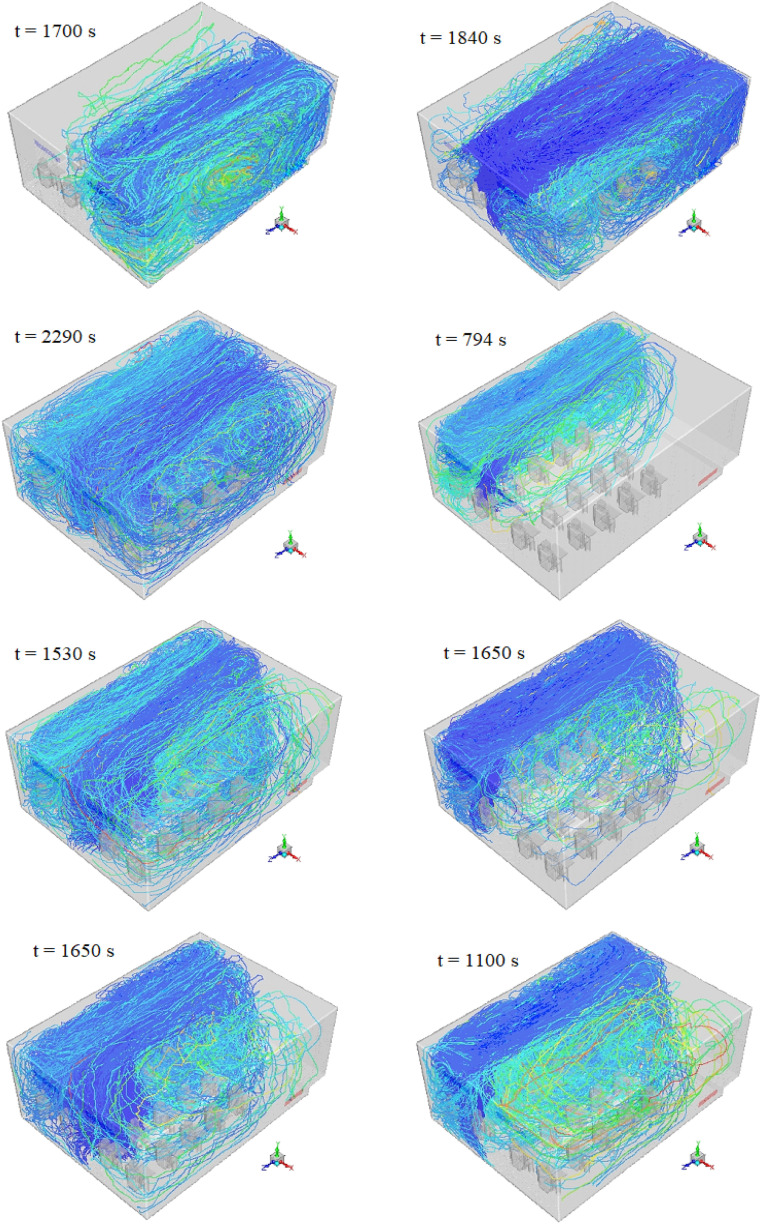
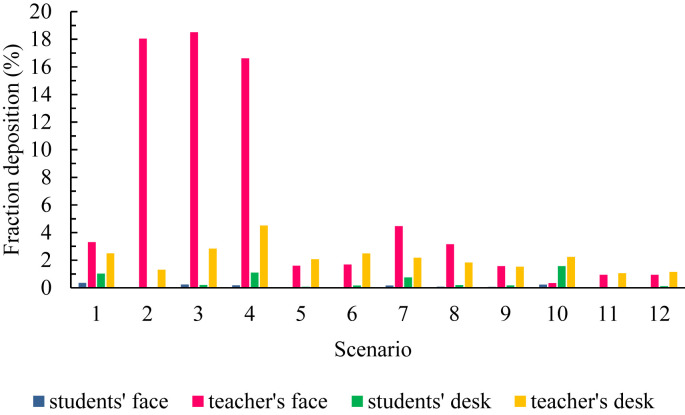
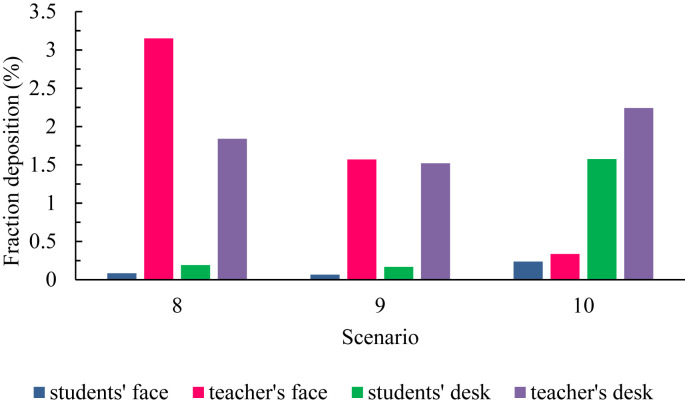
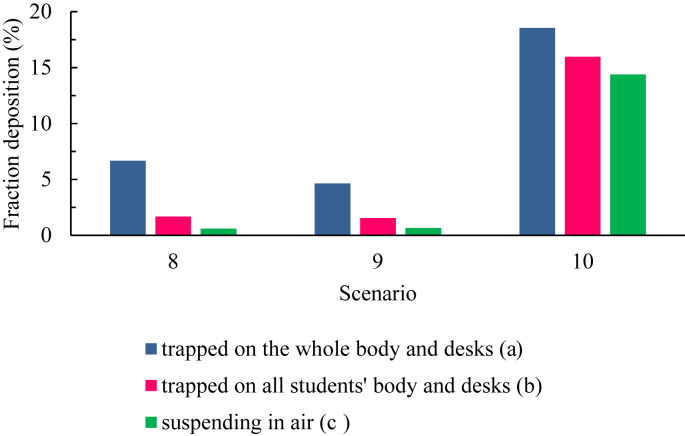
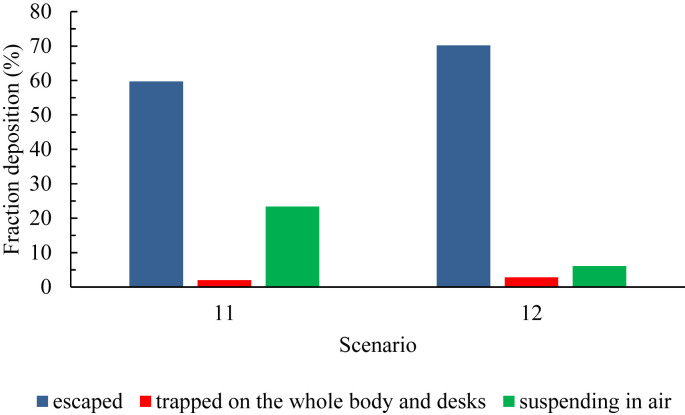
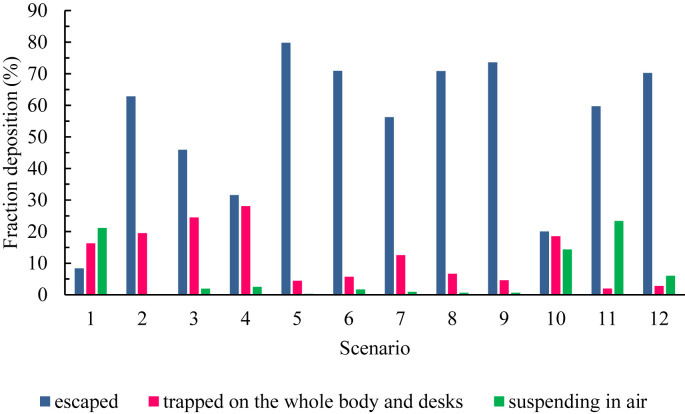
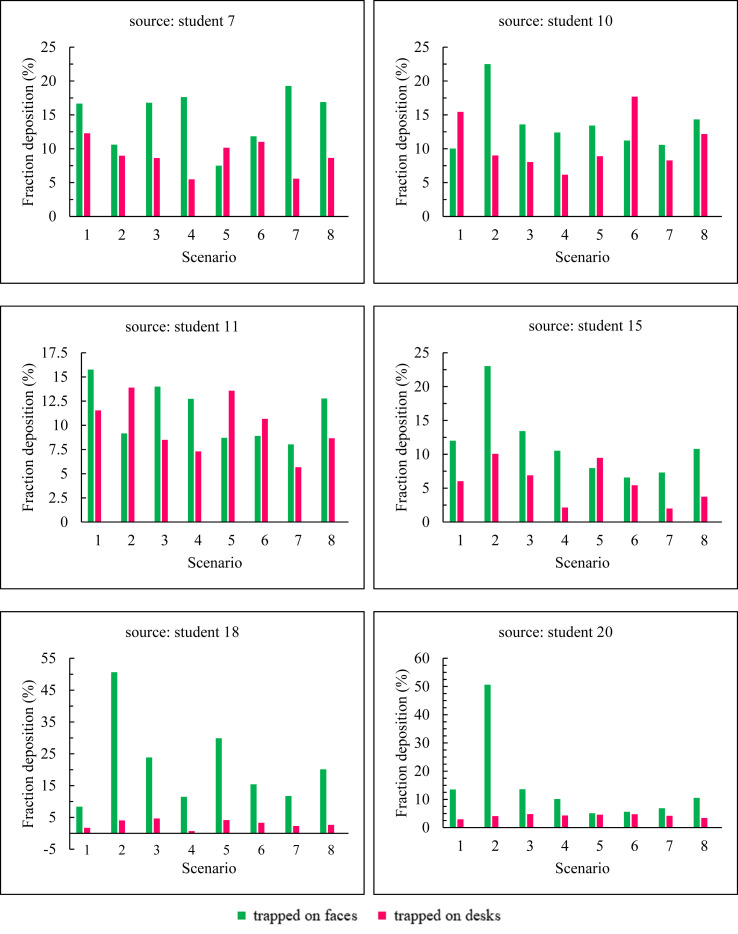
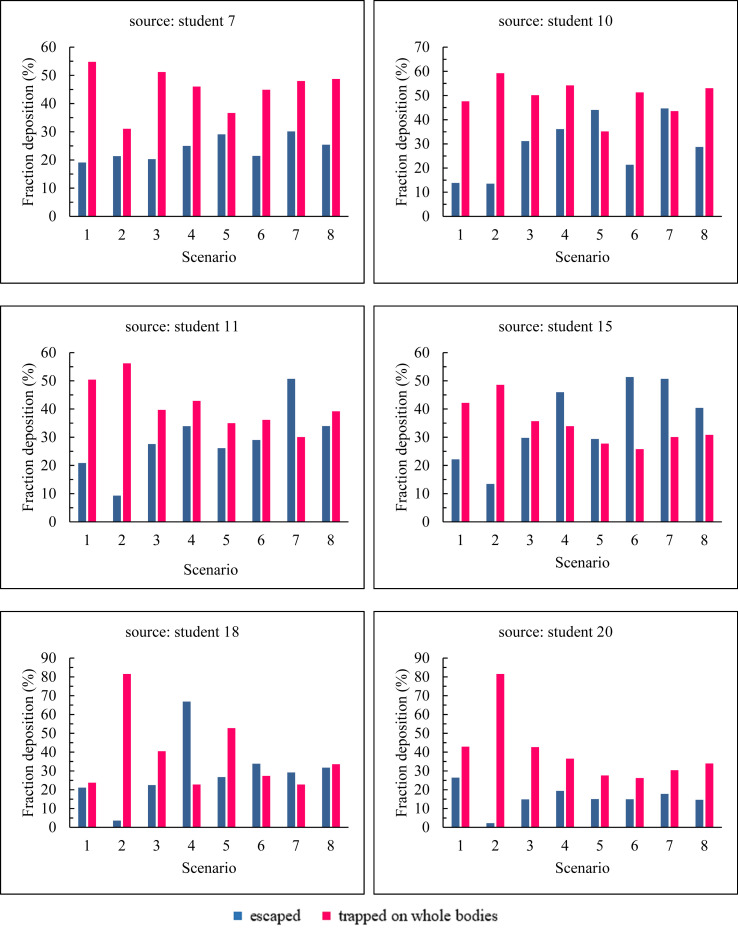
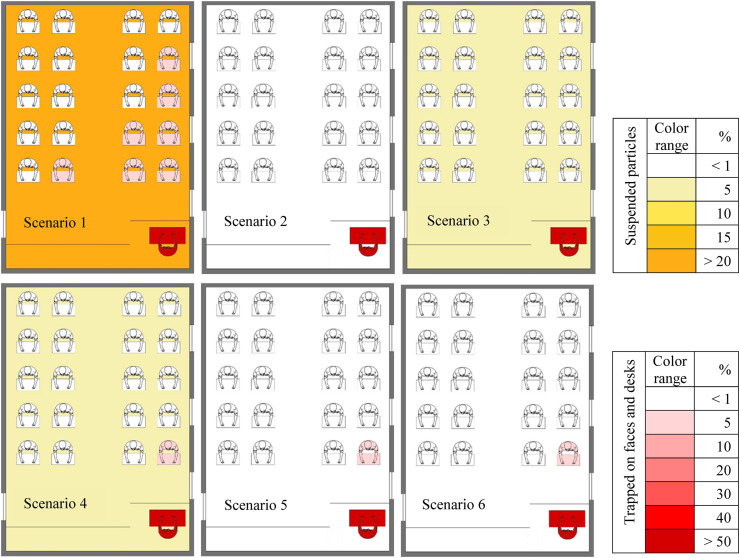
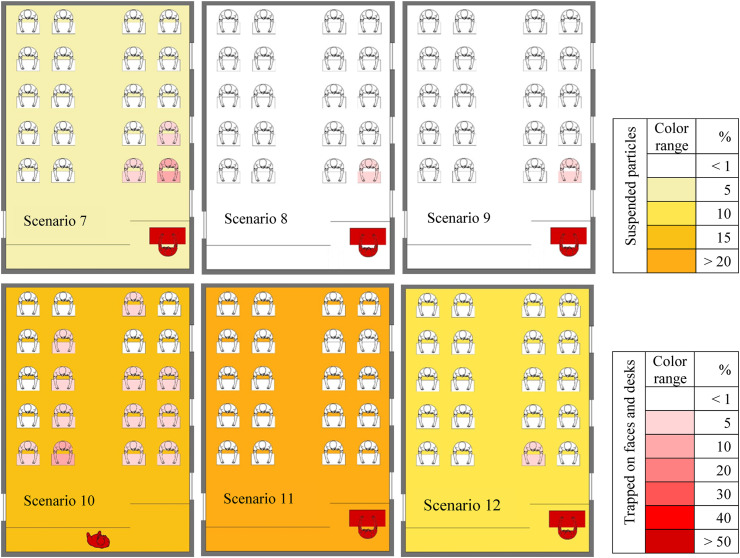
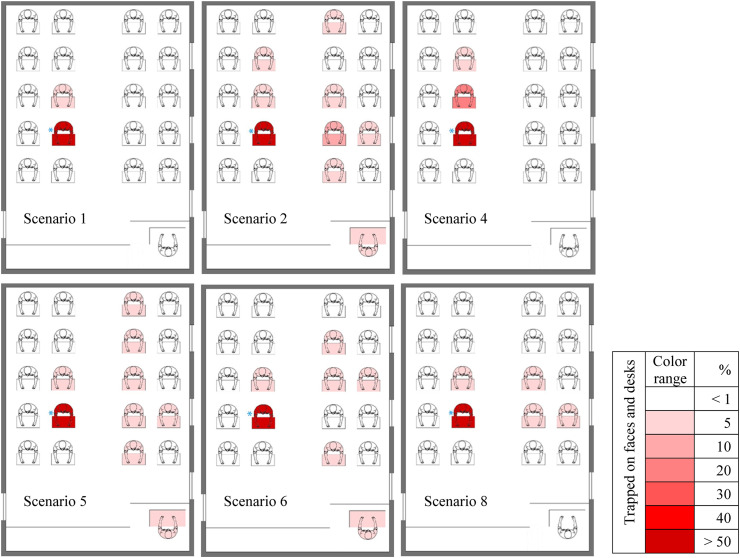
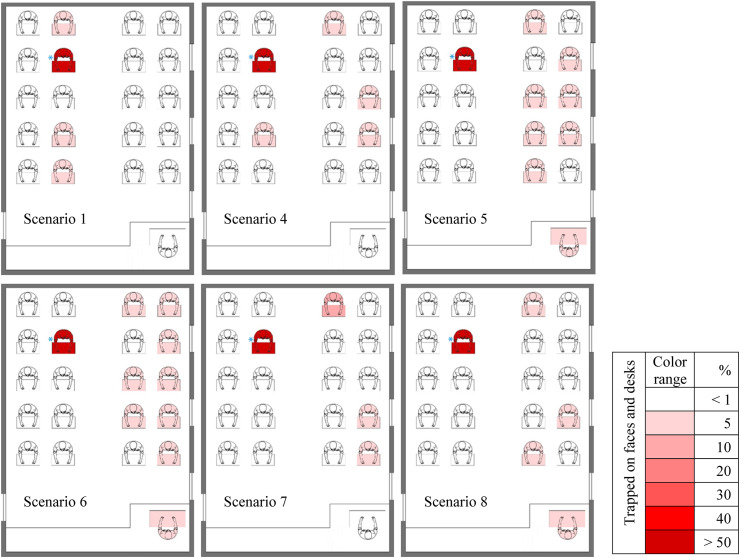
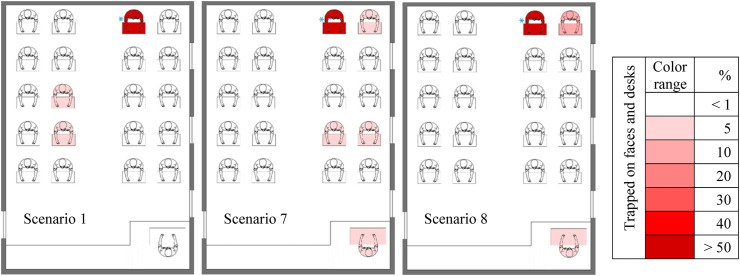
The effect of indoor airflow has been confirmed on the diffusion and transmission of droplets generated when talking or sneezing by a person with a viral respiratory infection such as COVID-19. The present study to investigate the effect of airflow in an indoor environment (a classroom) on the distribution and transmission of droplets emitted from speaking and cough by an infected person. A numerical analysis to investigate the persistence and deposition of particles on the surfaces of desks and the faces of residents (teacher and students) under various scenarios, including the opening of windows. This study puts forward two types of conditions while the teacher is speaking and the cough of some students for the distribution of pathogenic particles. Computational Fluid Dynamics used to conduct the study, using the Euler-Lagrange approach to capture the transport of the particles, and the RANS equations to compute the airflow field in the classroom. The results indicate the significant effect of air conditioning and open window close to the infected person in reducing environmental pathogens. Moreover, the concentrations of virus particles increase greatly near the output; hence, the presence of people in these areas increases the risk of contracting the disease. Furthermore, when all the windows are closed, due to the low output capacity, the particles spread in all areas of the domain and increase the risk of infection. Therefore, it is recommended that the window be open in indoors environment especially the window next to the speaker.

Keywords: CFD; Classroom; Deposition; Eulerian-Lagrangian model; SARS-CoV-2.


Conflict of interest statement

The authors declare that they have no known competing financial interests or personal relationships that could have appeared to influence the work reported in this paper.

Figures

Image 1
Graphical abstract
Fig. 1
Fig. 1
Classroom schematic and hexa-unstructured computational grid, (a) Perspective view and introduction of different parts; (b) Naming and arranging students; (c) grid of plane ZY; (d) grid of plane XZ and refined grid around teacher.
Fig. 2
Fig. 2
Dimensions of the classroom and the position of the: (a) inputs and (b) outputs of the airflow.
Fig. 3
Fig. 3
Distribution of particle diameter in coughing state.
Fig. 4
Fig. 4
Time independency results.
Fig. 5
Fig. 5
Velocity distribution on the plane of Y = 1 m, (a) for Scenario 4, and (b) for Scenario 11.
Fig. 6
Fig. 6
Velocity distribution for Scenario 9, (a) velocity streamline and (b) velocity contour on the plane of XZ in location Y = 1.1 m; (c) Velocity streamline distribution on the plane of Y = 2.6 m (isometric view).
Fig. 7
Fig. 7
Comparison of the velocity streamlines and recirculation zone on plane Y = 1.25 m (isometric view) for different scenarios, (a) 5, (b) 7, and (c) 1.
Fig. 8
Fig. 8
Aerosol cloud in the classroom environment at different times during scenario 5.
Fig. 9
Fig. 9
Typical released particle trajectories in coughing state for scenarios 1, 5, 6 and 7 from top row to bottom respectively, results on the left side when the student 15 and the right side when the student 18 is sources of cough. In addition, the residence time of the last particle for different scenarios is shown.
Fig. 10
Fig. 10
Fraction of particles deposited on students' faces and desks for different scenarios.
Fig. 11
Fig. 11
Comparison the fraction of particles deposited on the faces of three high-risk students across all scenarios with other students' face.
Fig. 12
Fig. 12
Comparison between the fraction of particles deposited on the students' faces and desks across all scenarios relative to the injector (teacher).
Fig. 13
Fig. 13
Comparison between the fraction of particles deposited on the students' faces and desks across 8, 9 and 10 scenarios relative to the injector (teacher).
Fig. 14
Fig. 14
Comparison between particles trapped on all surfaces of students' bodies with the bodies of all individuals and suspending particles in three scenarios: 8, 9 and 10.
Fig. 15
Fig. 15
Comparison between the fractions of particles trapped on the whole bodies and desks with escaped and suspending across 11 and 12 scenarios.
Fig. 16
Fig. 16
Comparison between the fractions of particles escaped with trapped on all surfaces of the body and desks and suspended in air for all scenarios.
Fig. 17
Fig. 17
The fraction of particles deposited on the faces and desks of people for six sources of cough and eight different scenarios.
Fig. 18
Fig. 18
The fraction of escaped particles and the fraction of particles deposited overall body of individuals for six sources of cough and eight different scenario.
Fig. 19
Fig. 19
Maximum time required to assign the last cough particle in the class (particle escape or deposition) for different scenarios.
Fig. 20
Fig. 20
Contours of fraction deposited particles on surfaces with high-level risk (faces and desks) and suspending particles in air for first six scenarios in state A.
Fig. 21
Fig. 21
Contours of fraction deposited particles on surfaces with high-level risk (faces and desks) and suspending particles in air for second six scenarios in state A.
Fig. 22
Fig. 22
Contours of fraction deposited particles on danger surfaces (faces and desks) for scenarios with high-level risk when cough source is student 7.
Fig. 23
Fig. 23
Cantors of fraction deposited particles on danger surfaces (faces and desks) for scenarios with high-level risk when cough source is student 10.
Fig. 24
Fig. 24
Contours of fraction deposited particles on danger surfaces (faces and desks) for scenarios with high-level risk when cough source is student 11.
Fig. 25
Fig. 25
Contours of fraction deposited particles on danger surfaces (faces and desks) for scenarios with high-level risk when cough source is student 15.
Fig. 26
Fig. 26
Cantors of fraction deposited particles on danger surfaces (faces and desks) for scenarios with high-level risk when cough source is student 10.
Fig. 27
Fig. 27
Contours of fraction deposited particles on danger surfaces (faces and desks) for scenarios with high-level risk when cough source is student 20.

References

    1. Abboah-Offei M., et al. A rapid review of the use of face mask in preventing the spread of COVID-19. Int. J. Nurs. Stud. Adv. 2021;3:100013. doi: 10.1016/j.ijnsa.2020.100013. August 2020. - DOI - PMC - PubMed
    1. Asadi S., et al. Aerosol emission and superemission during human speech increase with voice loudness. Sci. Rep. 2019;9(1):1–10. doi: 10.1038/s41598-019-38808-z. - DOI - PMC - PubMed
    1. Bake B., et al. Exhaled particles and small airways. Respir. Res. 2019;20(1):1–14. doi: 10.1186/s12931-019-0970-9. - DOI - PMC - PubMed
    1. Bhattacharyya S., et al. A novel CFD analysis to minimize the spread of COVID-19 virus in hospital isolation room. Chaos, Solit. Fractals. 2020;139:110294. doi: 10.1016/j.chaos.2020.110294. - DOI - PMC - PubMed
    1. Borro L., et al. ‘The role of air conditioning in the diffusion of Sars-CoV-2 in indoor environments: a first computational fluid dynamic model, based on investigations performed at the Vatican State Children's hospital’. Environ. Res. 2021;193 doi: 10.1016/j.envres.2020.110343. - DOI - PMC - PubMed

LinkOut - more resources